Dashboard Ninja with AI is a powerful Onvodo®dashboard module that brings next-level business insights through dynamic visualization and artificial intelligence. Designed and compatible across editions, this module gives you interactive, real-time dashboards with automatic AI-generated items helping you make smarter decisions faster.
AI-Powered Dashboard Generation
Create full dashboards or individual dashboard items using AI from simple keywords or data models.
Real-Time Streaming Data
Monitor business performance with live updates that reflect backend changes instantly.
Rich Visualization Tools
Support for many chart types including line, bar, pie, funnel, donut, radar, and more.
Responsive Layout
Dashboards adapt smoothly across desktop, tablet, and mobile devices.
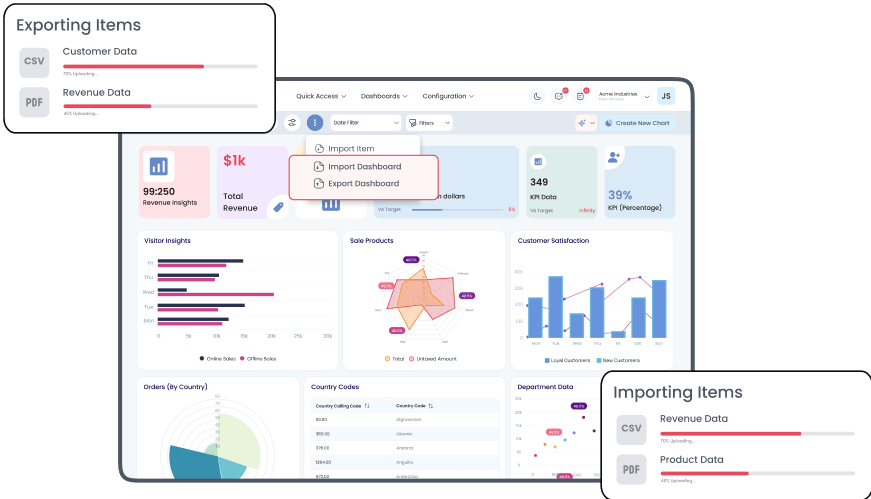
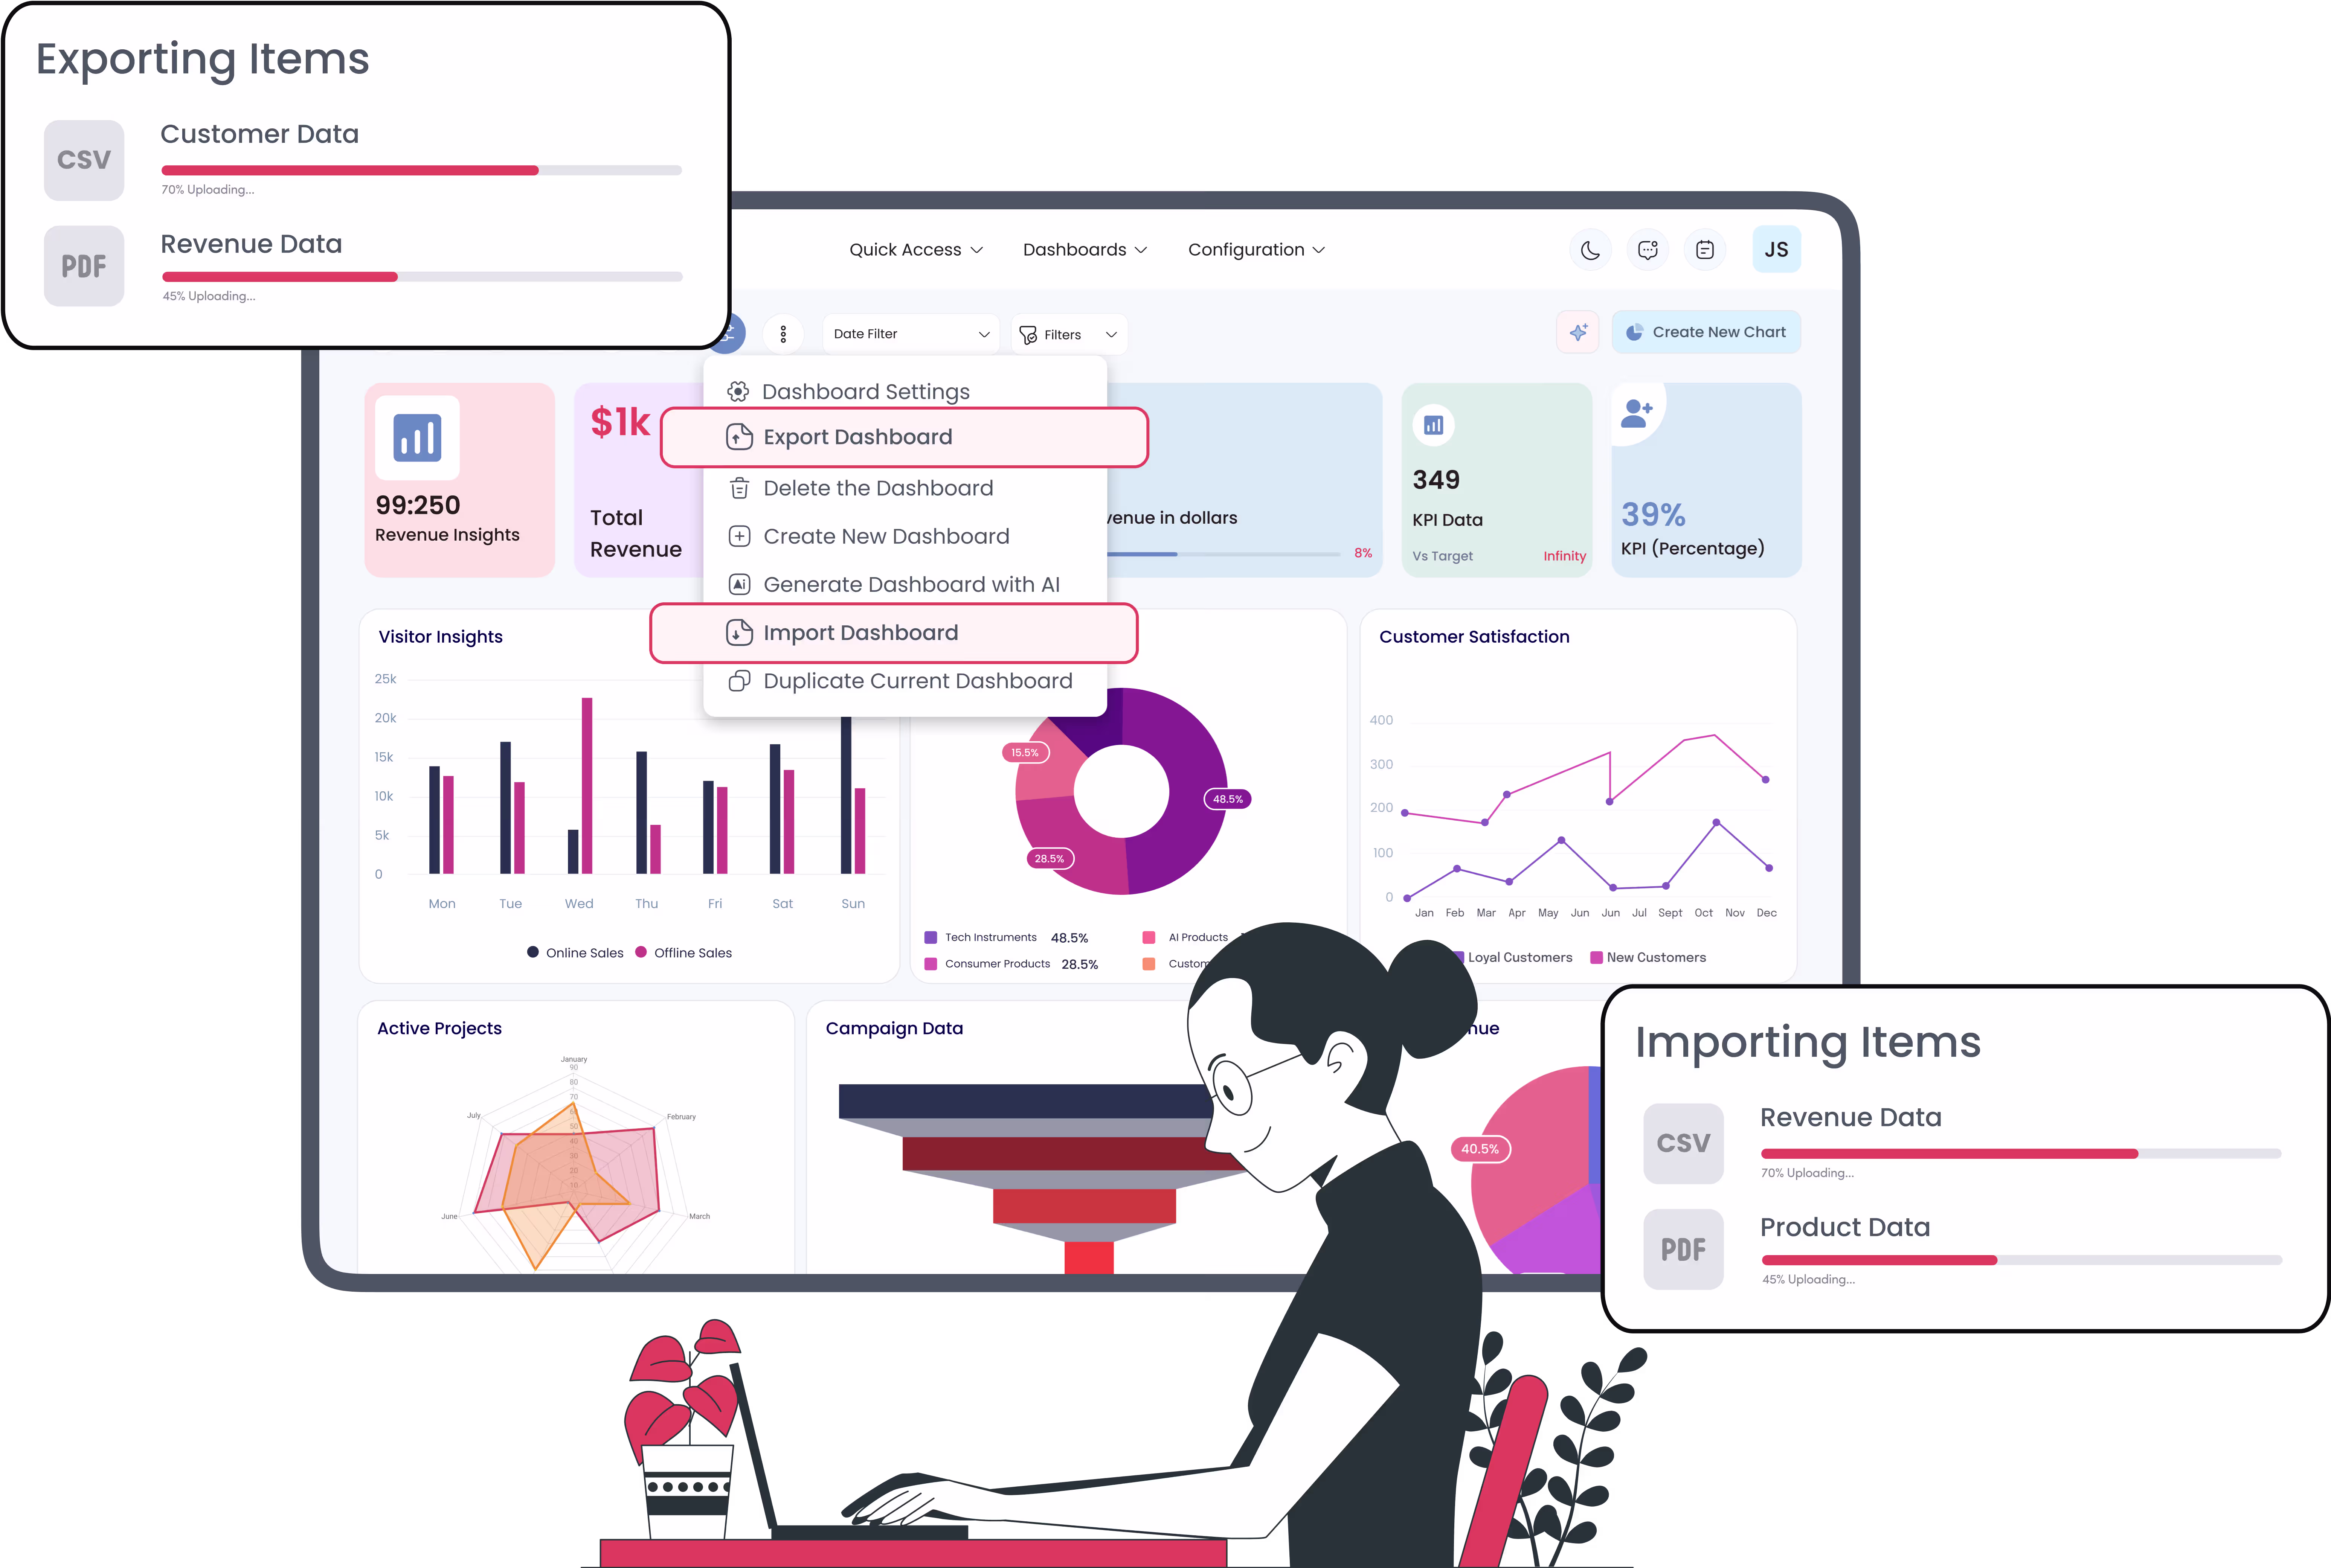
Export & Import Dashboards
Download or transfer dashboards and charts in Excel, CSV, PDF or PNG formats.
Advanced Filters & Interactivity
Use custom date filters, drill-down options, and collaborative features like internal chat per item.
Accelerated Insights: AI helps interpret complex data trends quickly.
Time Savings: Create dashboards without manual setup.
Decision Support: Real-time metrics help you steer operations more effectively.
Universal Compatibility: Works with Community, Enterprise & .sh.
Ninja
Ninja

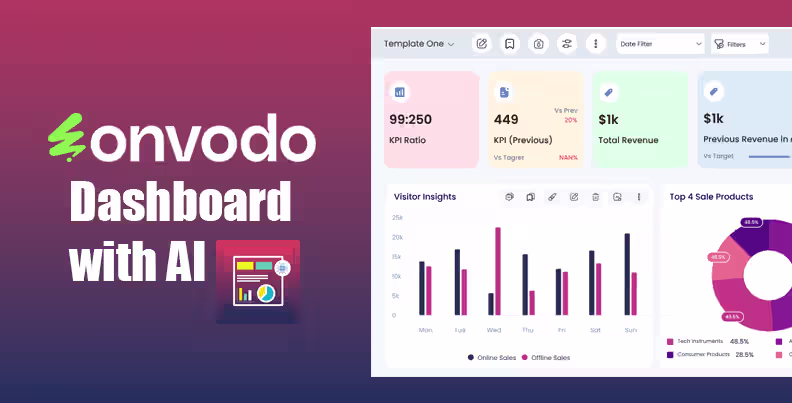
Dashboard Ninja Onvodo® with AI
Create amazing reports with the powerful & smart Onvodo®
Dashboard Ninja Onvodo® app with a
refreshed, modern user interface for effortless navigation
and enhanced user
experience. Enjoy the simplified workflow that makes
everything easy, from
generating dashboards to collaborating with your team
members.
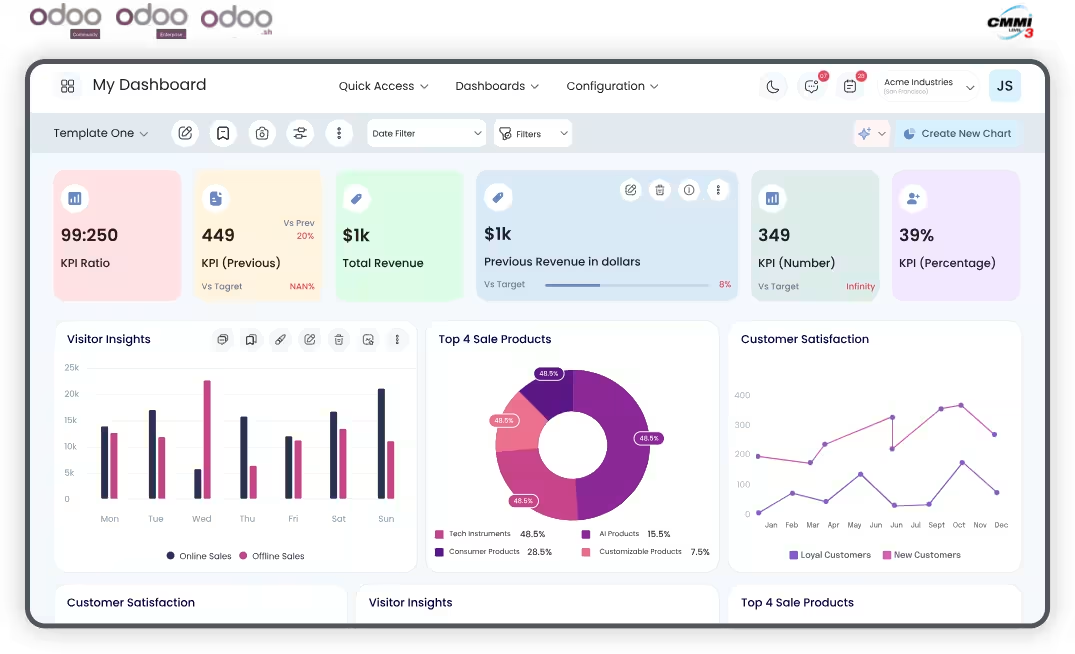
What Sets Dashboard Ninja Onvodo® with AI Apart?
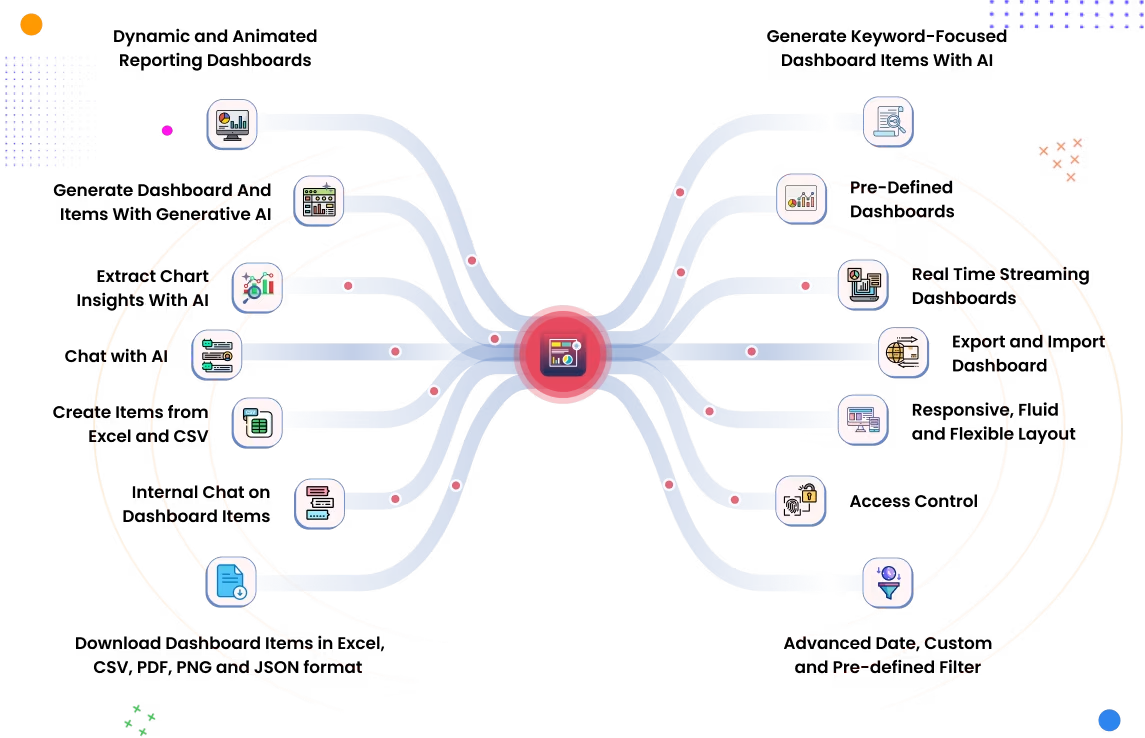
Tired of jumping between modules to track performance? Dashboard Ninja Onvodo® with AI can transform the way you see your Onvodo® data. From sales and inventory to HR and finance, bring everything together in one interactive, real-time dashboard.
You’re just one click away from turning your data into actionable insights!
Latest Release 2.0.0
24th December, 2025
What’s New in Dashboard Ninja Onvodo®
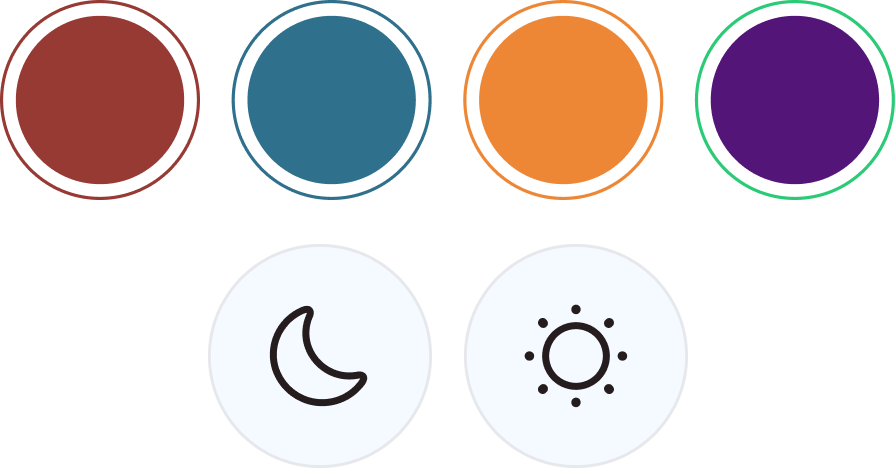
New Theme
Extract Chart Insights with AI
Bookmark Dashboard
Internal Chat
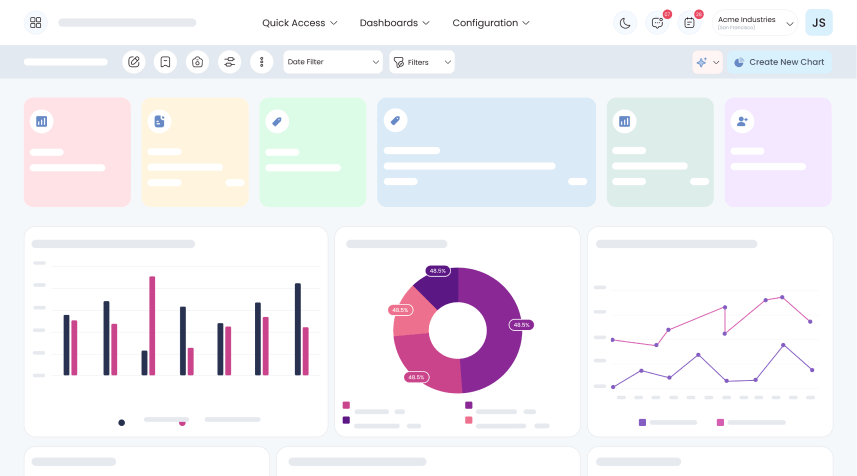
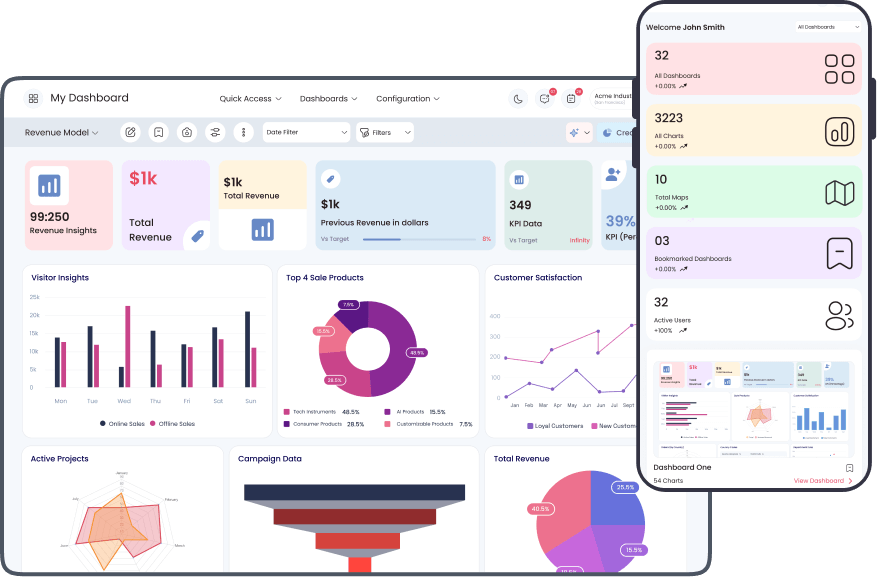
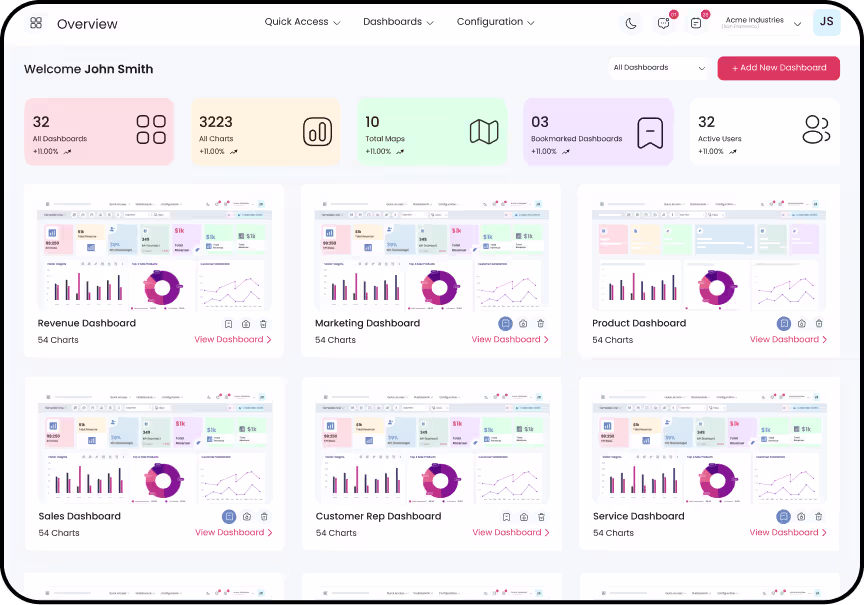
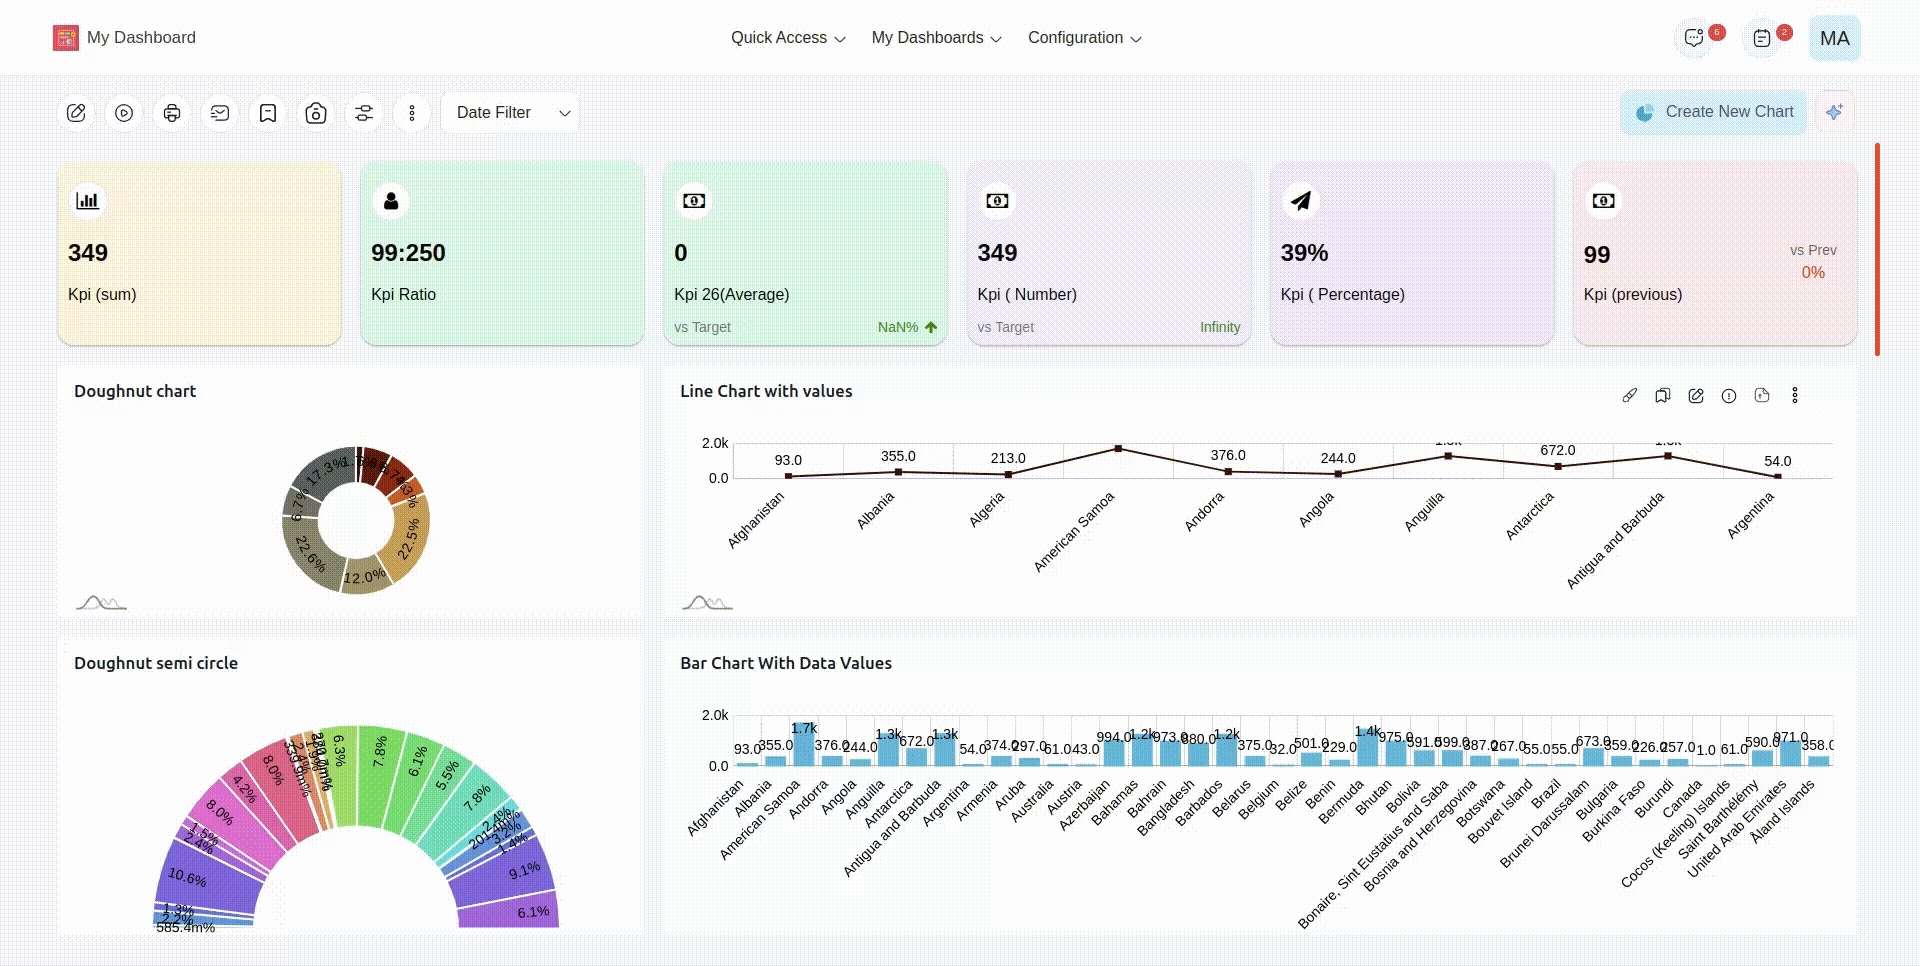
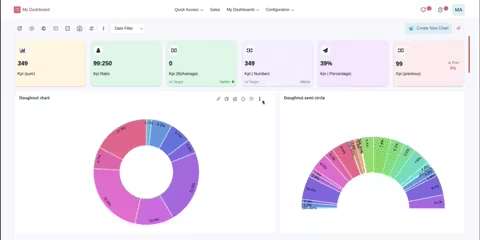
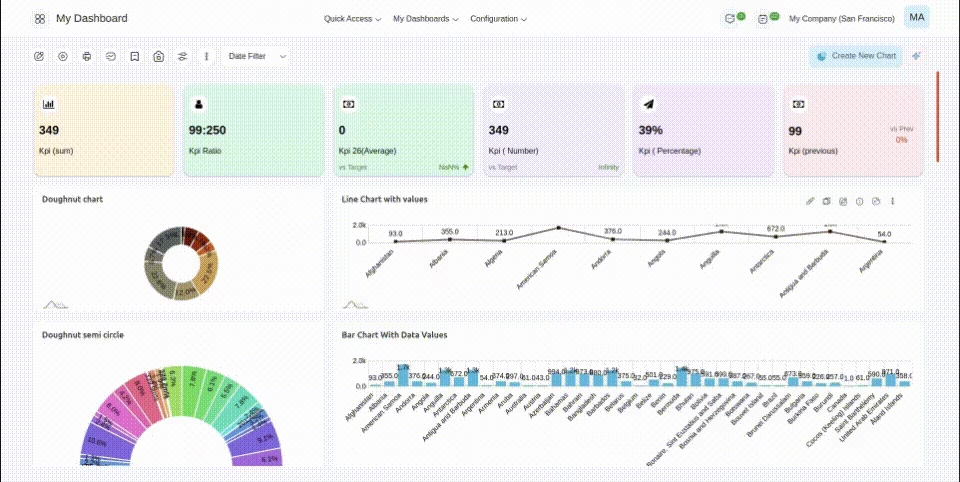
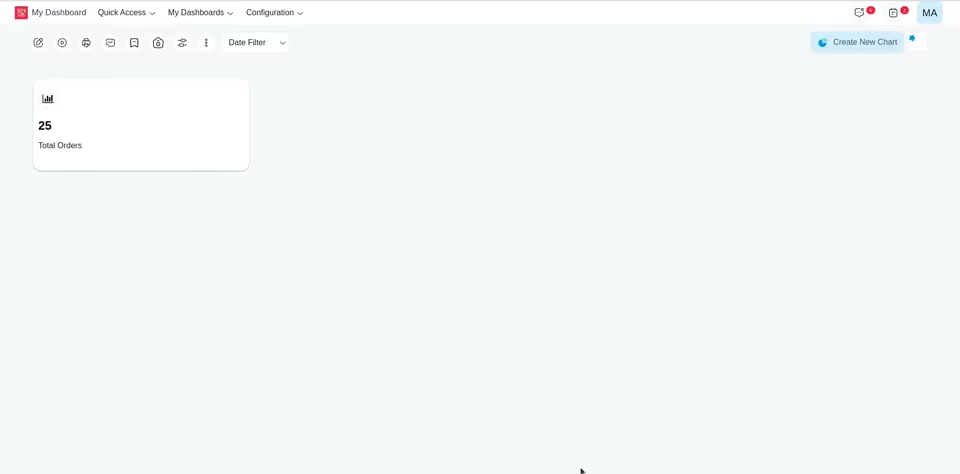
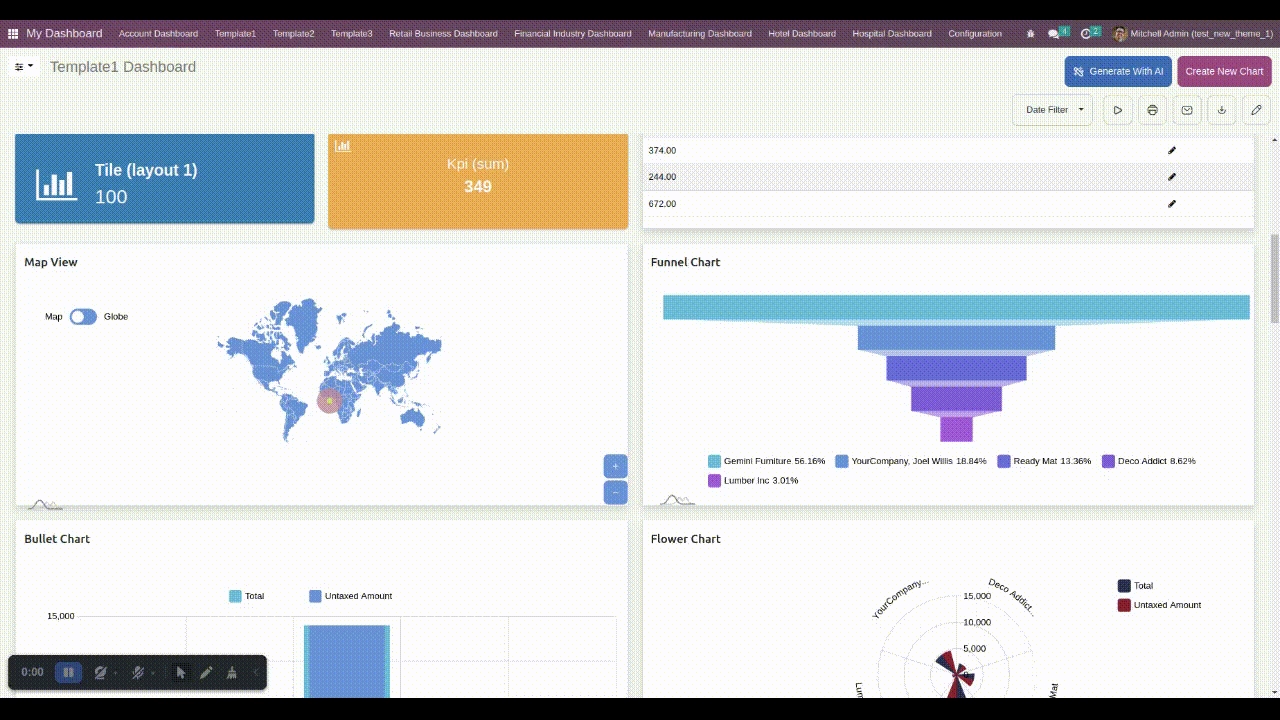
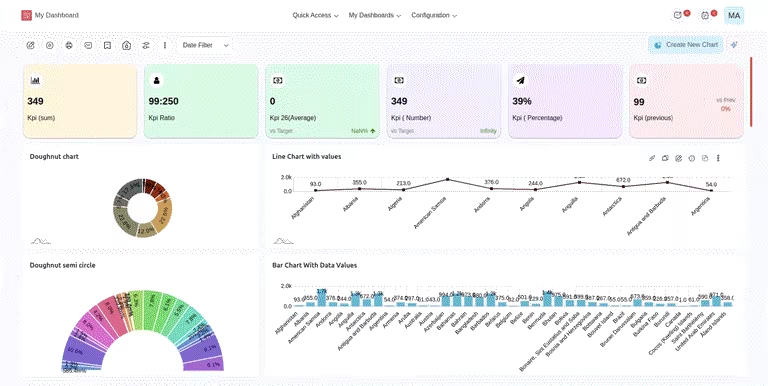
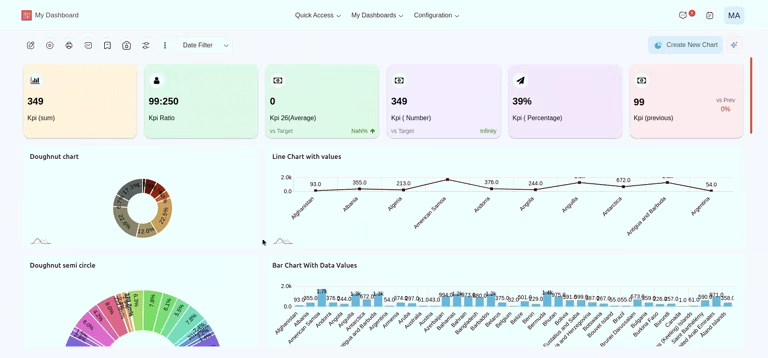
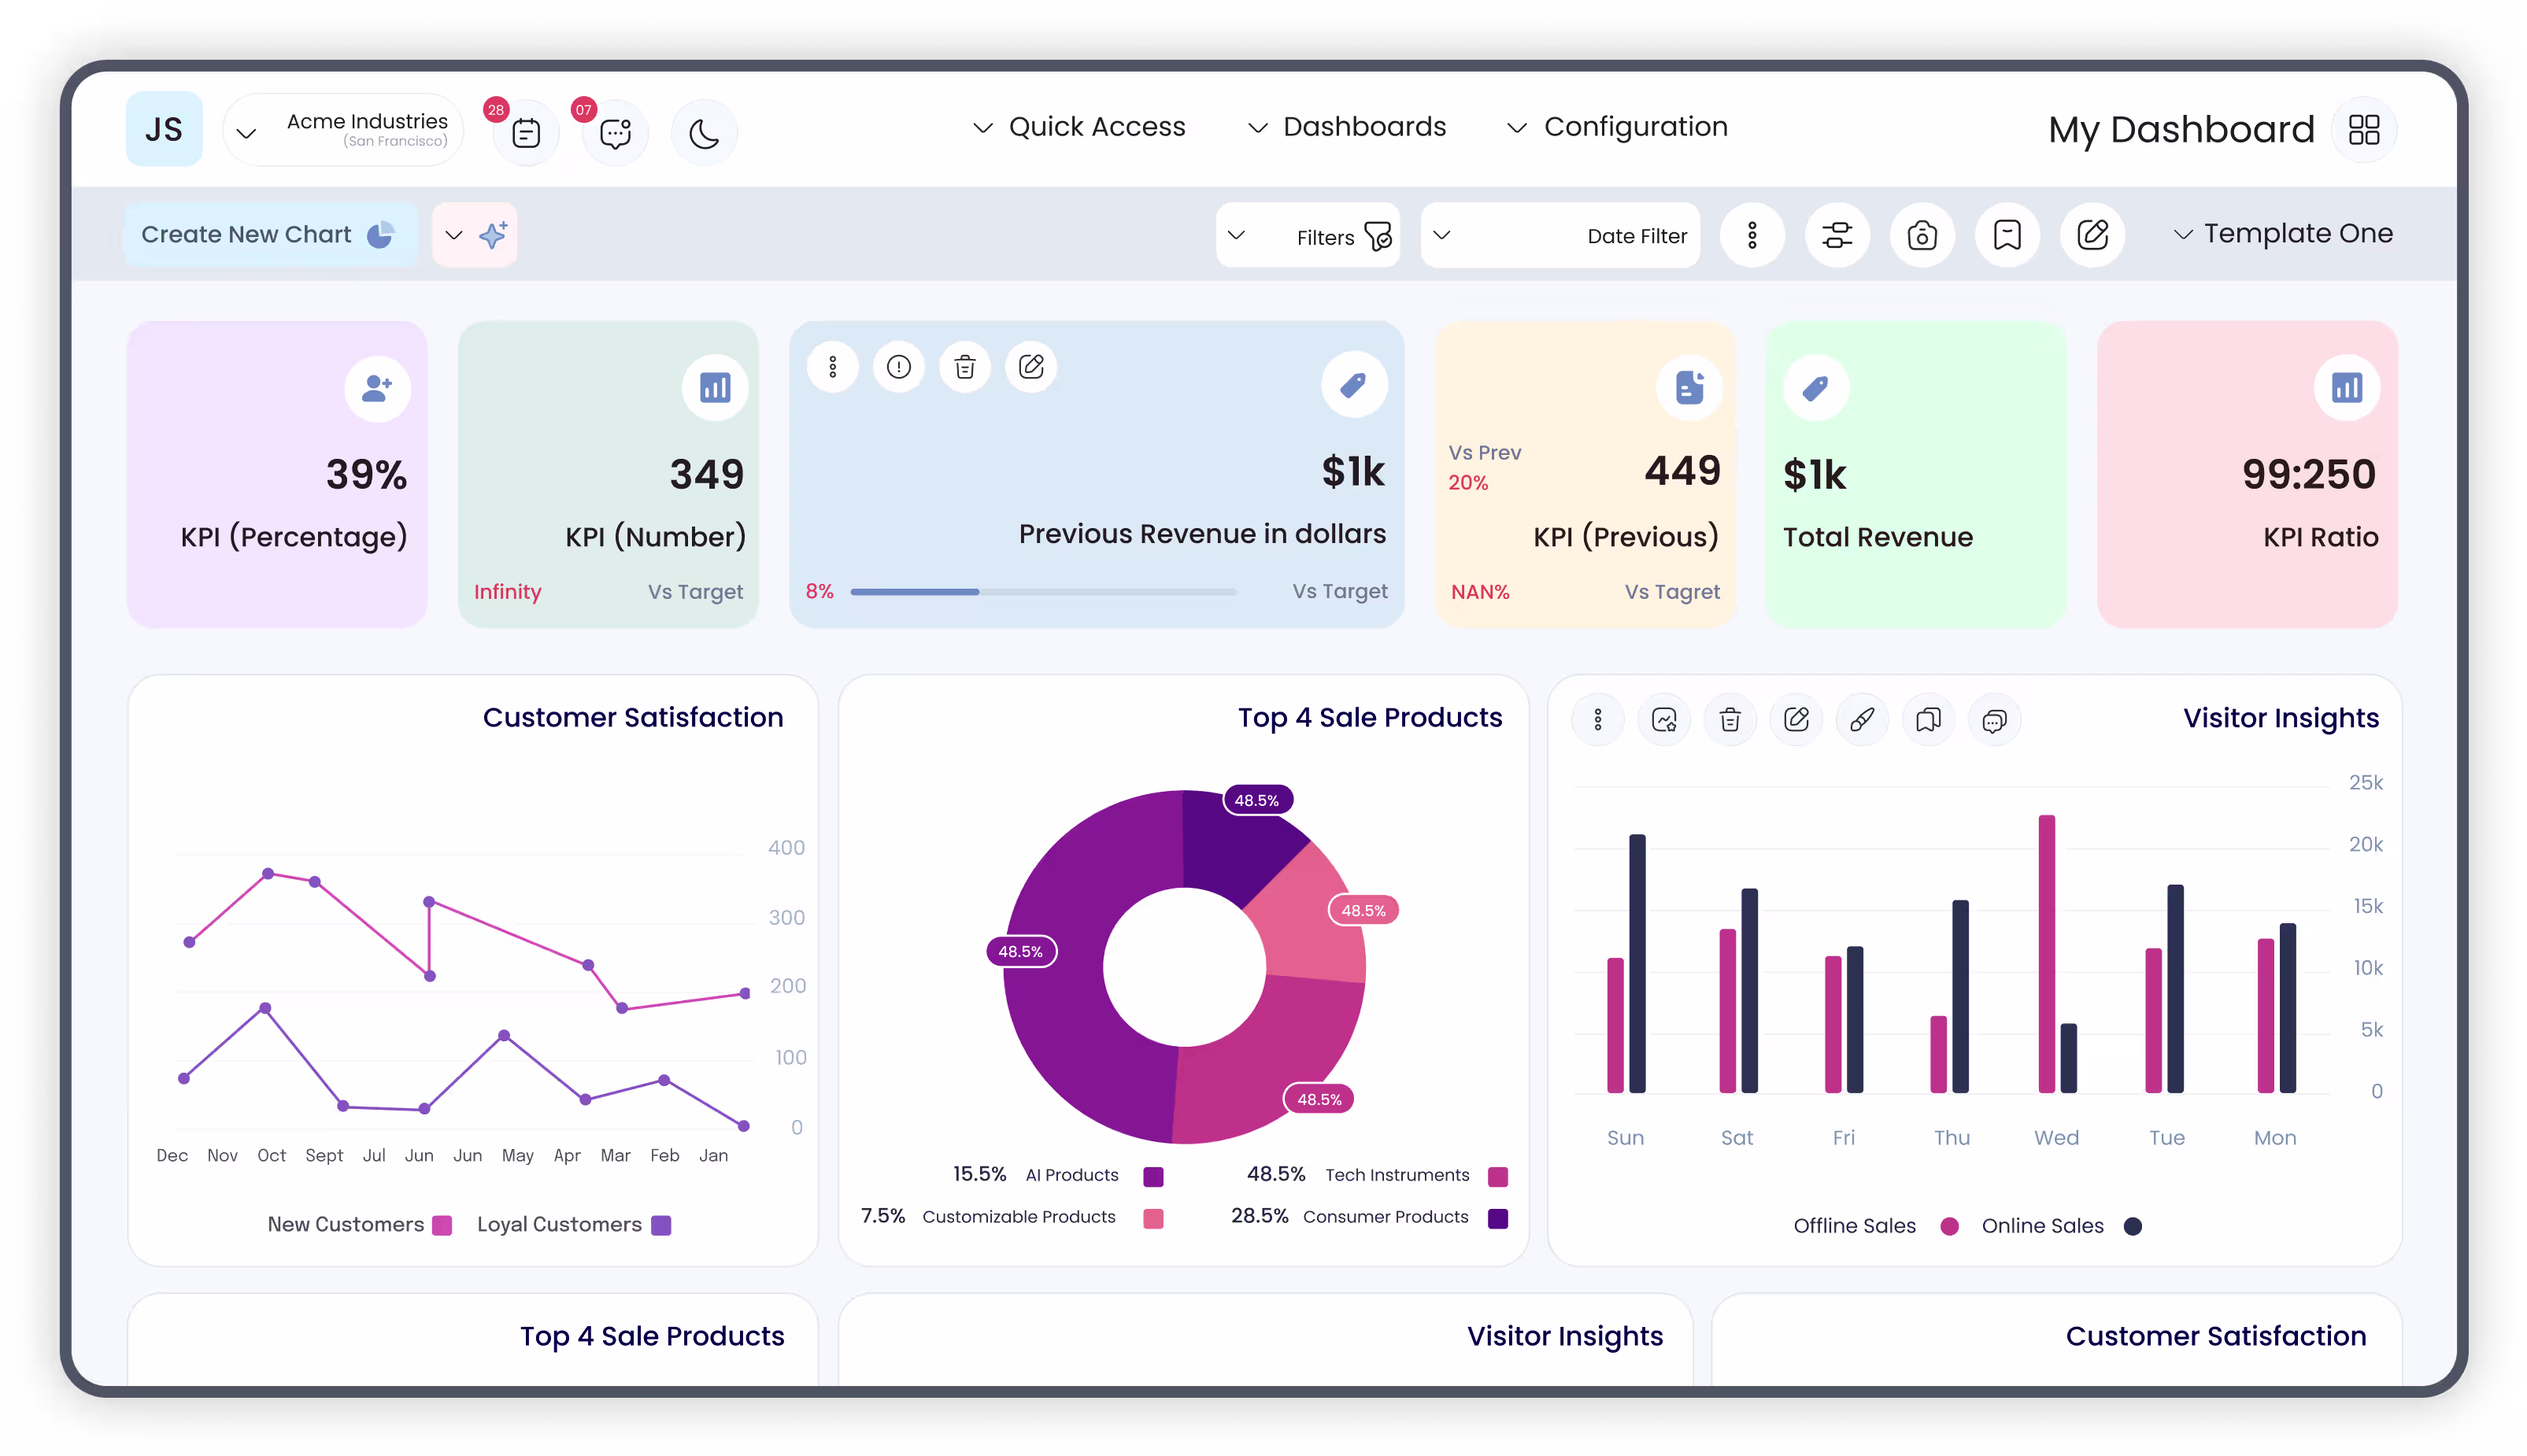
Dashboard Overview
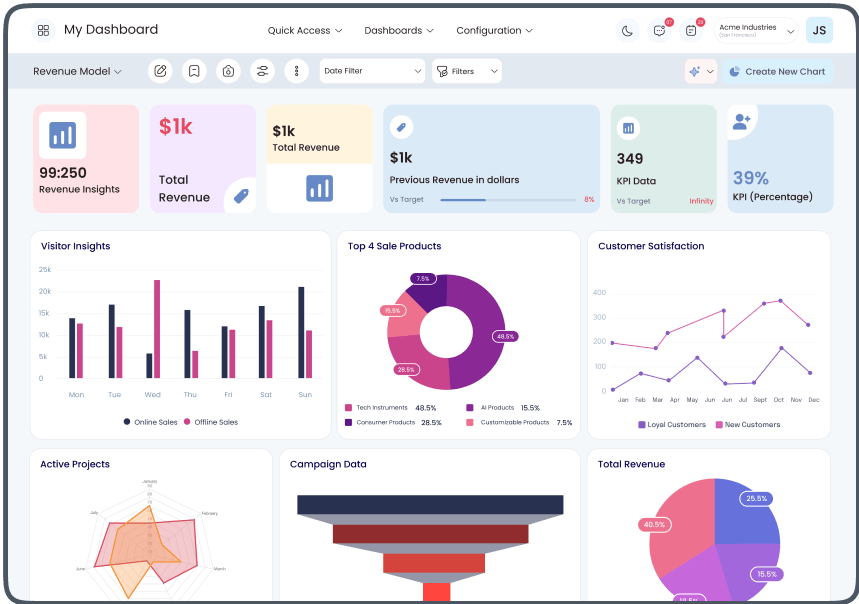
Chart Visualization
Visualize Your Business Like Never Before Create smart, interactive reports with Dashboard Ninja Onvodo® AI.
Schedule your free demo today!

Empower your business with Onvodo® Best Dashboard
tools—customized, insightful, and ready to scale.

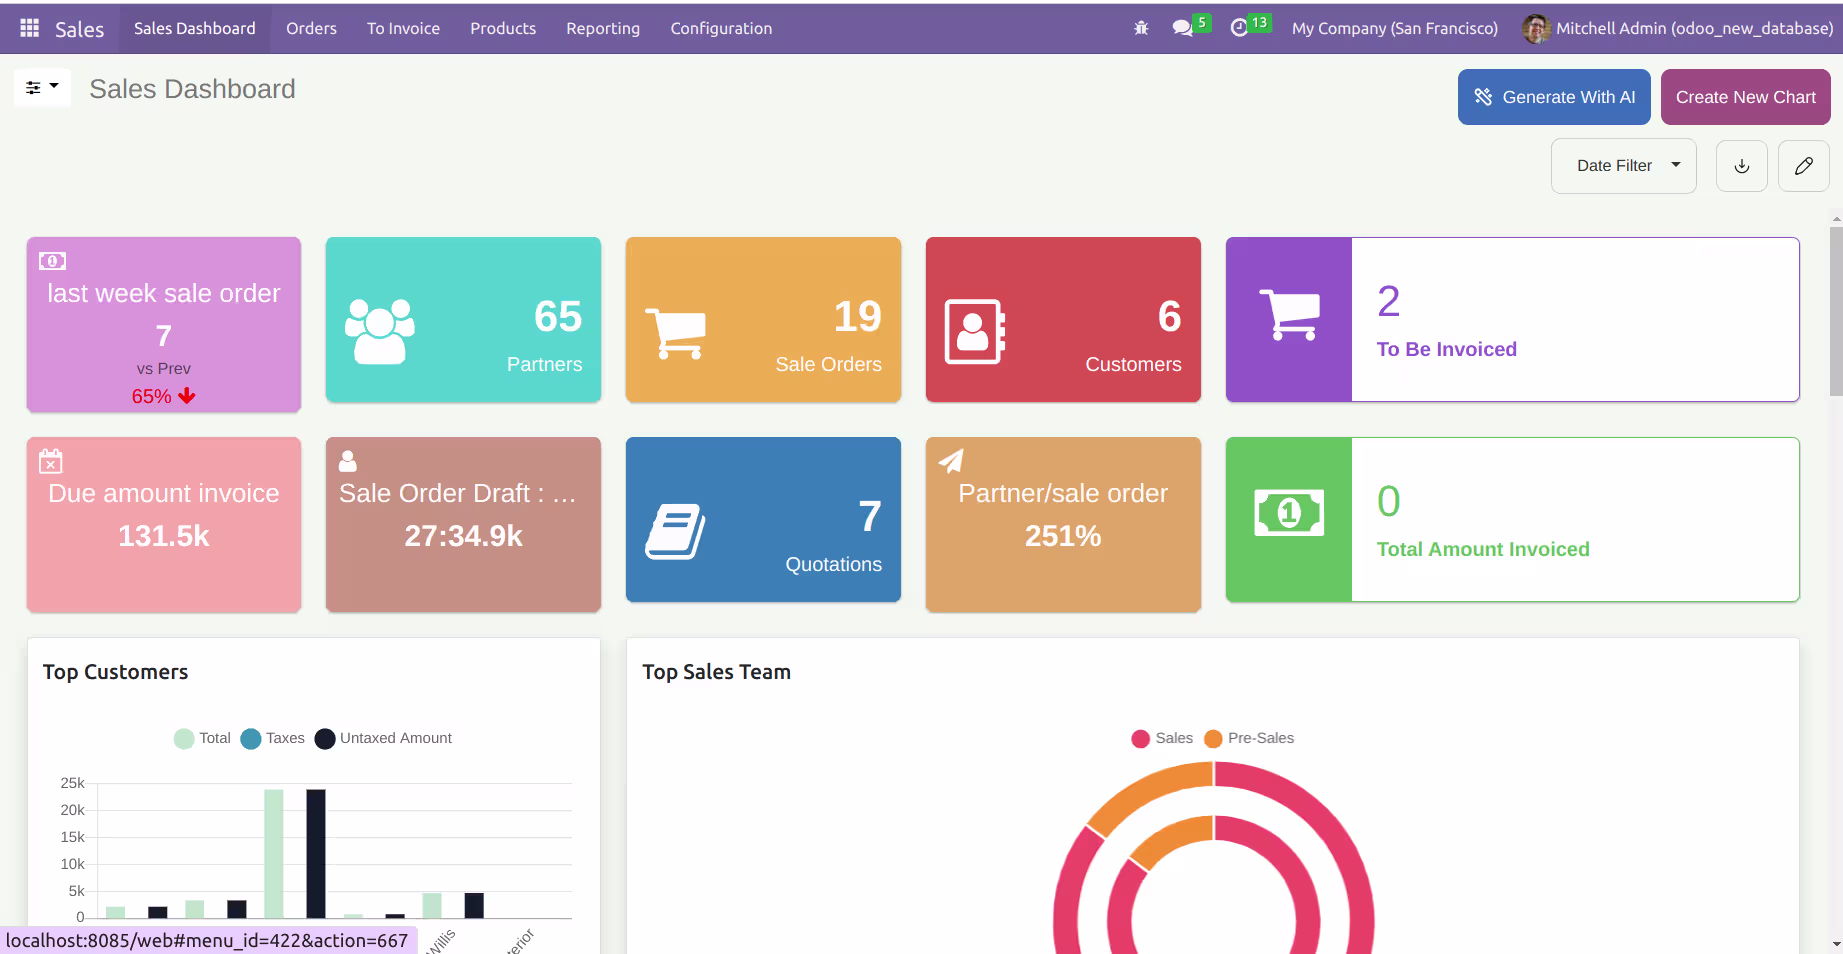
- Track sales with Sales Dashboard and revenue trends.
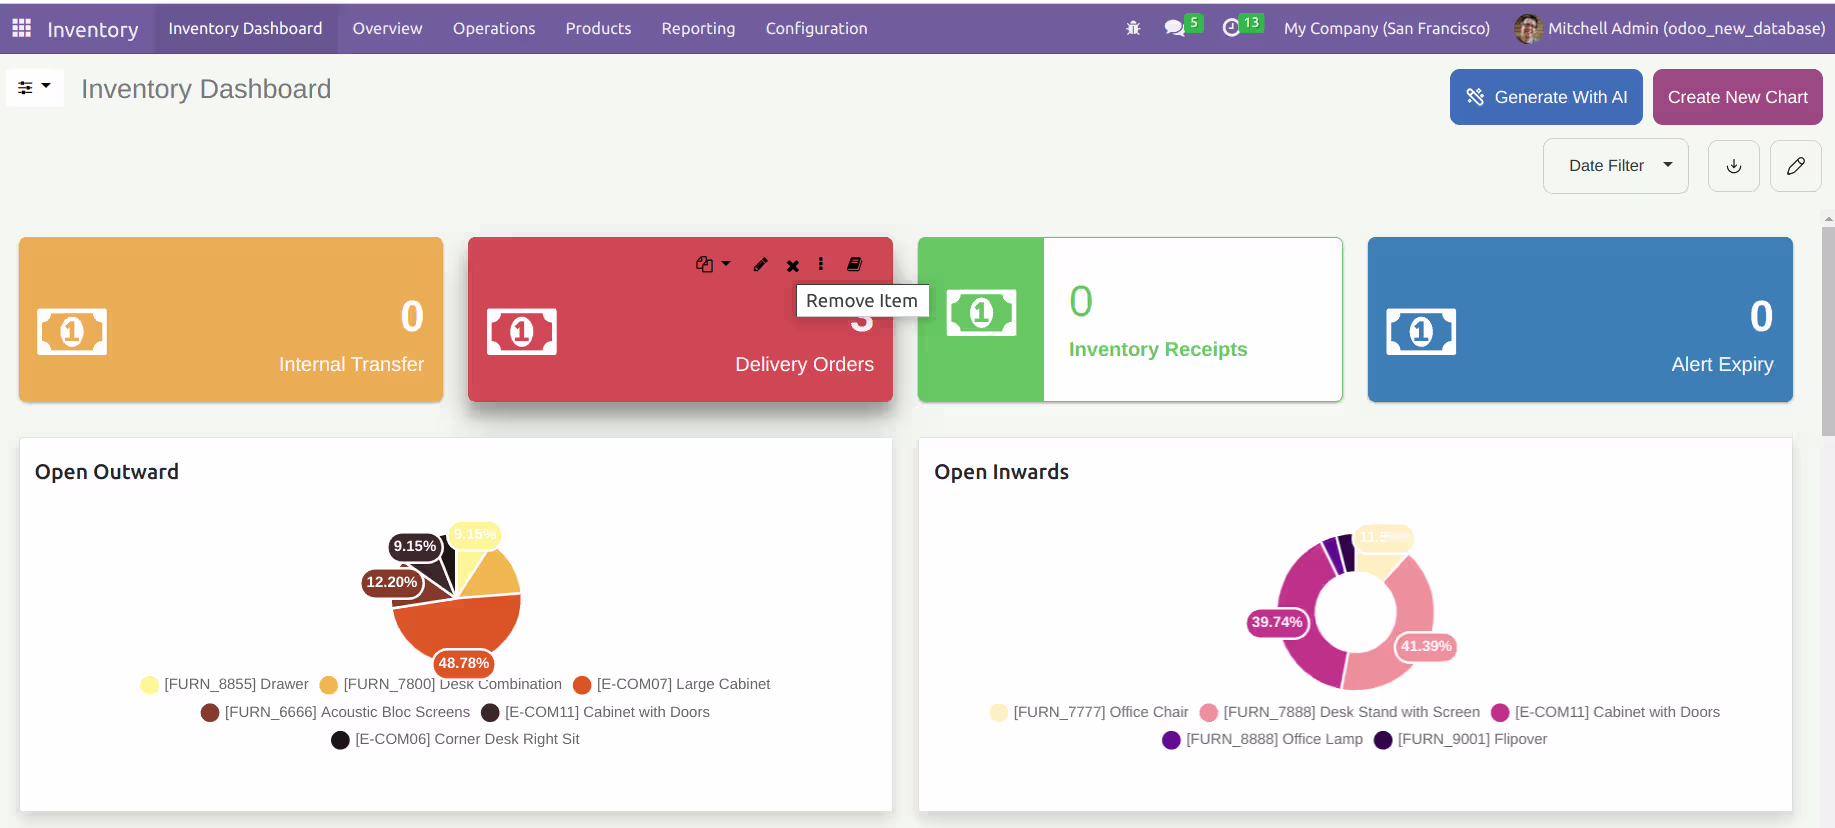
- Monitor stock using Inventory Dashboard.
- Analyze customer data via Analytic Dashboard.
- Create Multiple Dashboards for stores and channels.

- Measure production KPIs in an Advance Dashboard.
- Manage stock with Accounting Stock Dashboard.
- Analyze defects via Chart Graphs Table View.
- Use a Customized Robust Dashboard for supply chain tracking.

- Visualize appointments using a Beautiful Dashboard.
- Monitor medical inventory with Inventory Dashboard.
- Track billing via Invoice Dashboard.
- Manage staff through a Modern Dashboard.

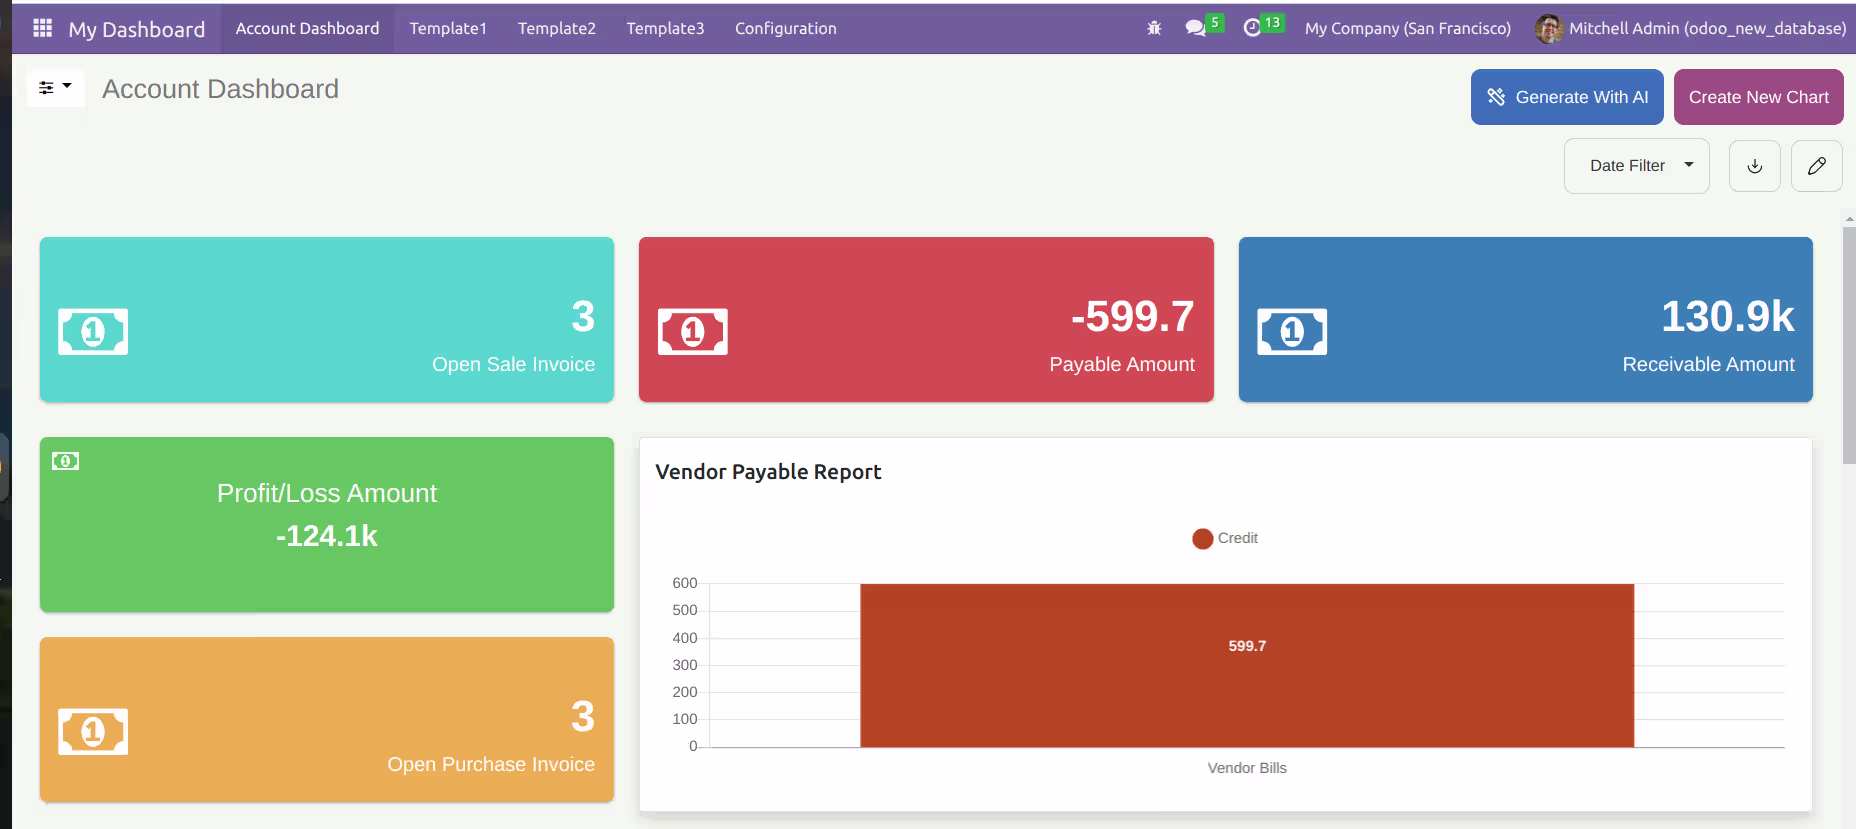
- View financials in an Account Dashboard.
- Track invoices through an Invoice Dashboard.
- Monitor ROI with Onvodo® Best Dashboard.
- Build Pre-Configured Dashboards for audits.

- Review student data with an Analytic Dashboard.
- Track attendance in a Predefined Dashboard.
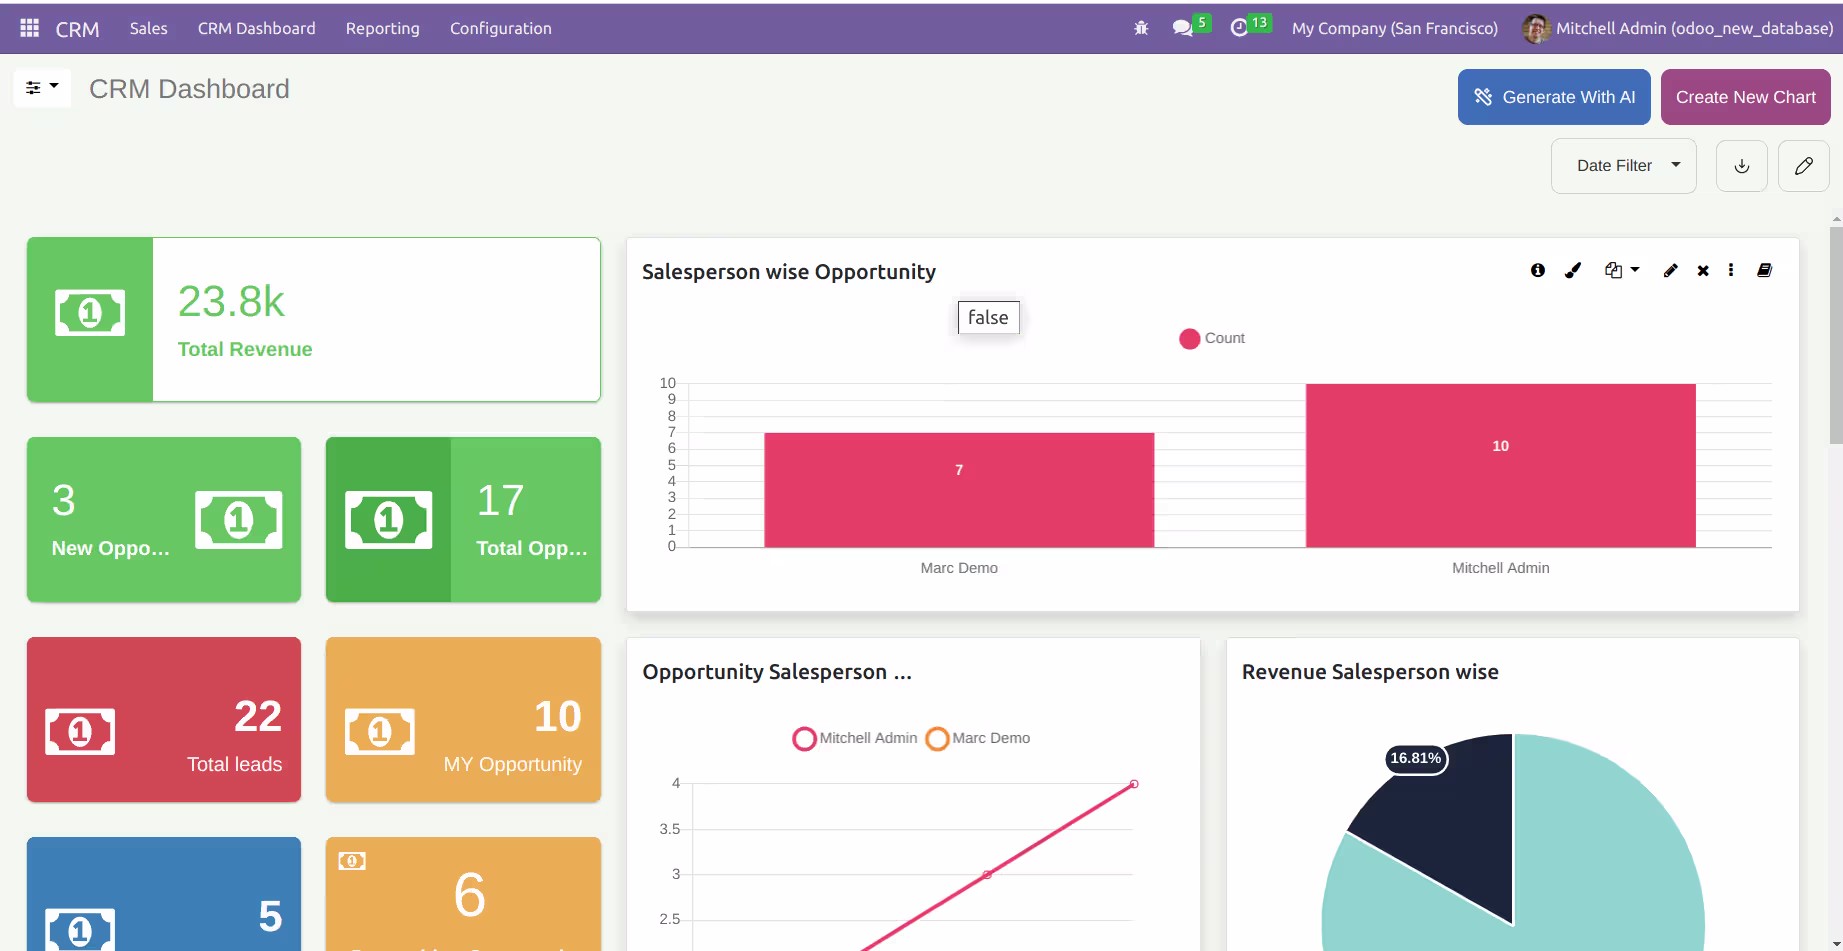
- Analyze leads via CRM Dashboard.
- Use a Beautiful Powerful Dashboard for faculty KPIs.

- Analyze leads using Onvodo® Dashboard.
- Track visits in a Best Ninja Dashboard.
- Use Beautiful Dashboards for sales insights.
- Create a Dashboard Studio for agents.

- Track delivery with a Dynamic Dashboard.
- Monitor routes via Chart Graphs Table View.
- View fuel data in a Robust Dashboard.
- Combine KPIs using Multiple Dashboards.

- Track bookings using CRM Dashboard.
- Analyze revenue via a Sales Dashboard.
- Monitor campaigns in a Revamp Dashboard.
- Build a Customized Dashboard per property.

- Track sprints in an Advance Dashboard.
- Monitor users via Analytic Dashboard.
- View support KPIs with Onvodo® Studio.
- Build an All-In-One Dynamic Dashboard.

- View donations in a Predefined Dashboard.
- Track volunteers through a Customized Robust Dashboard.
- Analyze campaigns using a Pie Chart Dashboard.
- Share results with a Beautiful Powerful Dashboard.

- Manage content pipelines with a Dynamic Dashboard.
- Track ad revenue using Sales Dashboard.
- Monitor user engagement with Analytic Dashboards.
- Build Customized Dashboards for streaming, publishing, or events.

- Track case progress with a Modern Dashboard.
- Monitor billable hours via Invoice Dashboard.
- Manage documentation through a Predefined Dashboard.
- Ensure regulatory compliance using a Customized Robust Dashboard.
Onvodo® - Your
one-stop
solution
We are available 24/7 for your service. Contact us today!
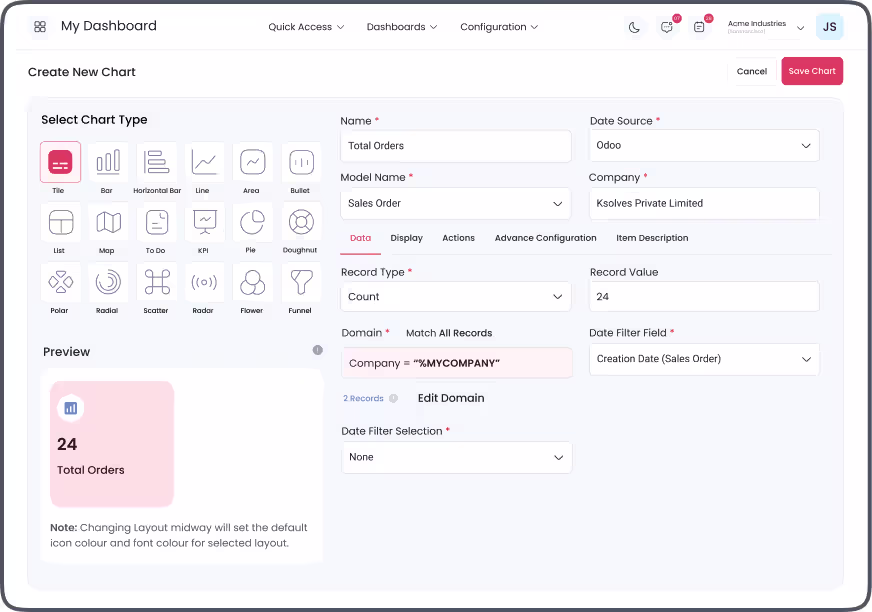
Dashboard Ninja Onvodo® Charts
Supports 17 impressive Onvodo® dashboard item types for easy business data interpretation. (Tiles, Line Chart, List View, Bar Chart, Horizontal Bar Chart, Area Chart, To-do Item, Polar Area Chart, Pie Chart, Doughnut Charts, Flower Chart, Funnel Chart, Radial Chart, Radar Chart, Scatter Chart, Bullet Chart & Map view)


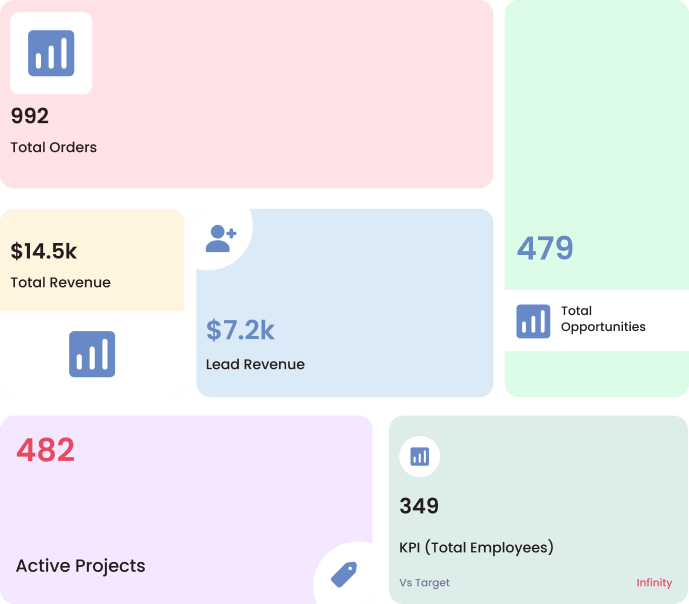
Display key performance indicators (KIPs) in small square-shaped visualizations for a quick glance

Visualize data trends, changes, or relationships over time by connecting data points with straight lines.
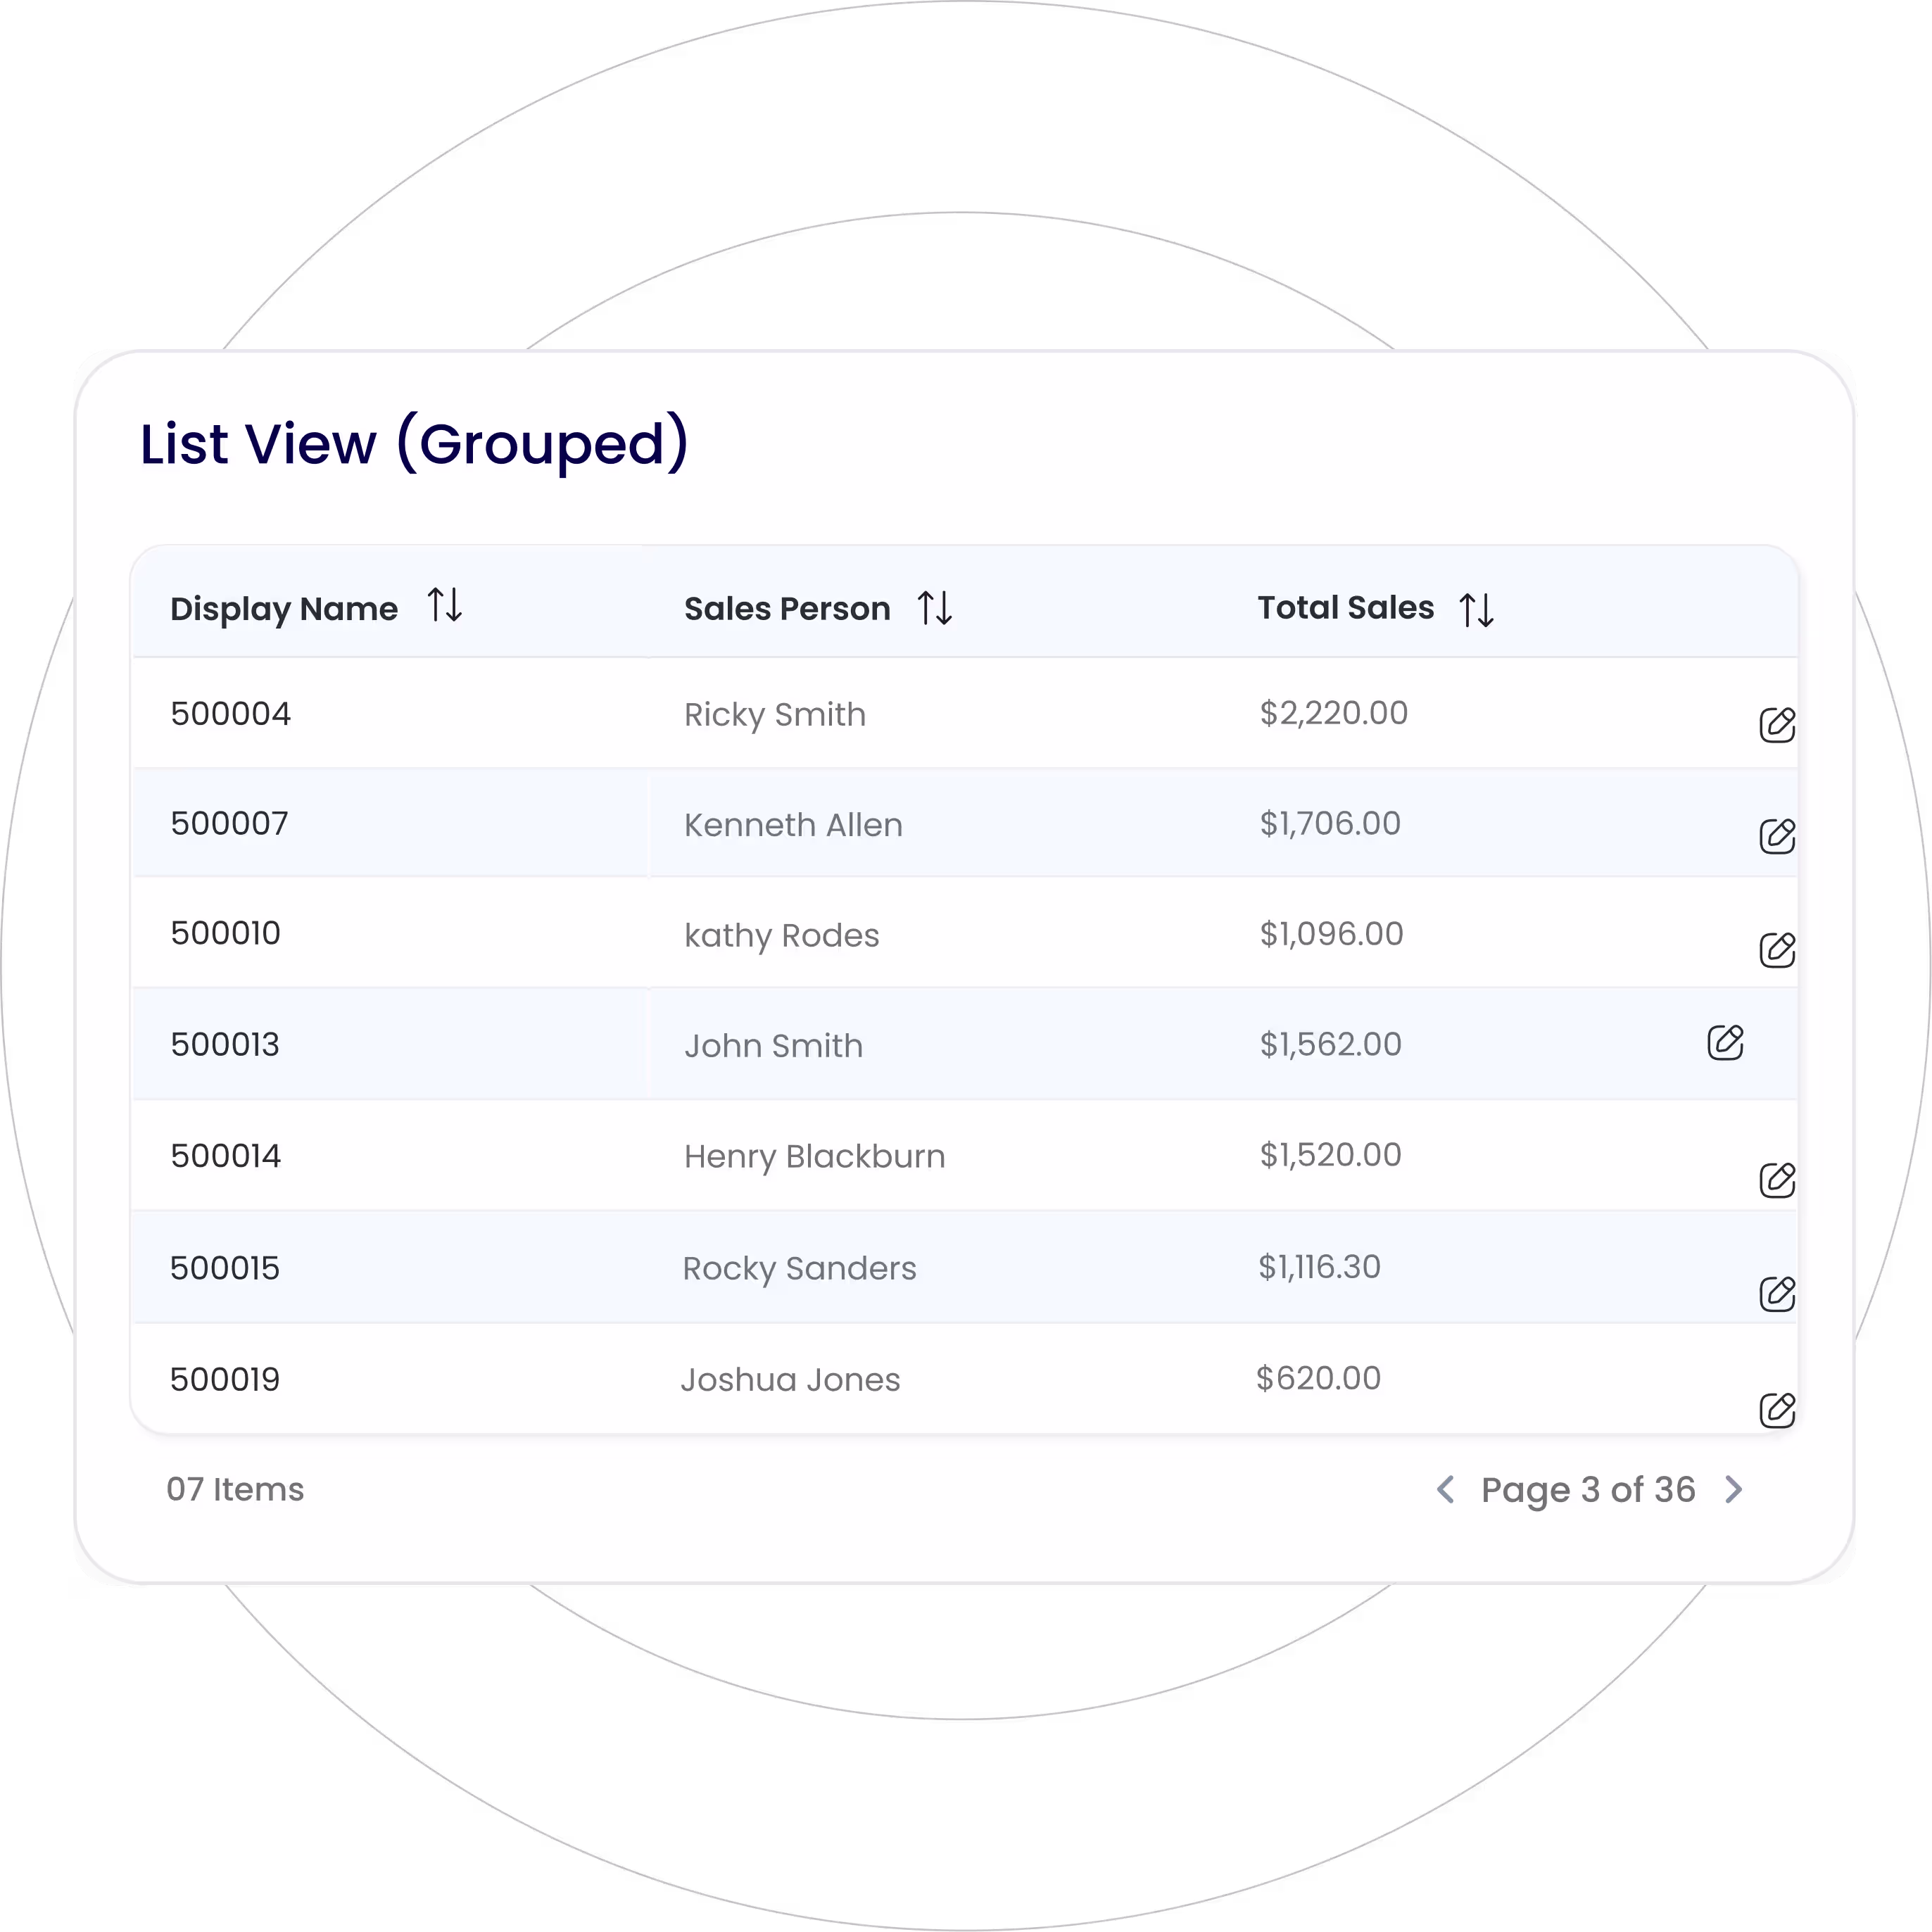
Present detailed data in a tabular format with rows and columns for easy sorting and comparison.
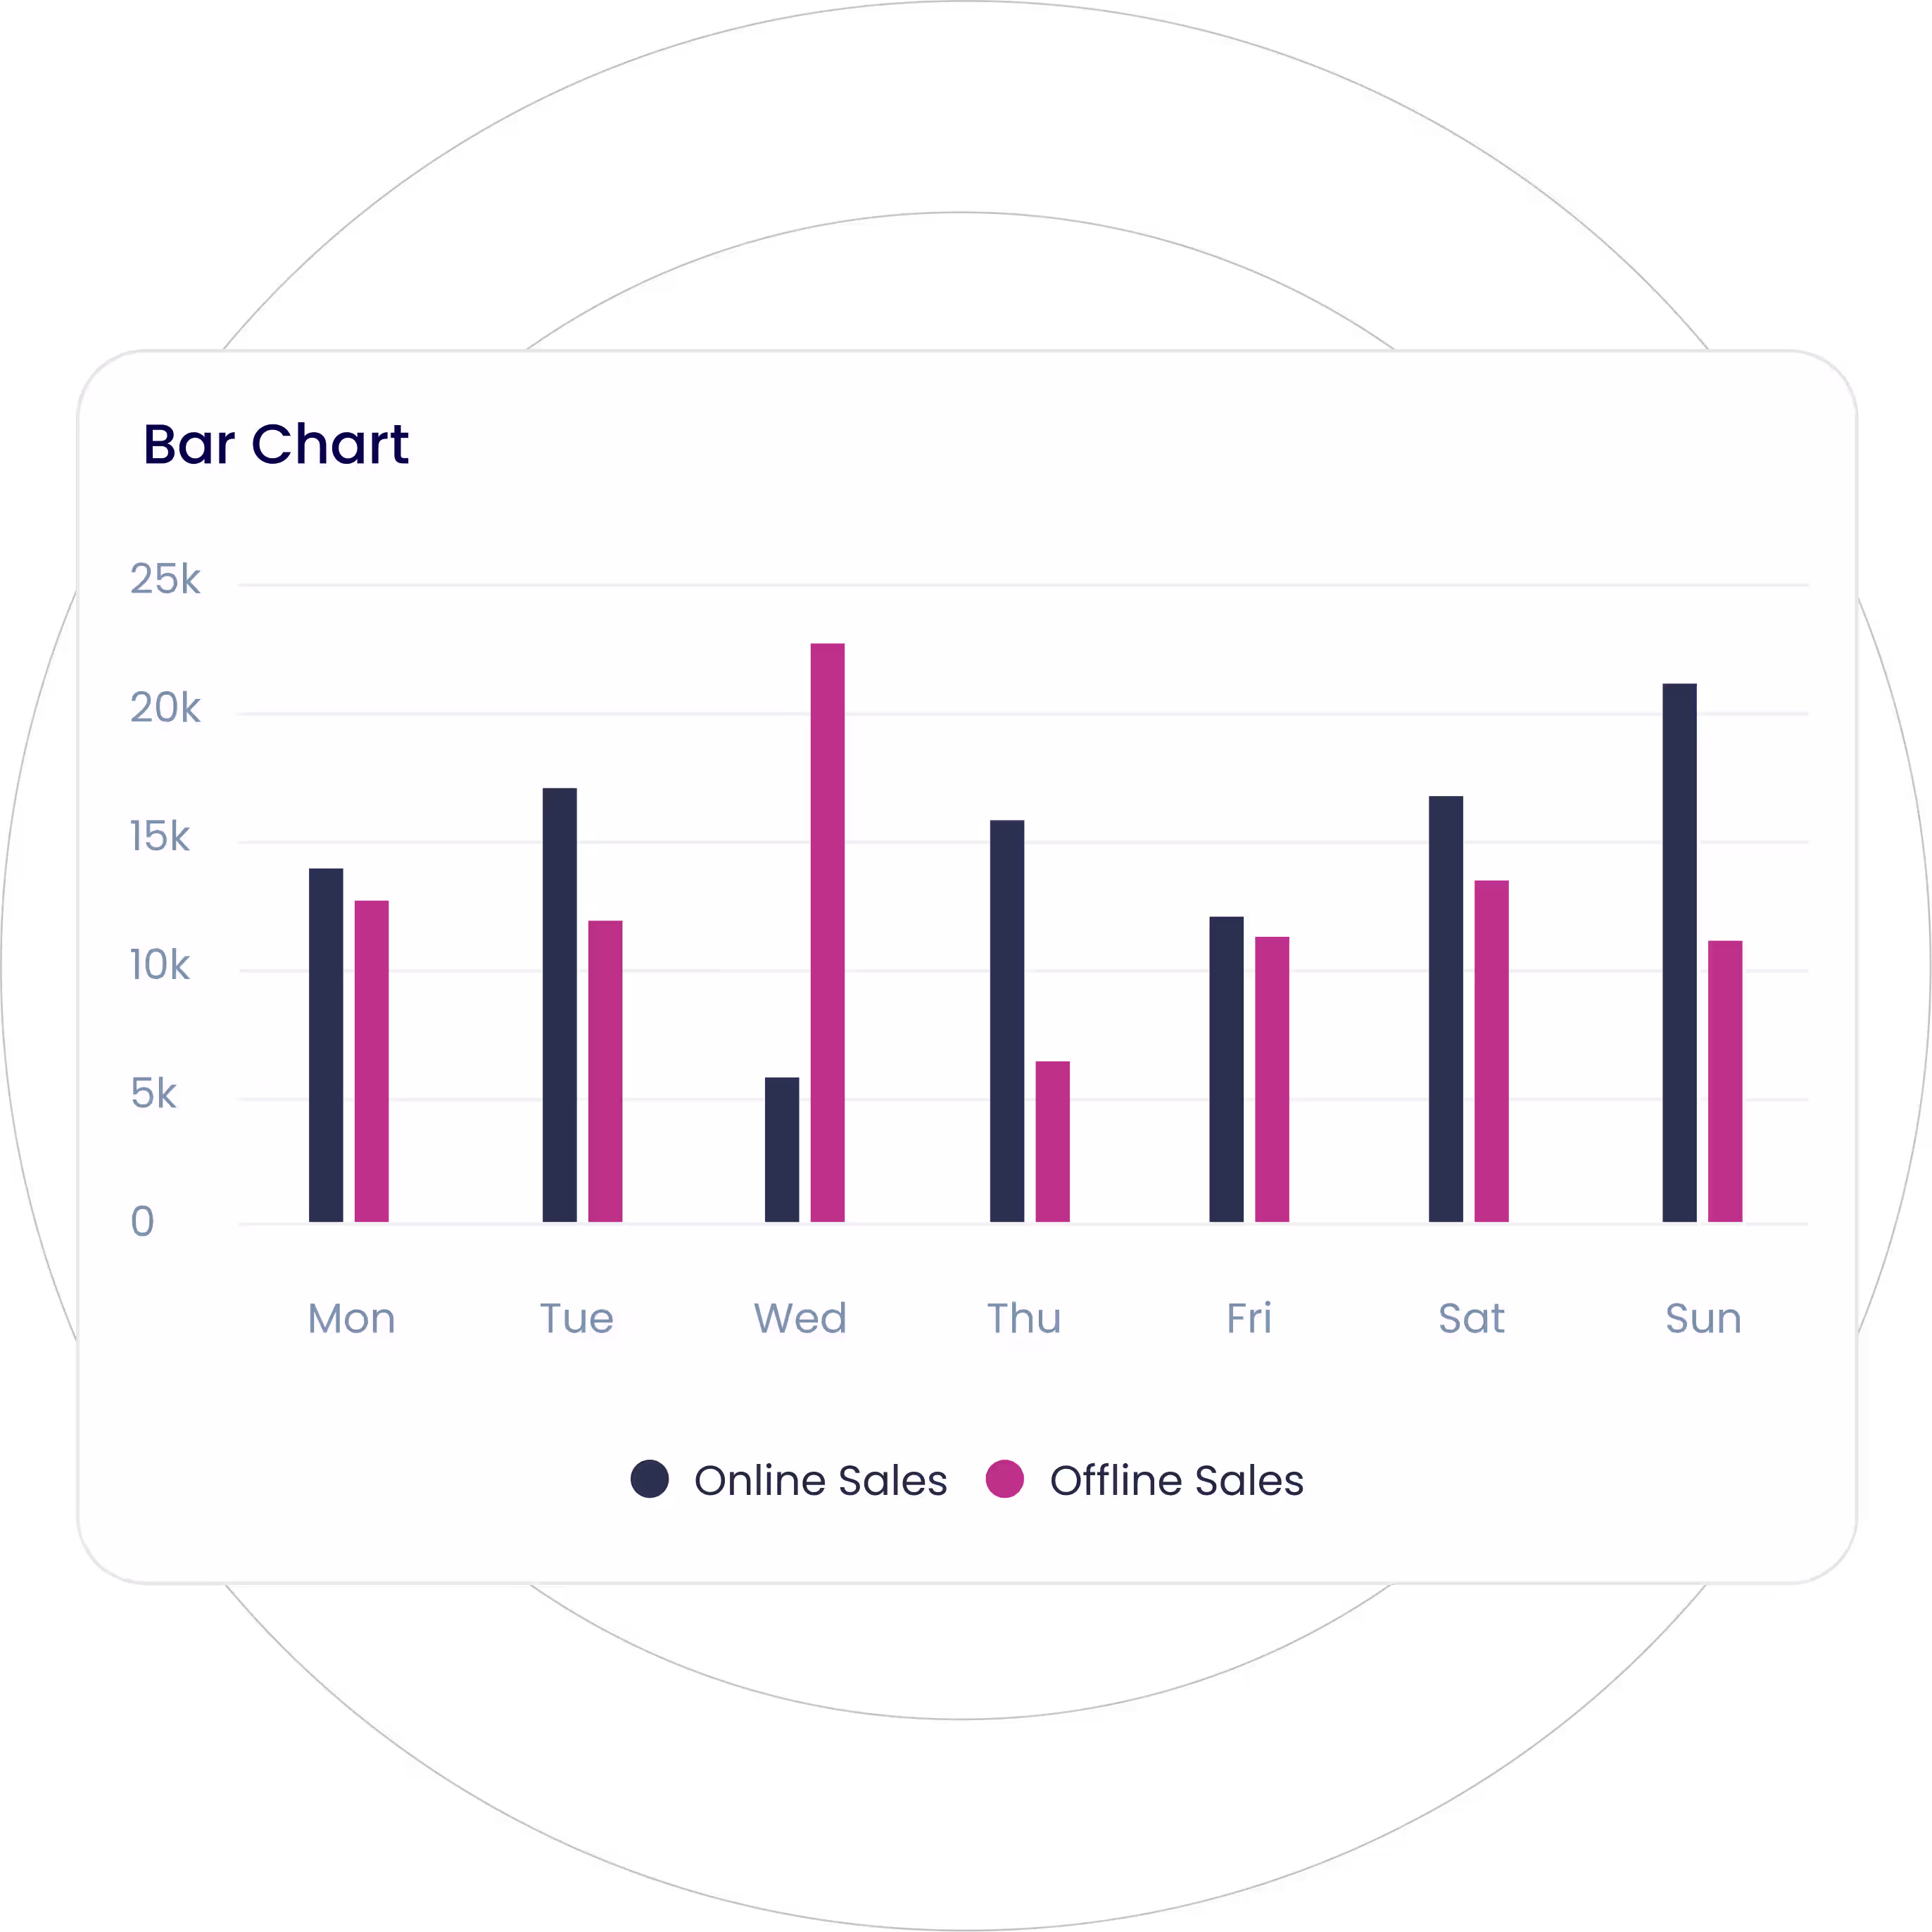
Visualize categorical data with rectangular vertical bars with the height proportionate to the value they represent.
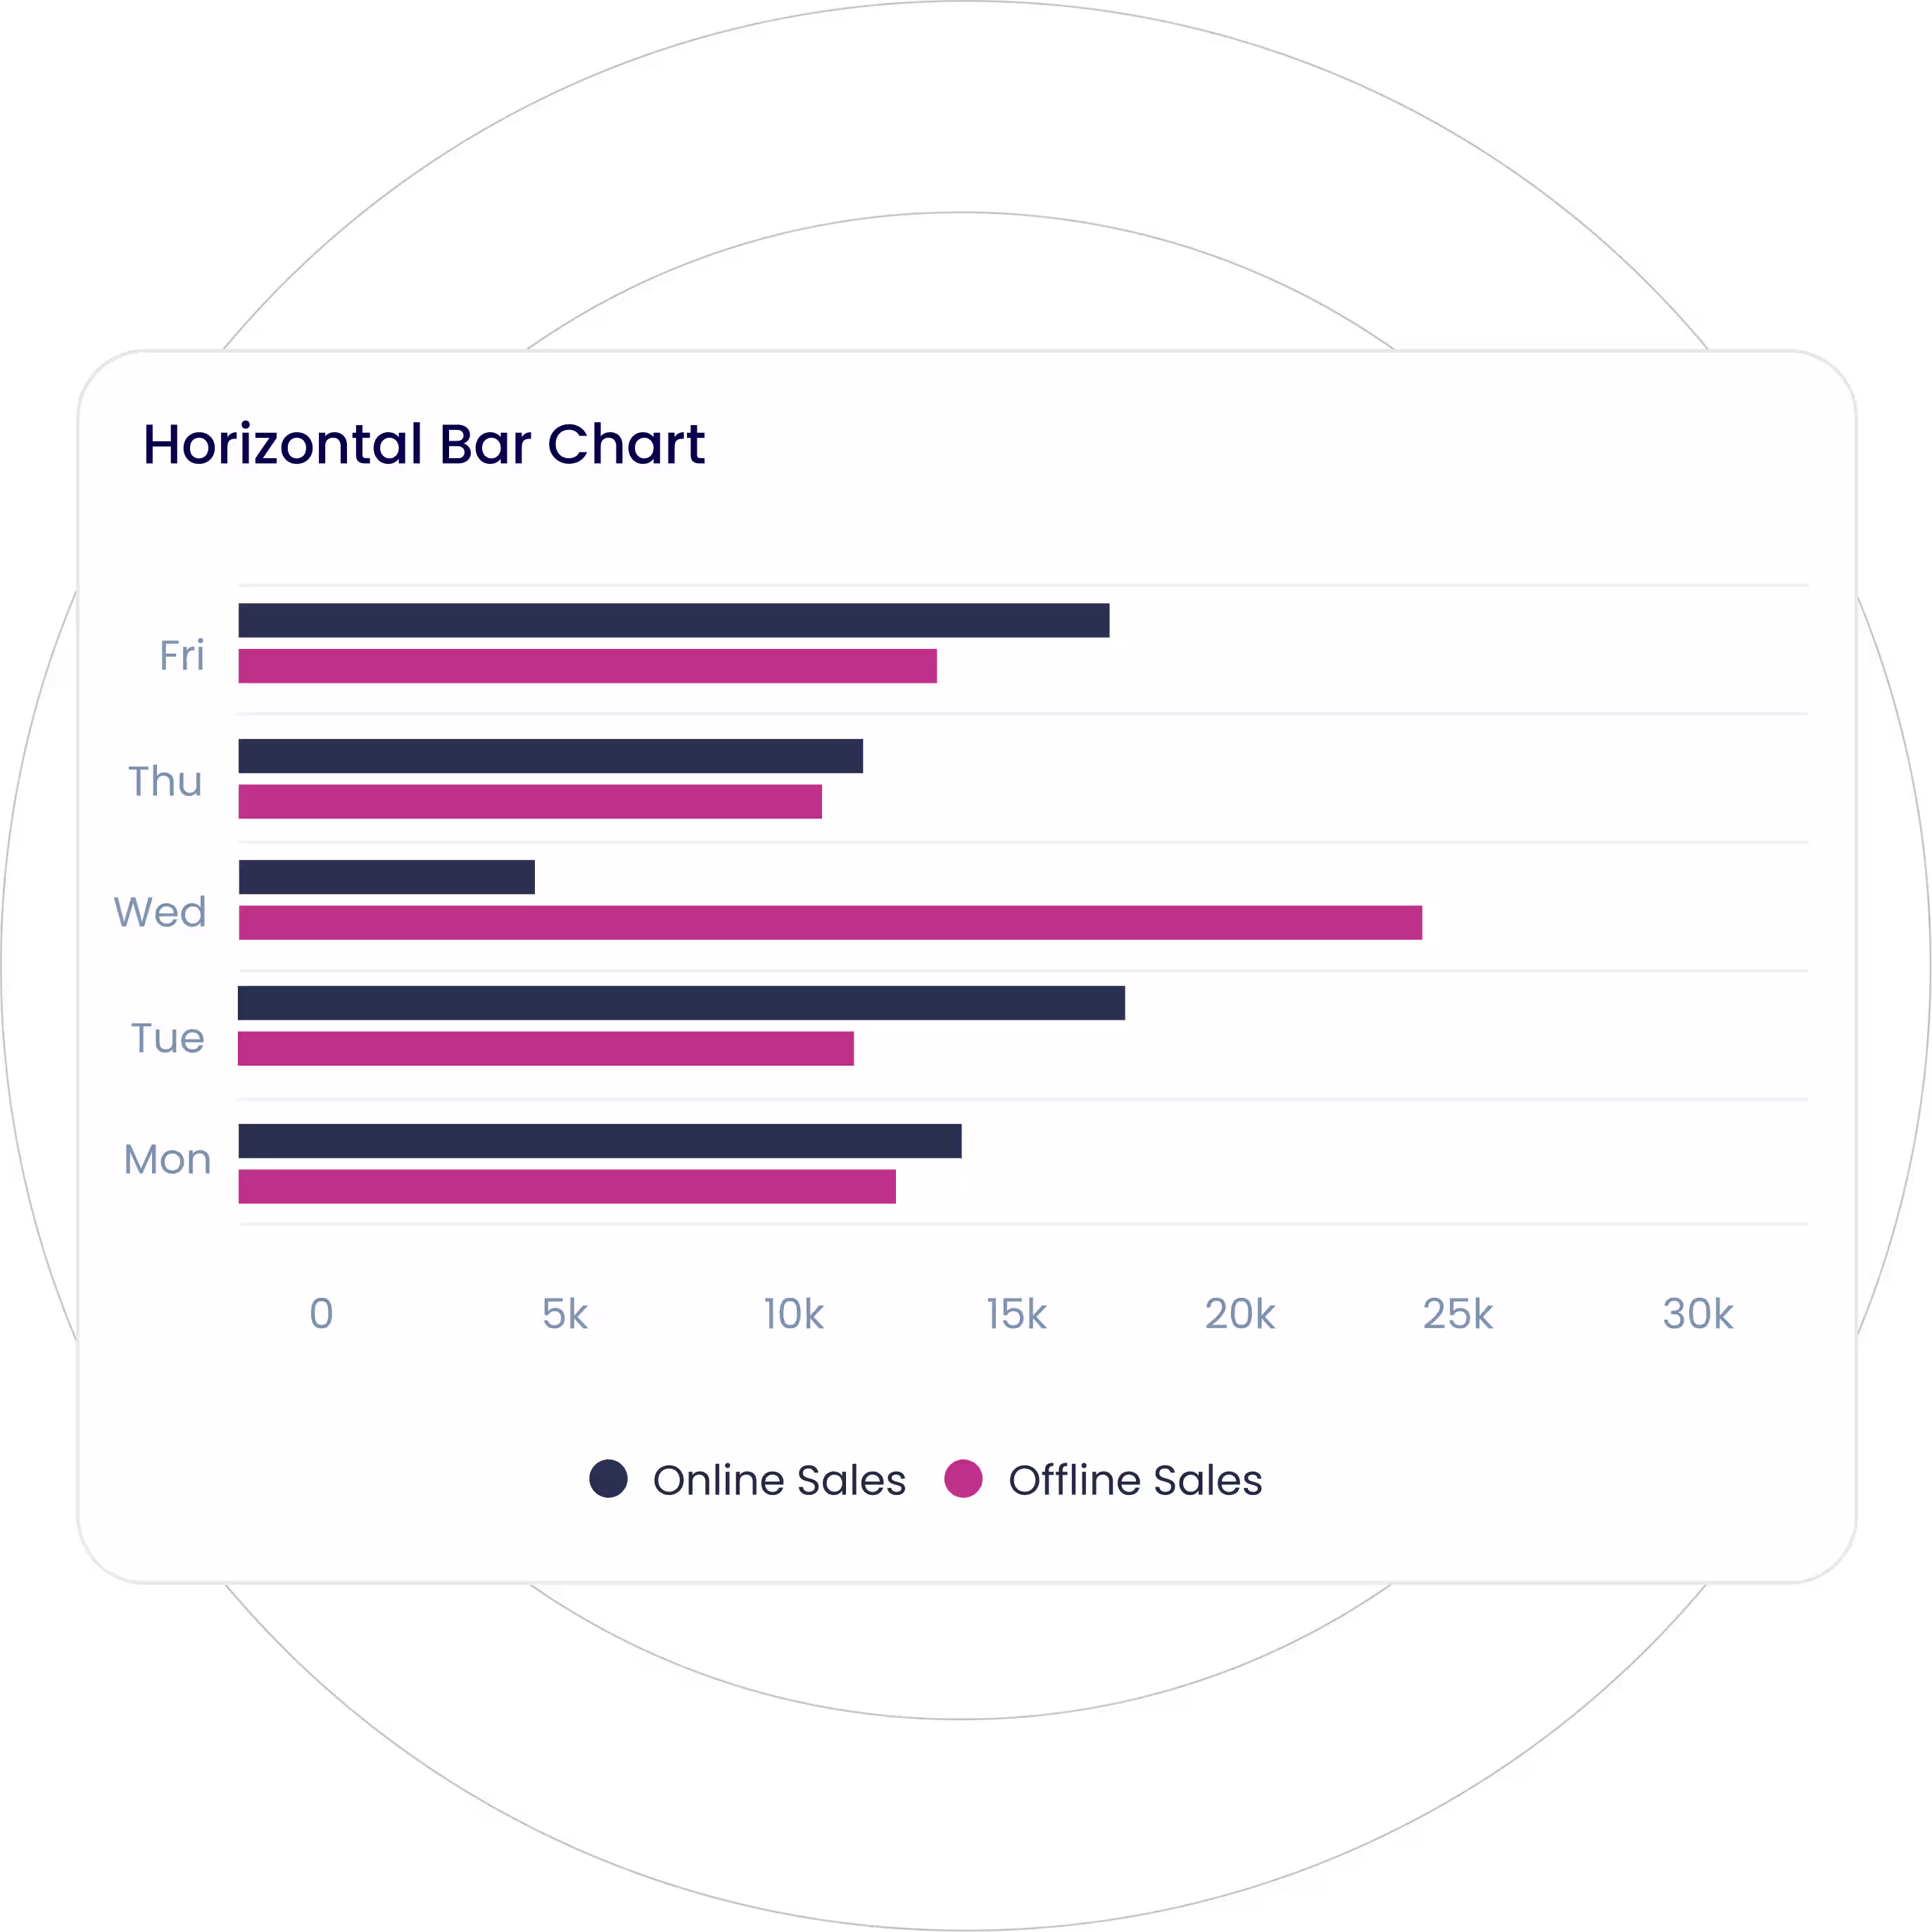
Represent categorical data with rectangular horizontal bars, representing the difference between data categories.
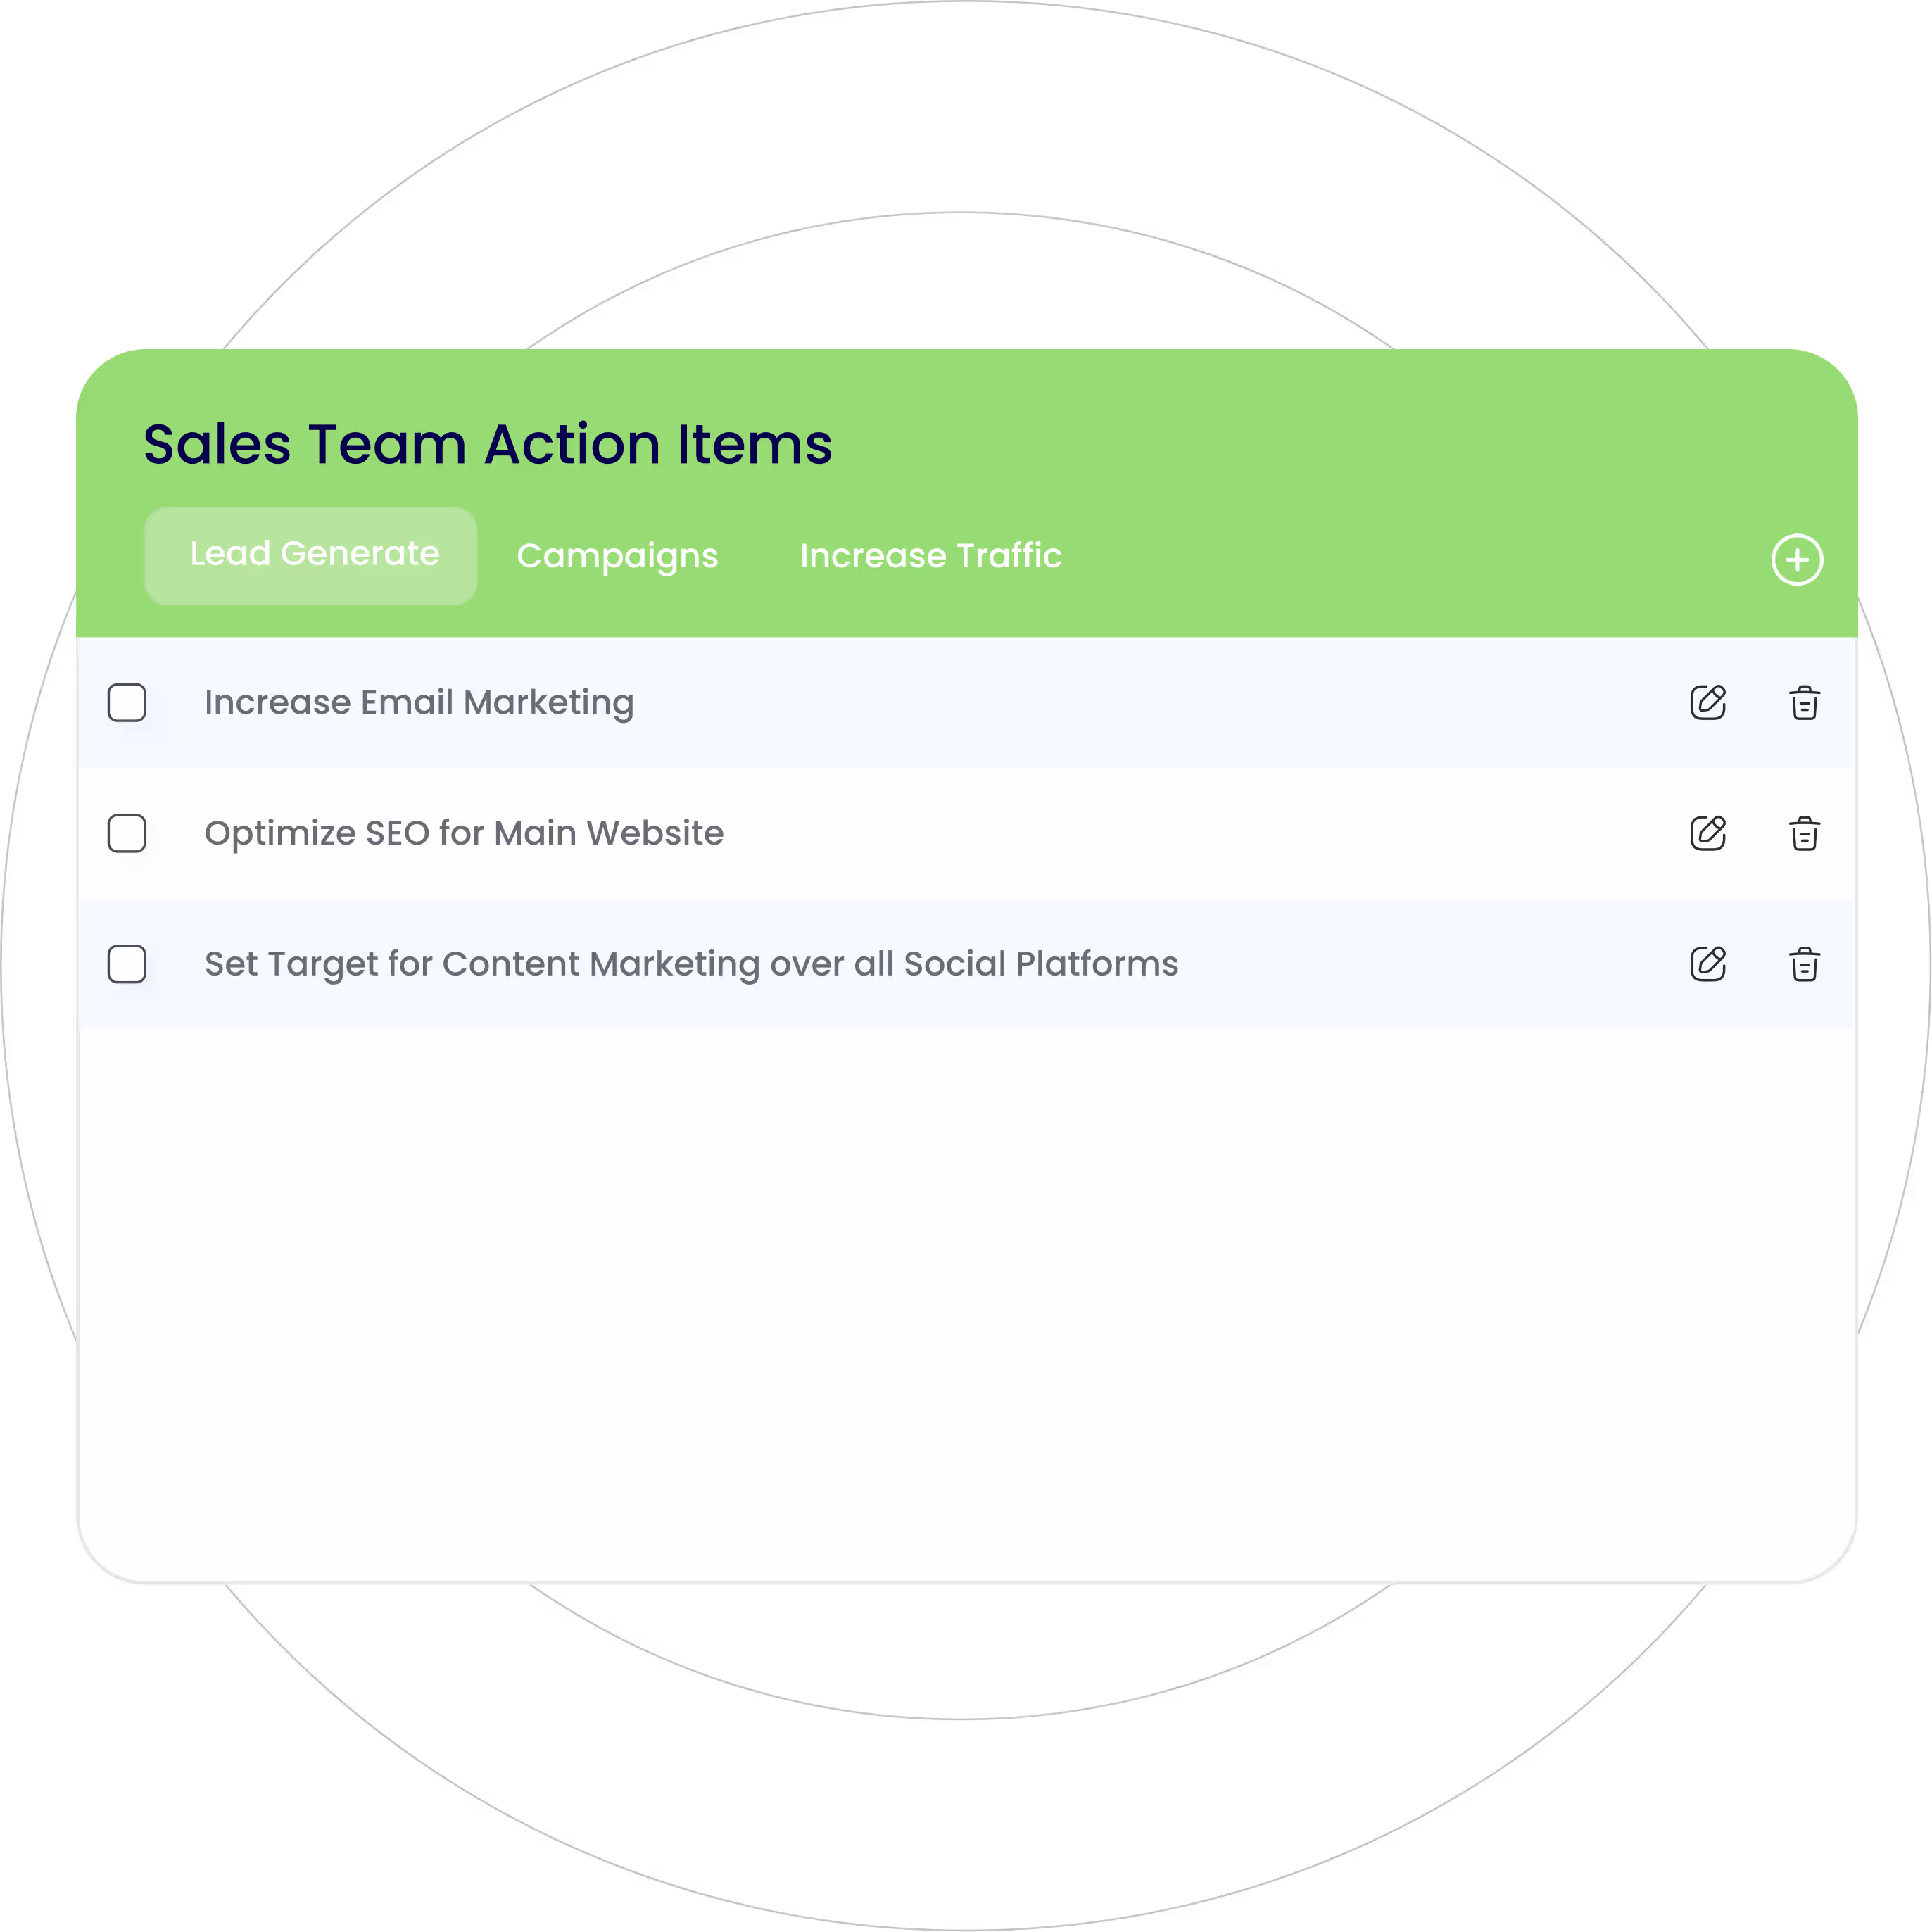
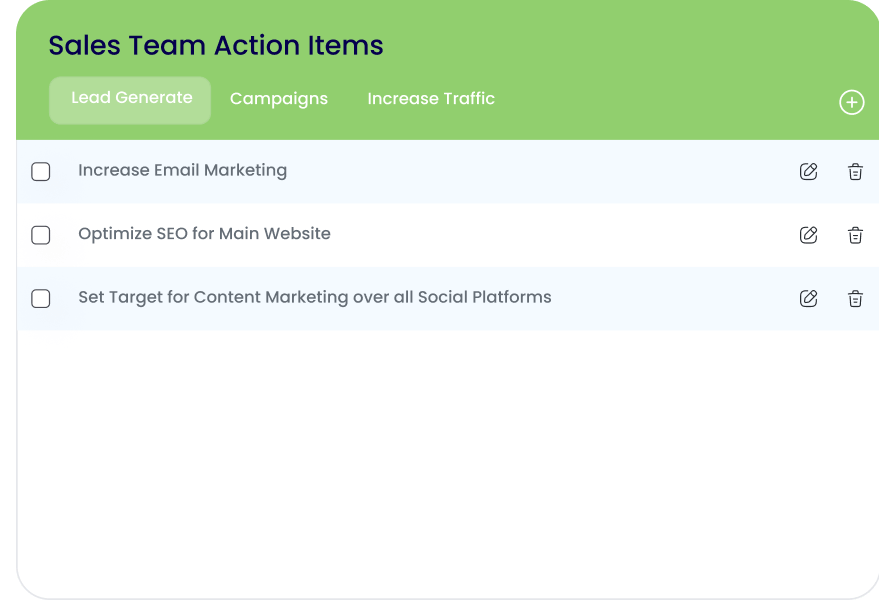
Organize all tasks or actions that need to be completed in the form of a checklist, ensuring easy tracking of progress.
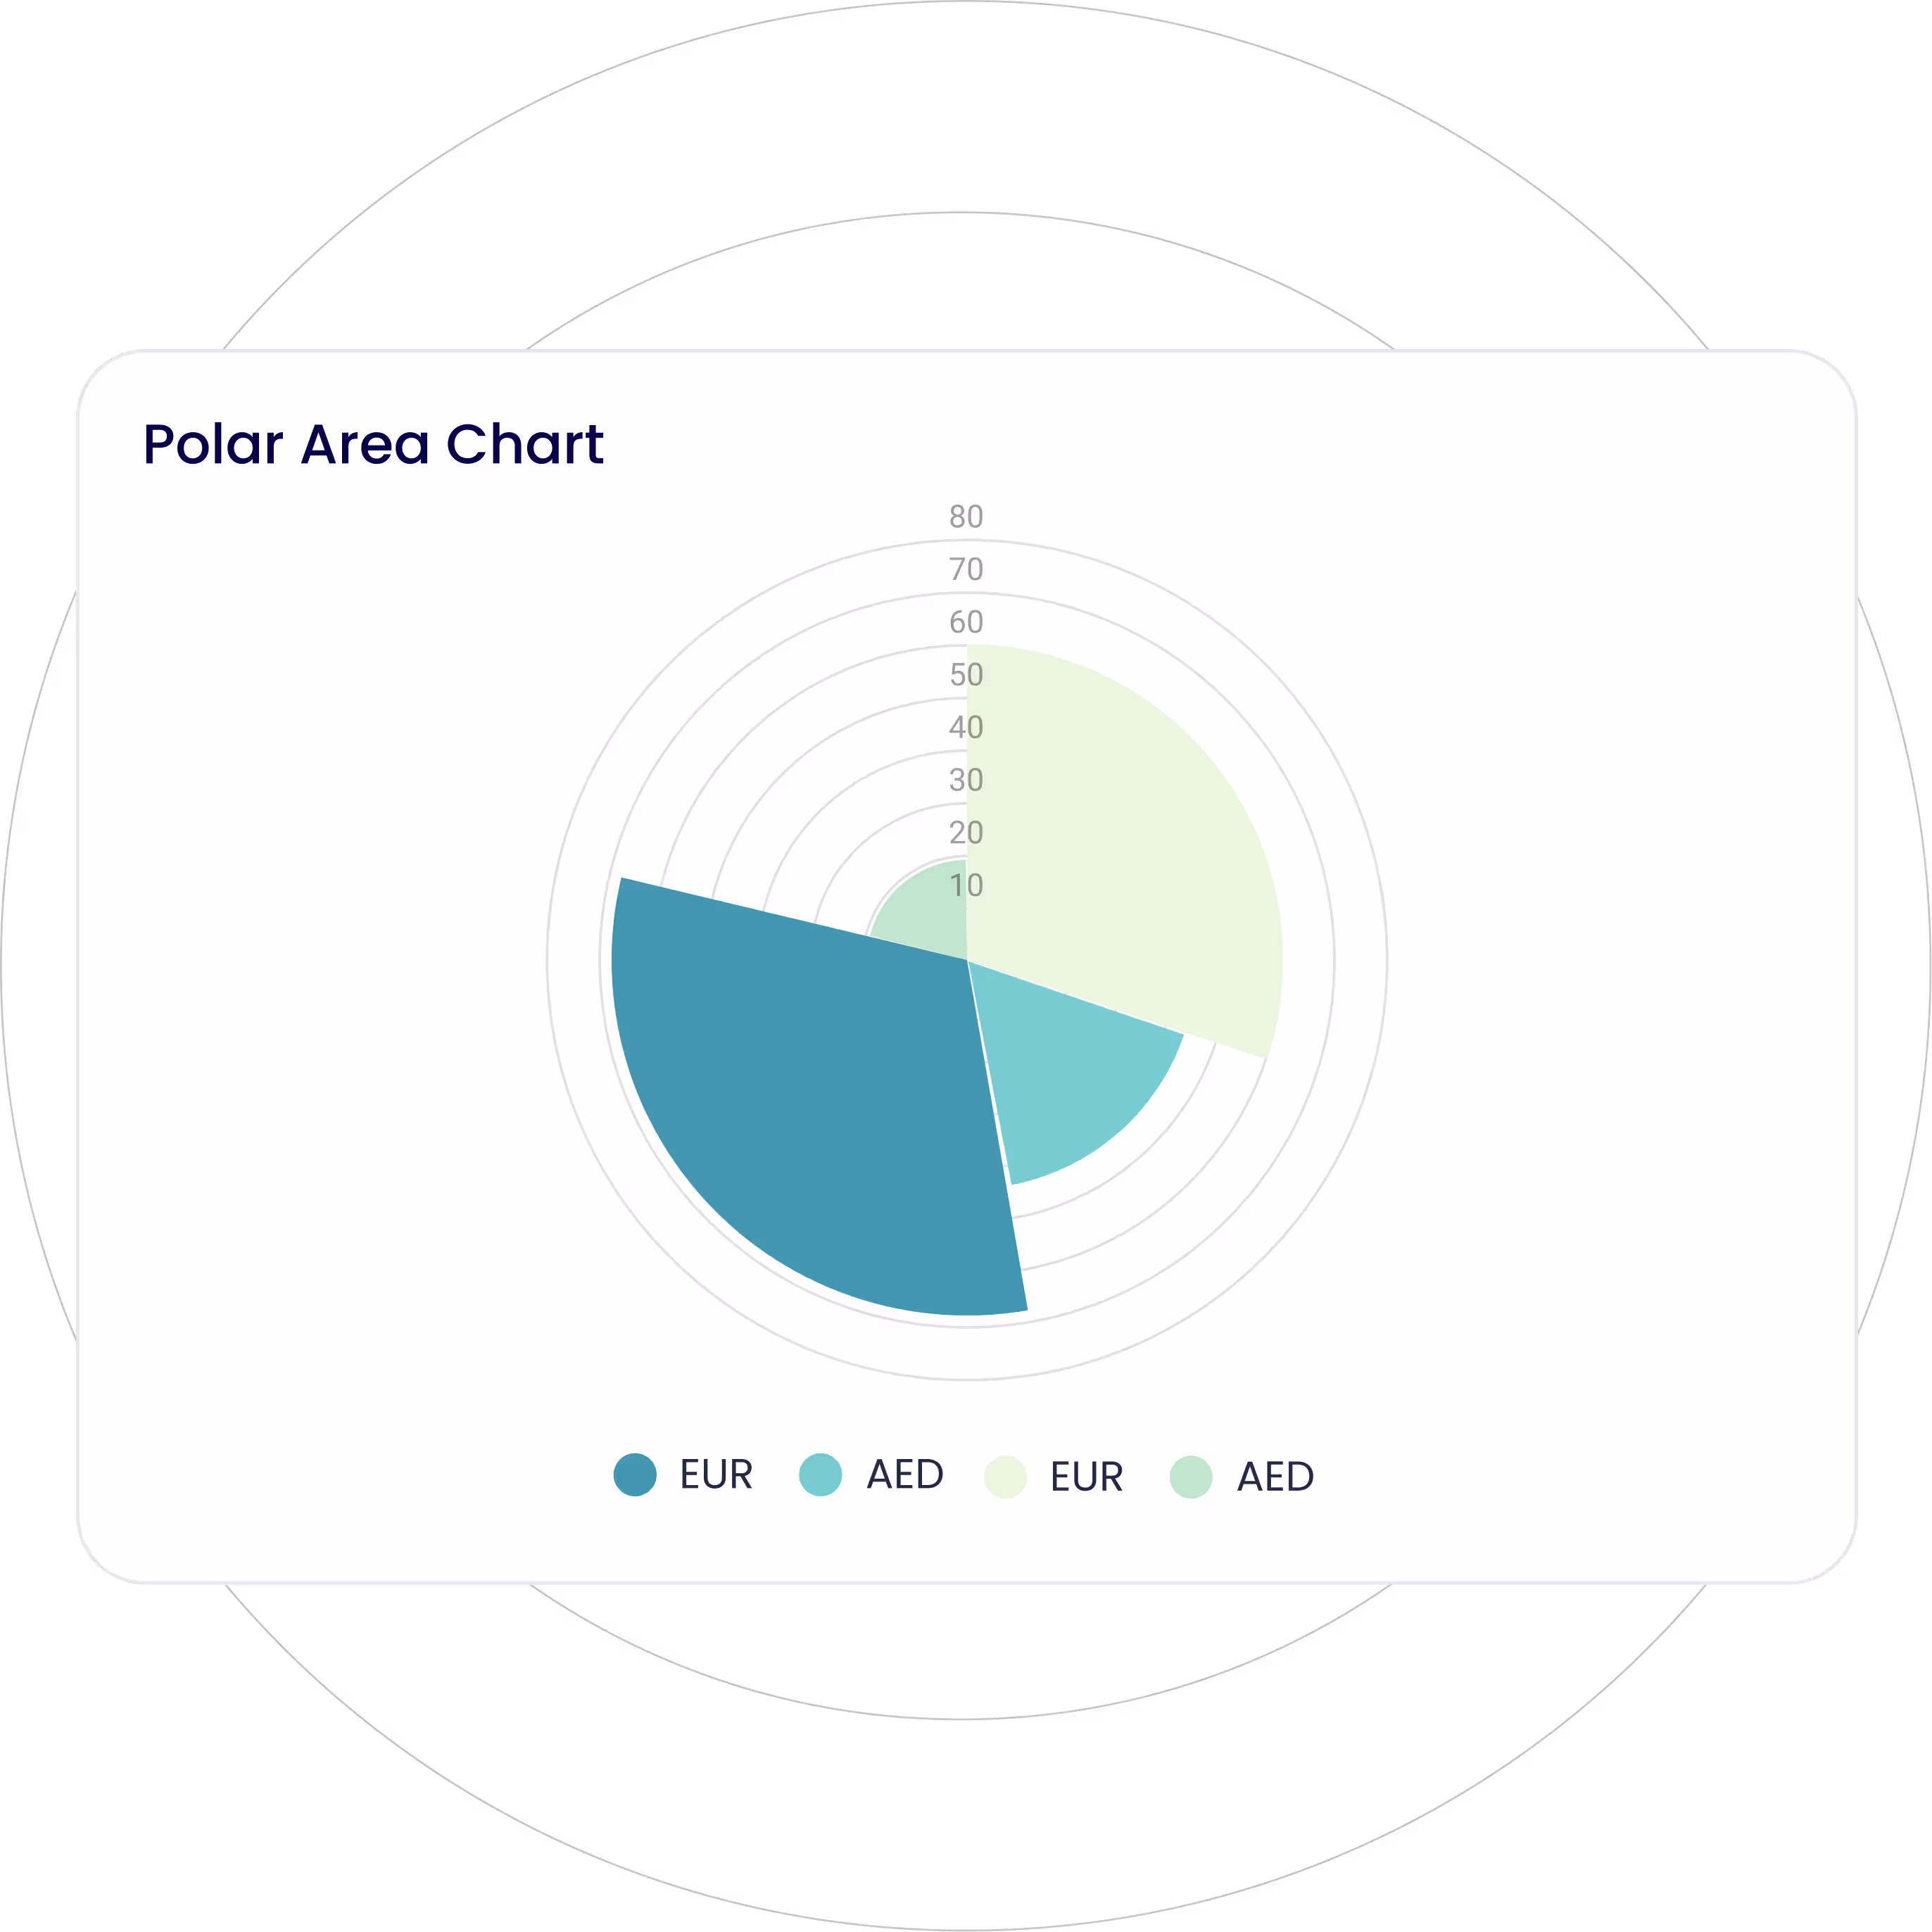
Represent cyclical data using radial lines separating segments, with each segment’s area representing its value.
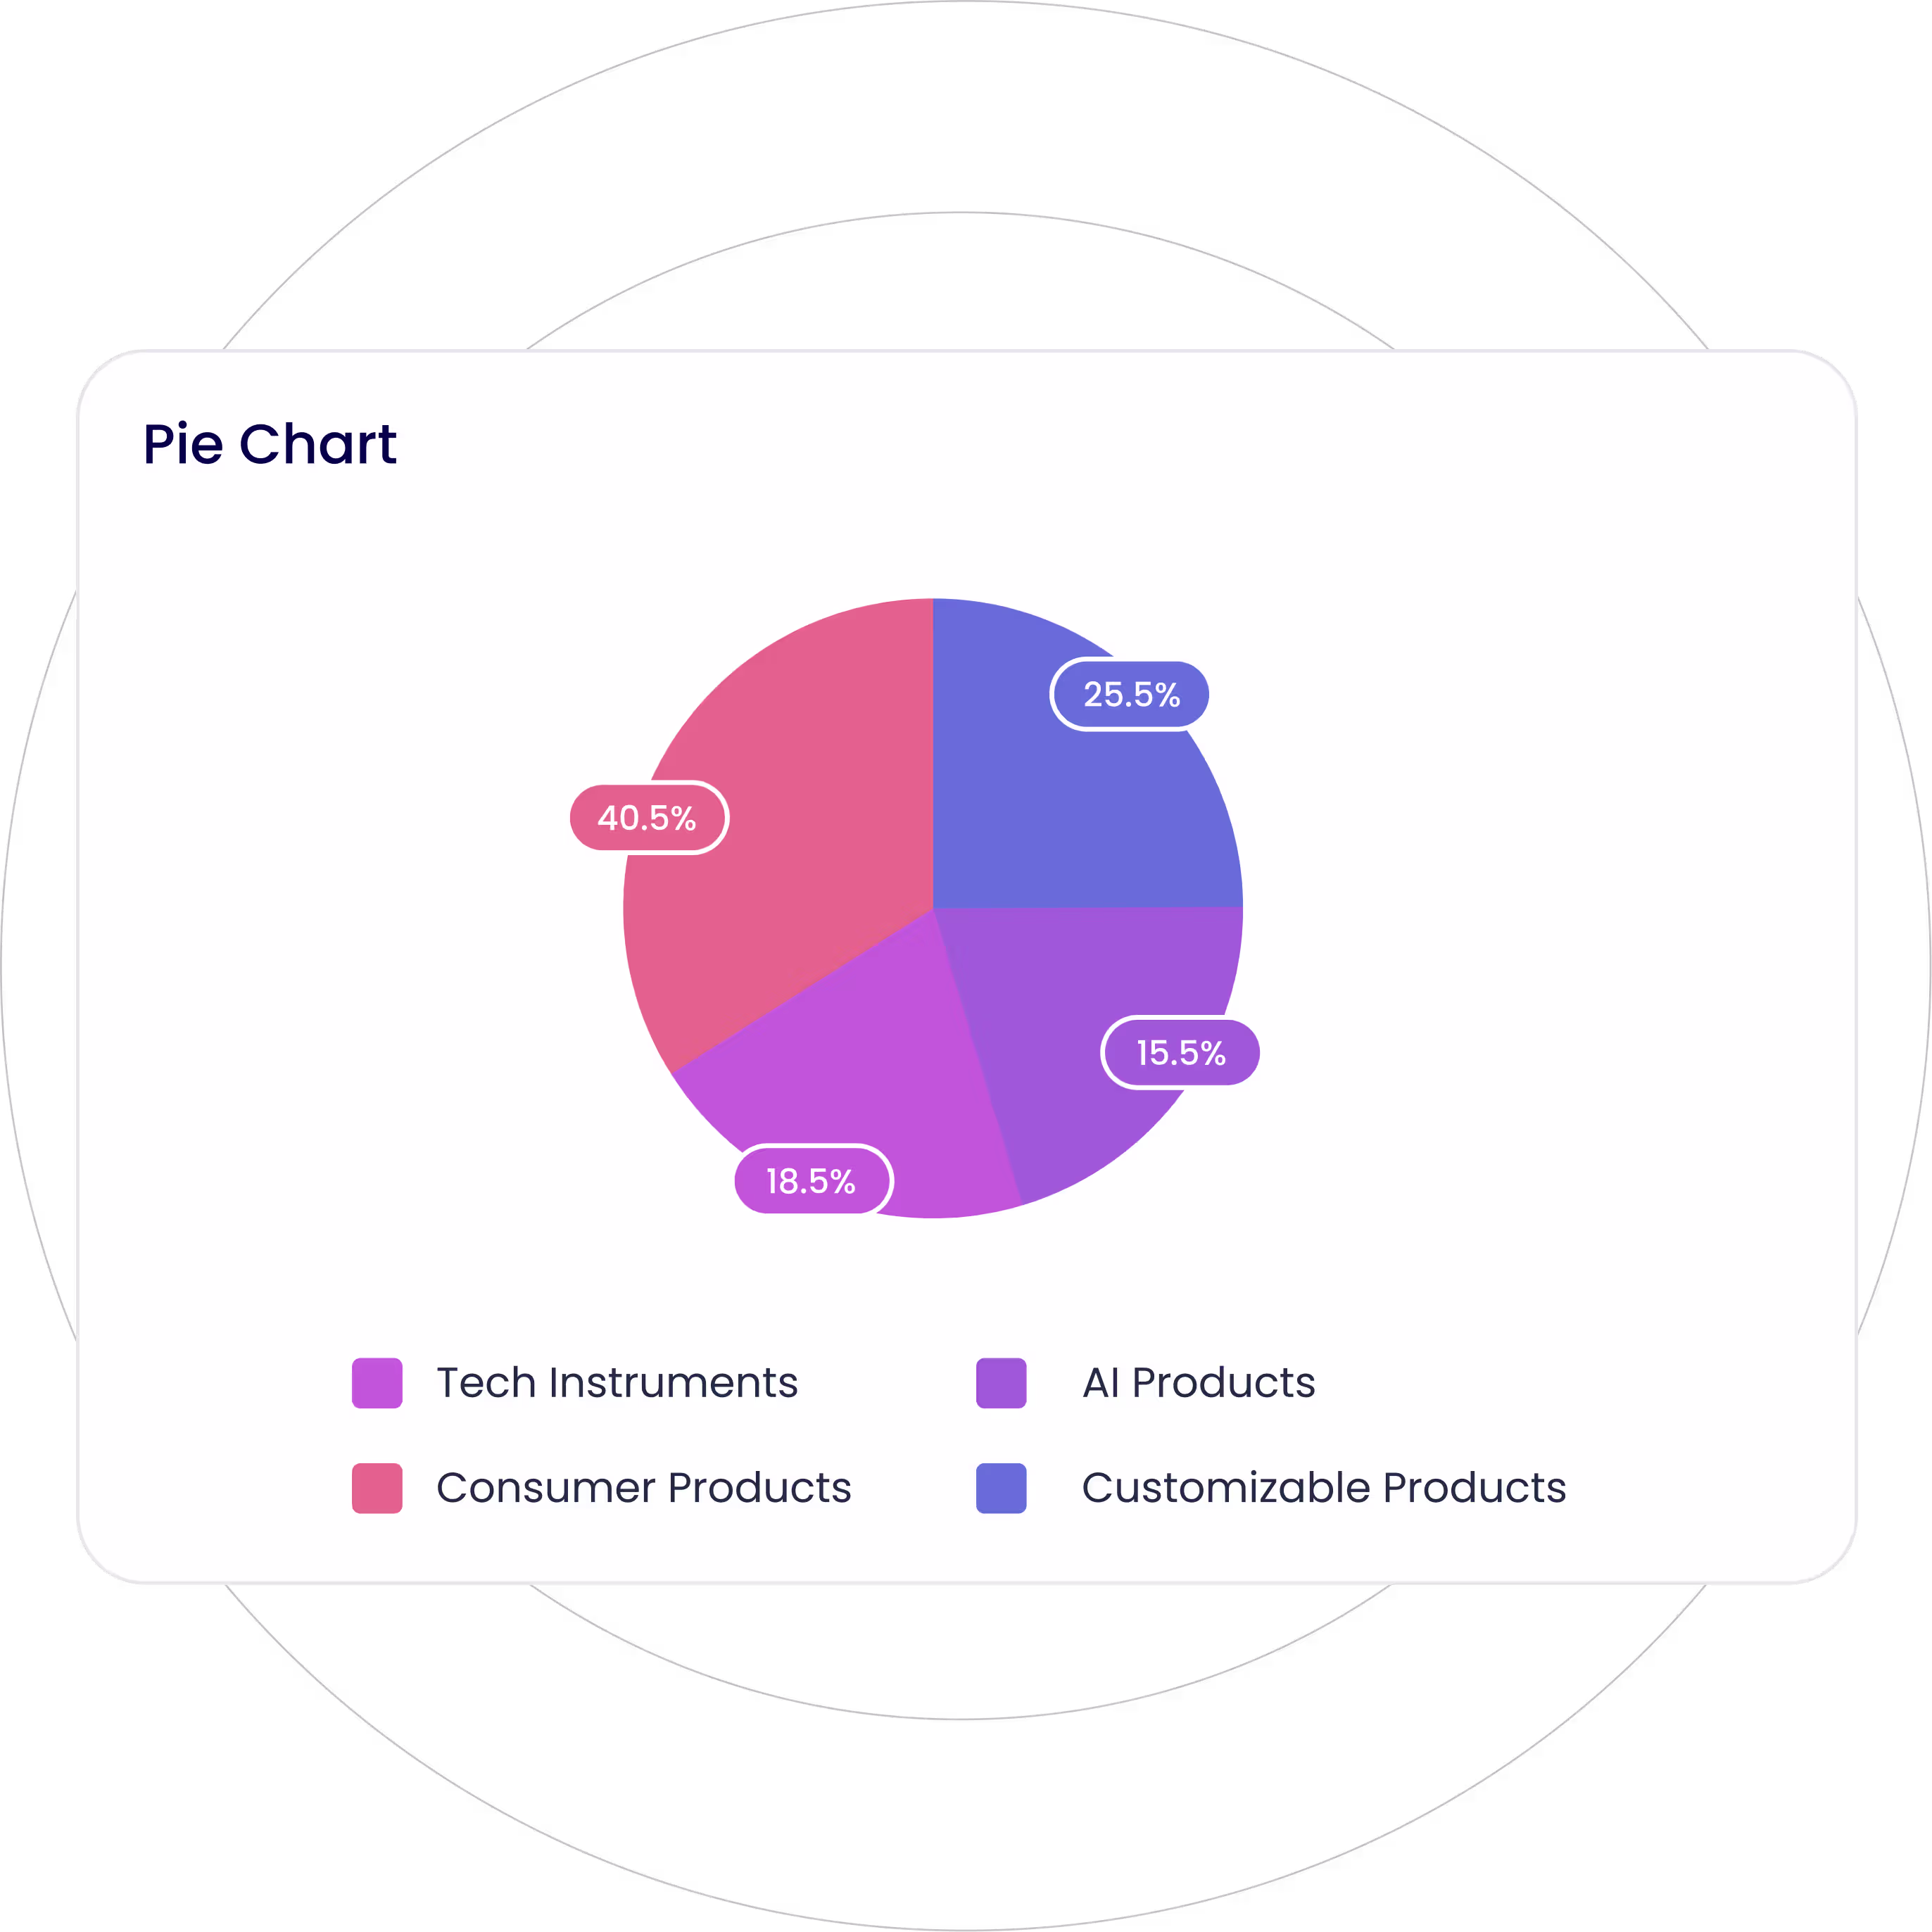
Display your data in a circular graph, with each slice of a circle representing a fraction or proportionate part of the whole.
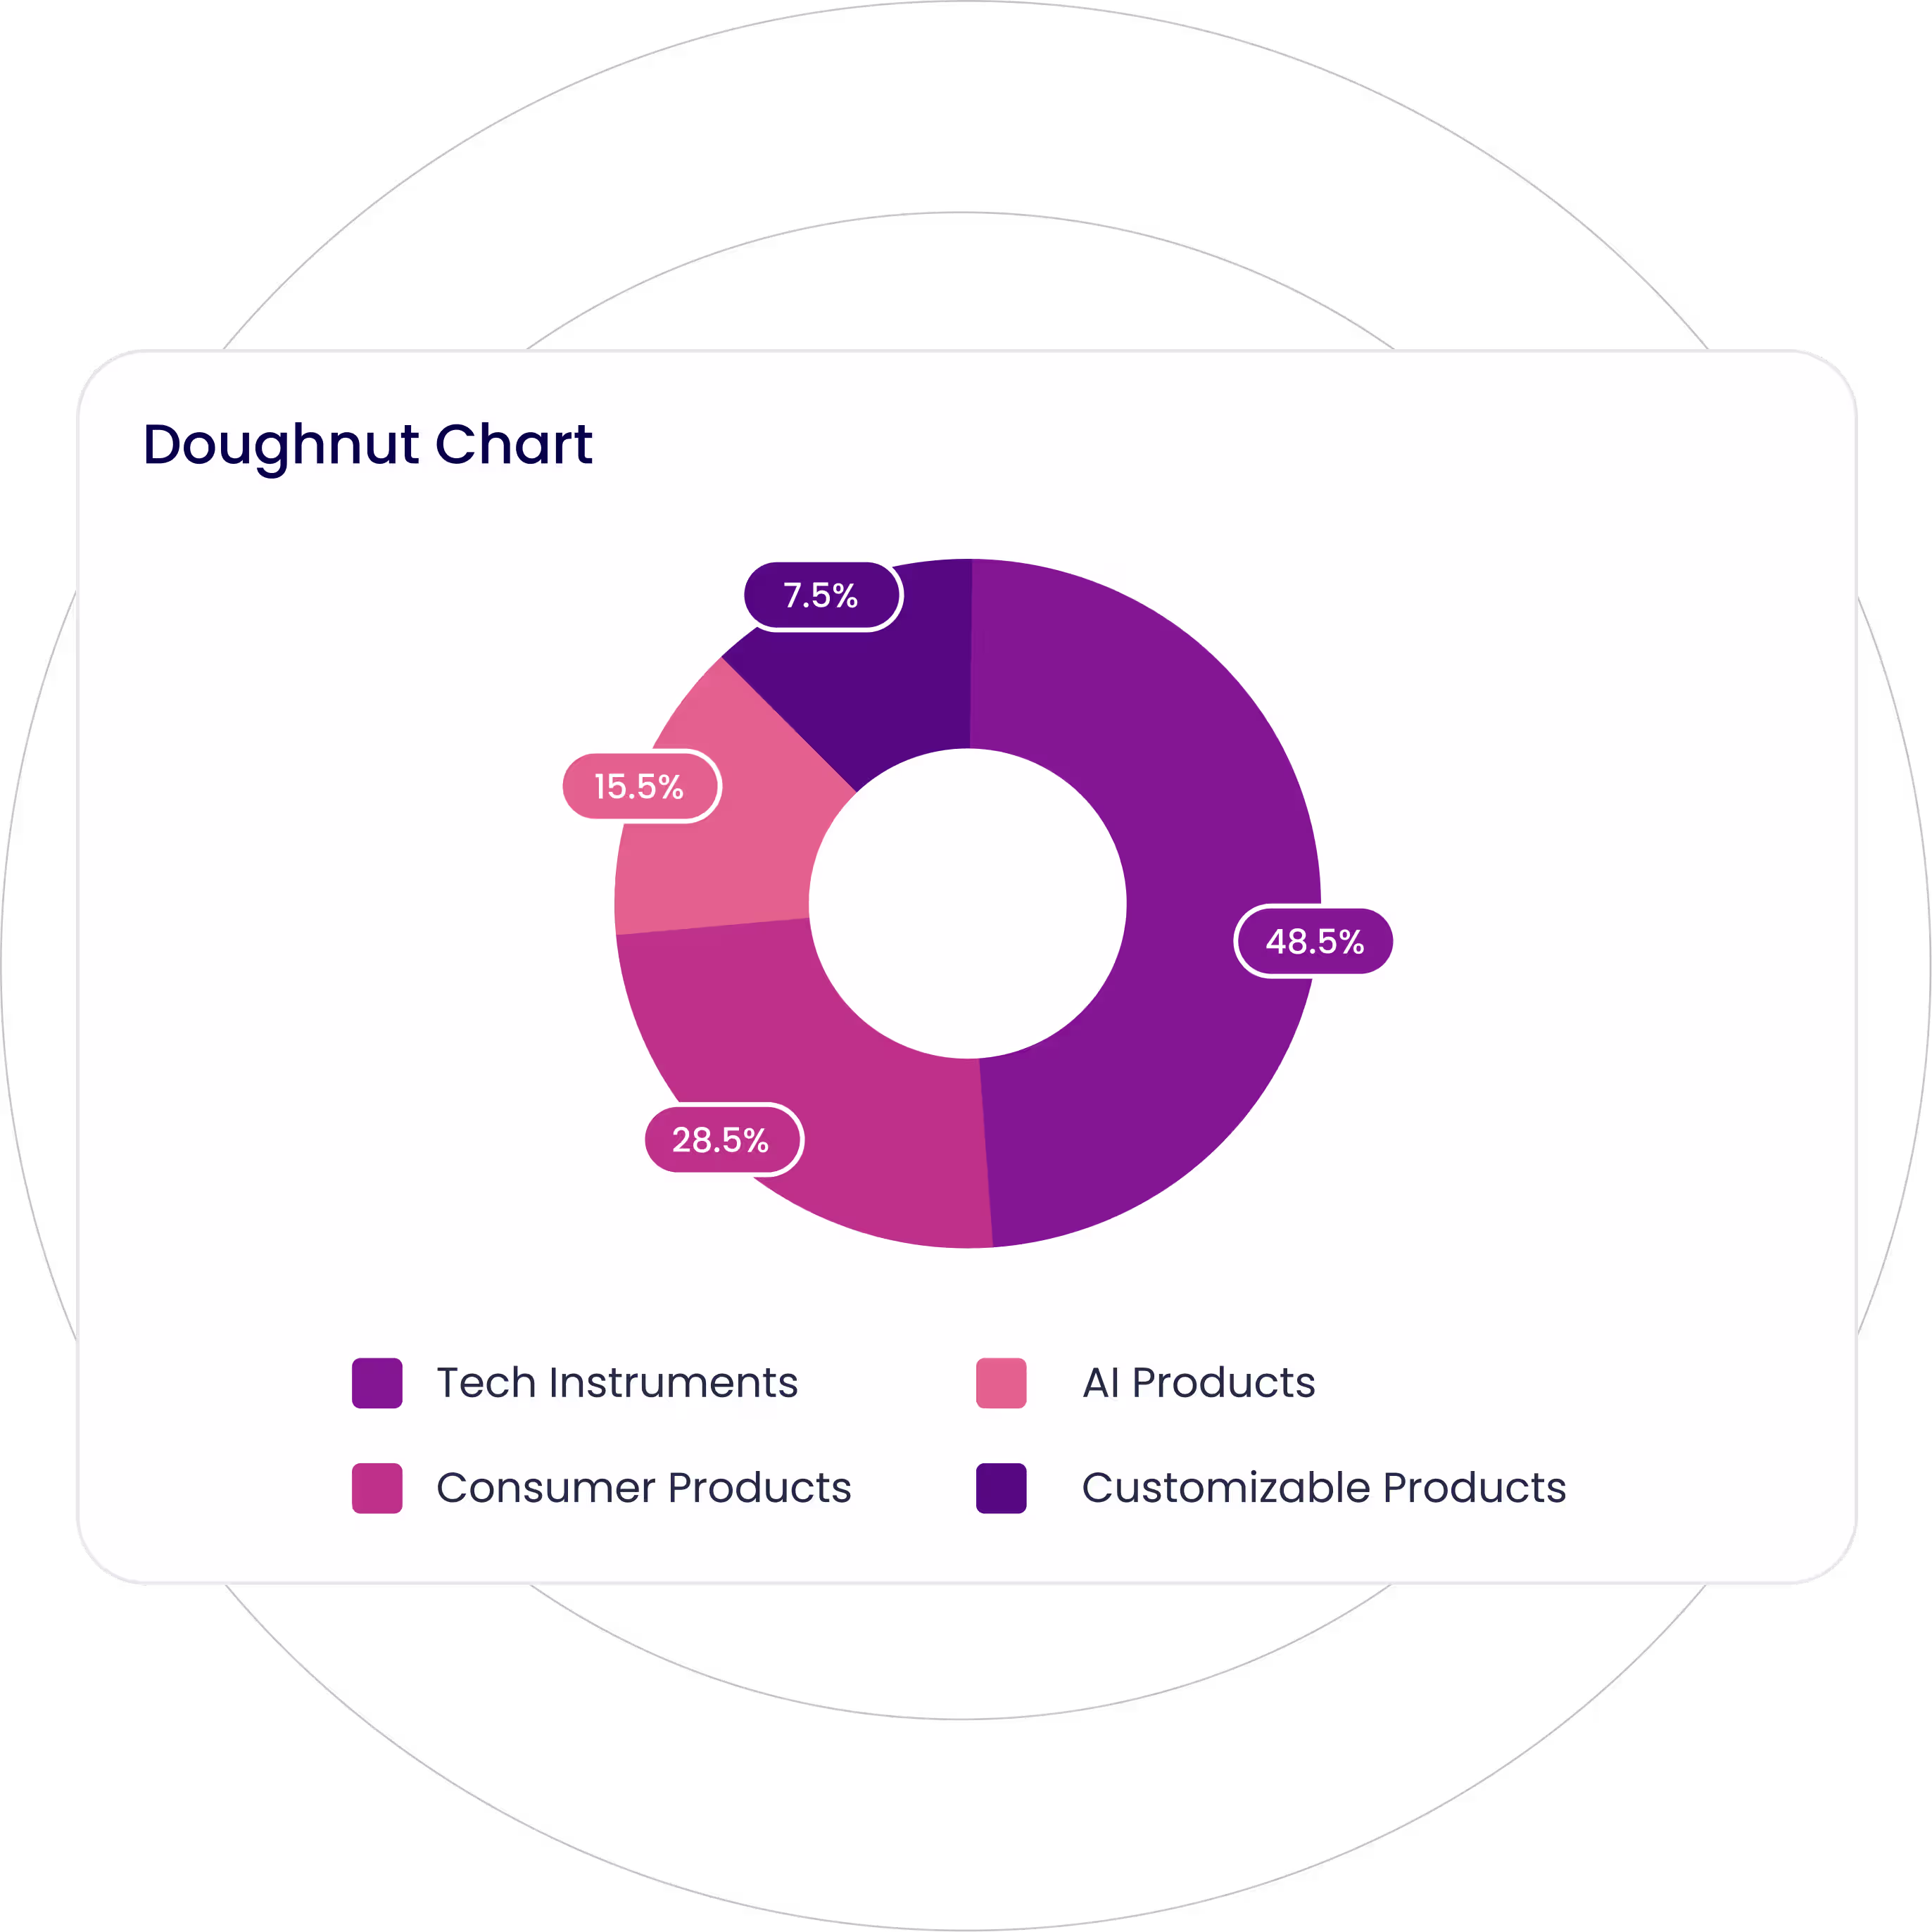
Similar to a pie chart with a central hole, providing a clean and modern look.
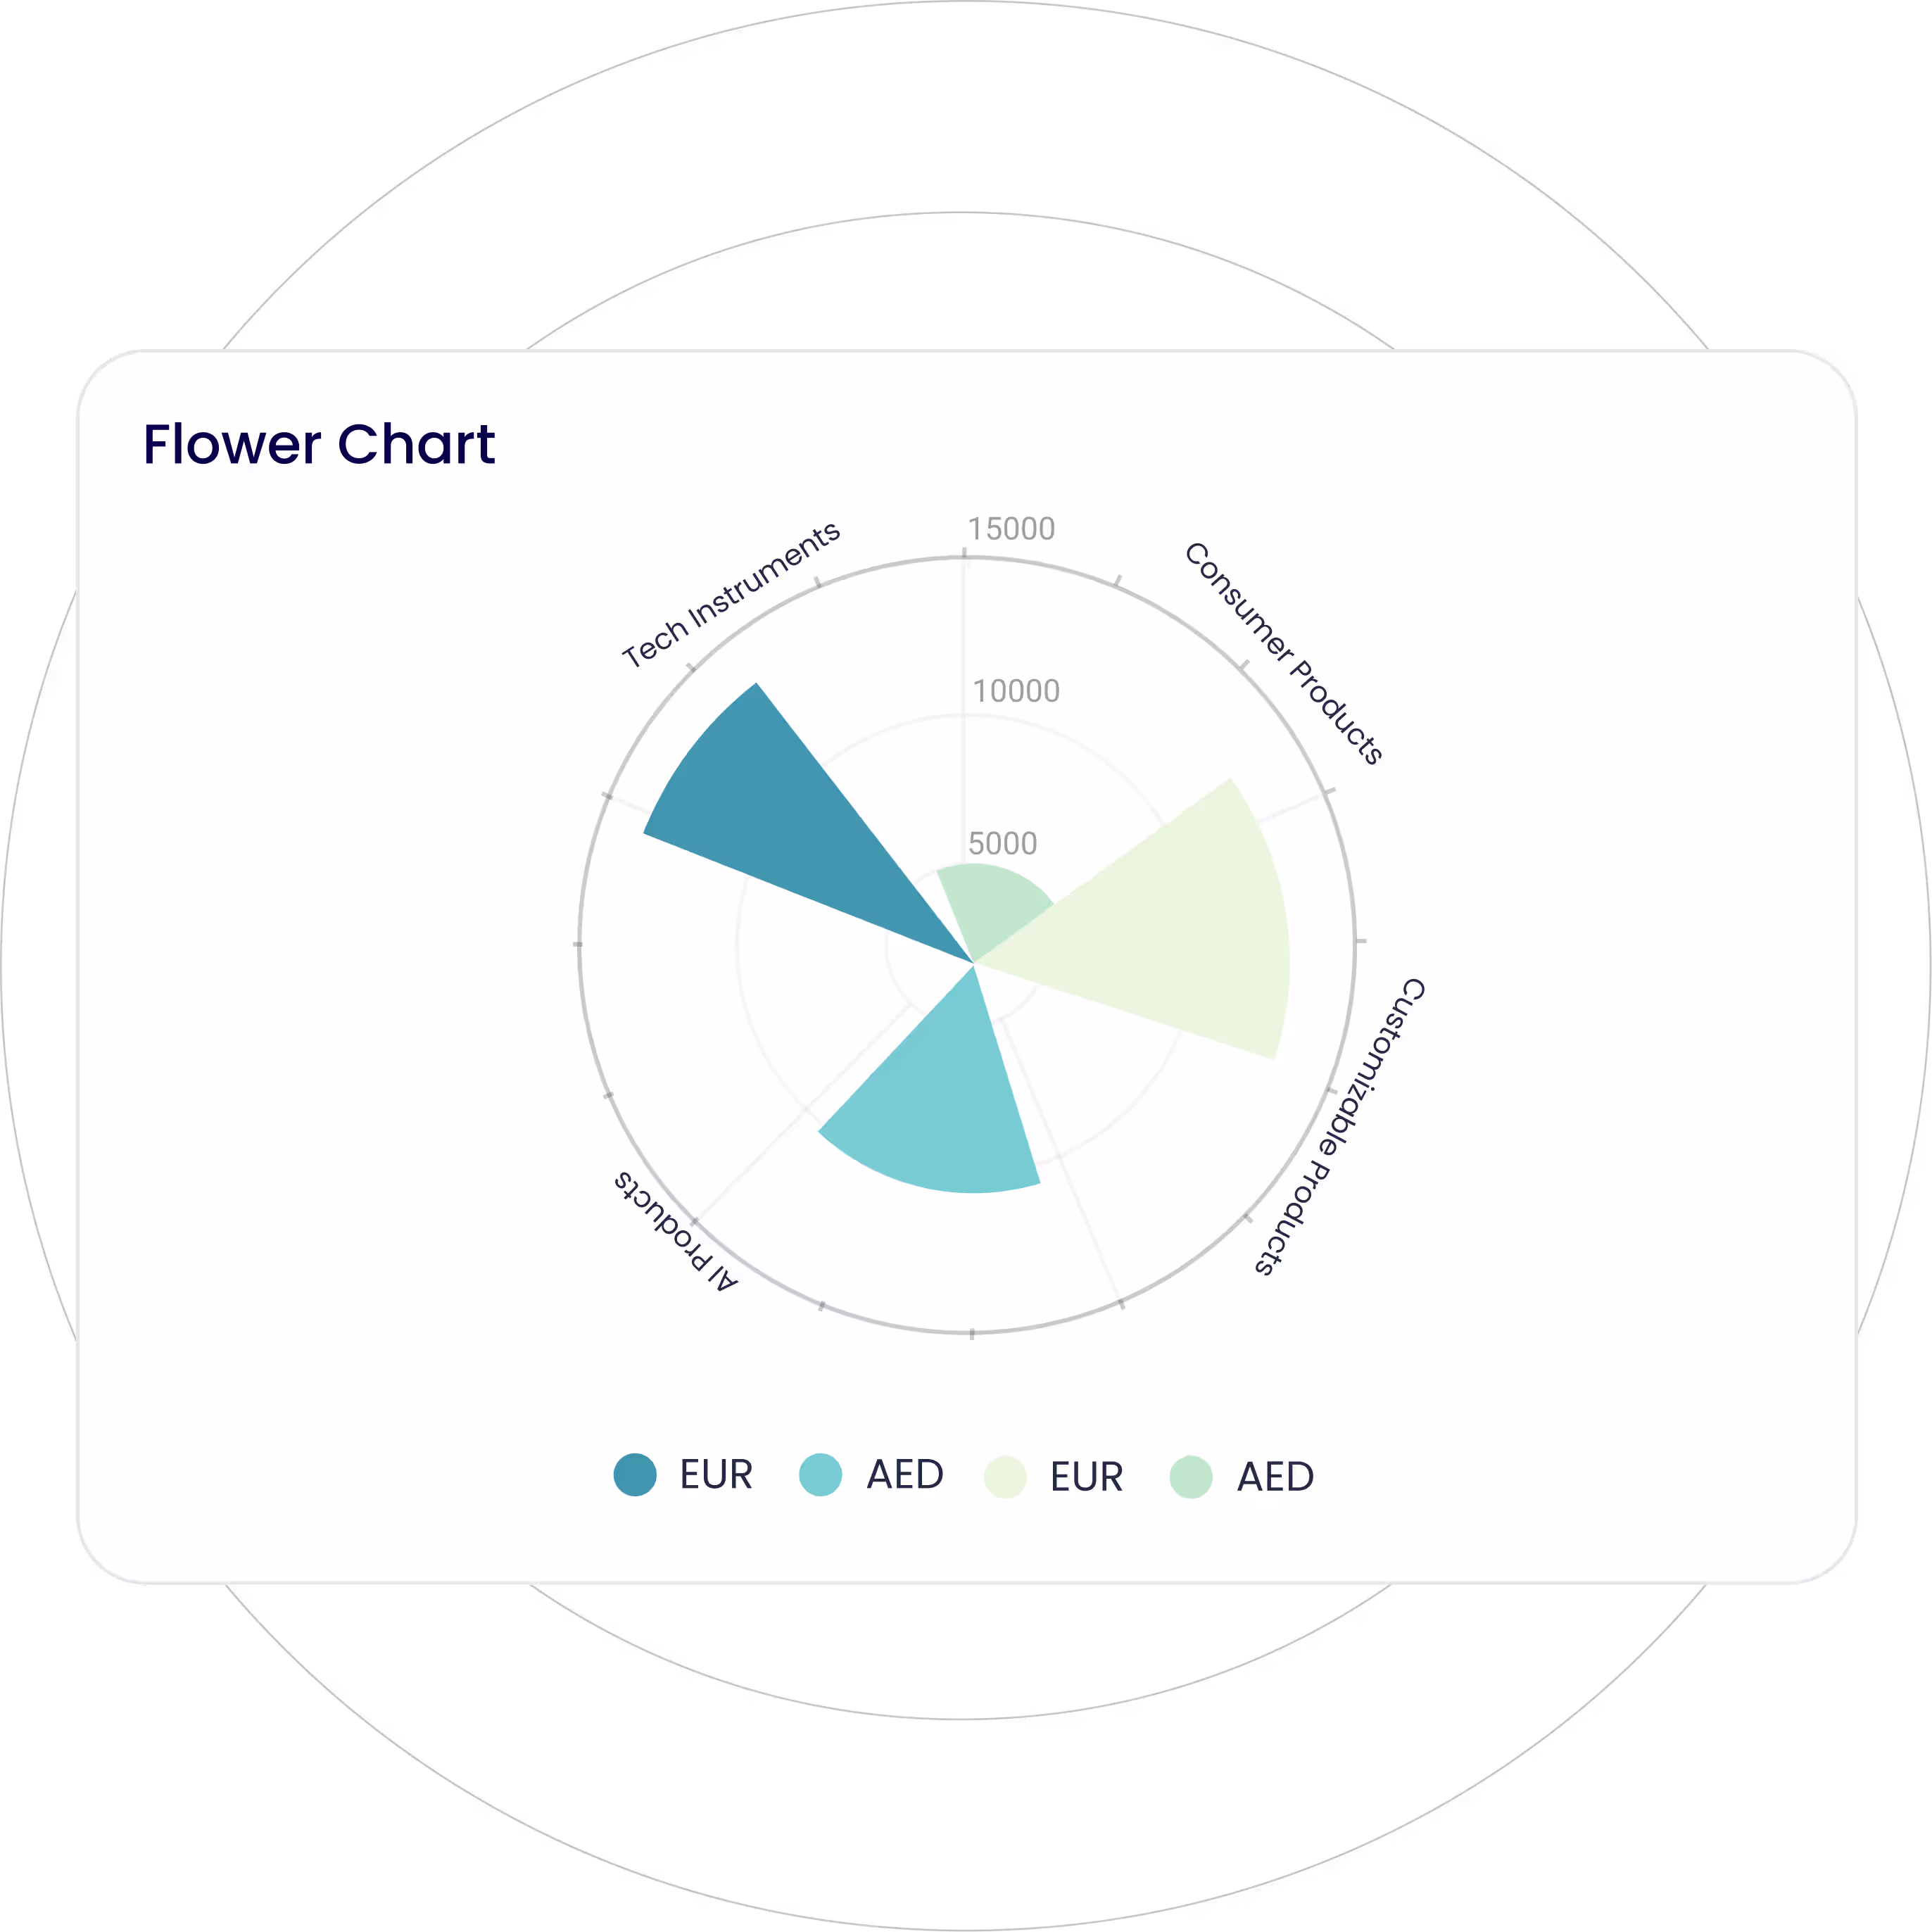
Visualize multivariate data wherein data points are displayed as petals radiating from a central point, with each petal’s size or color representing its value.
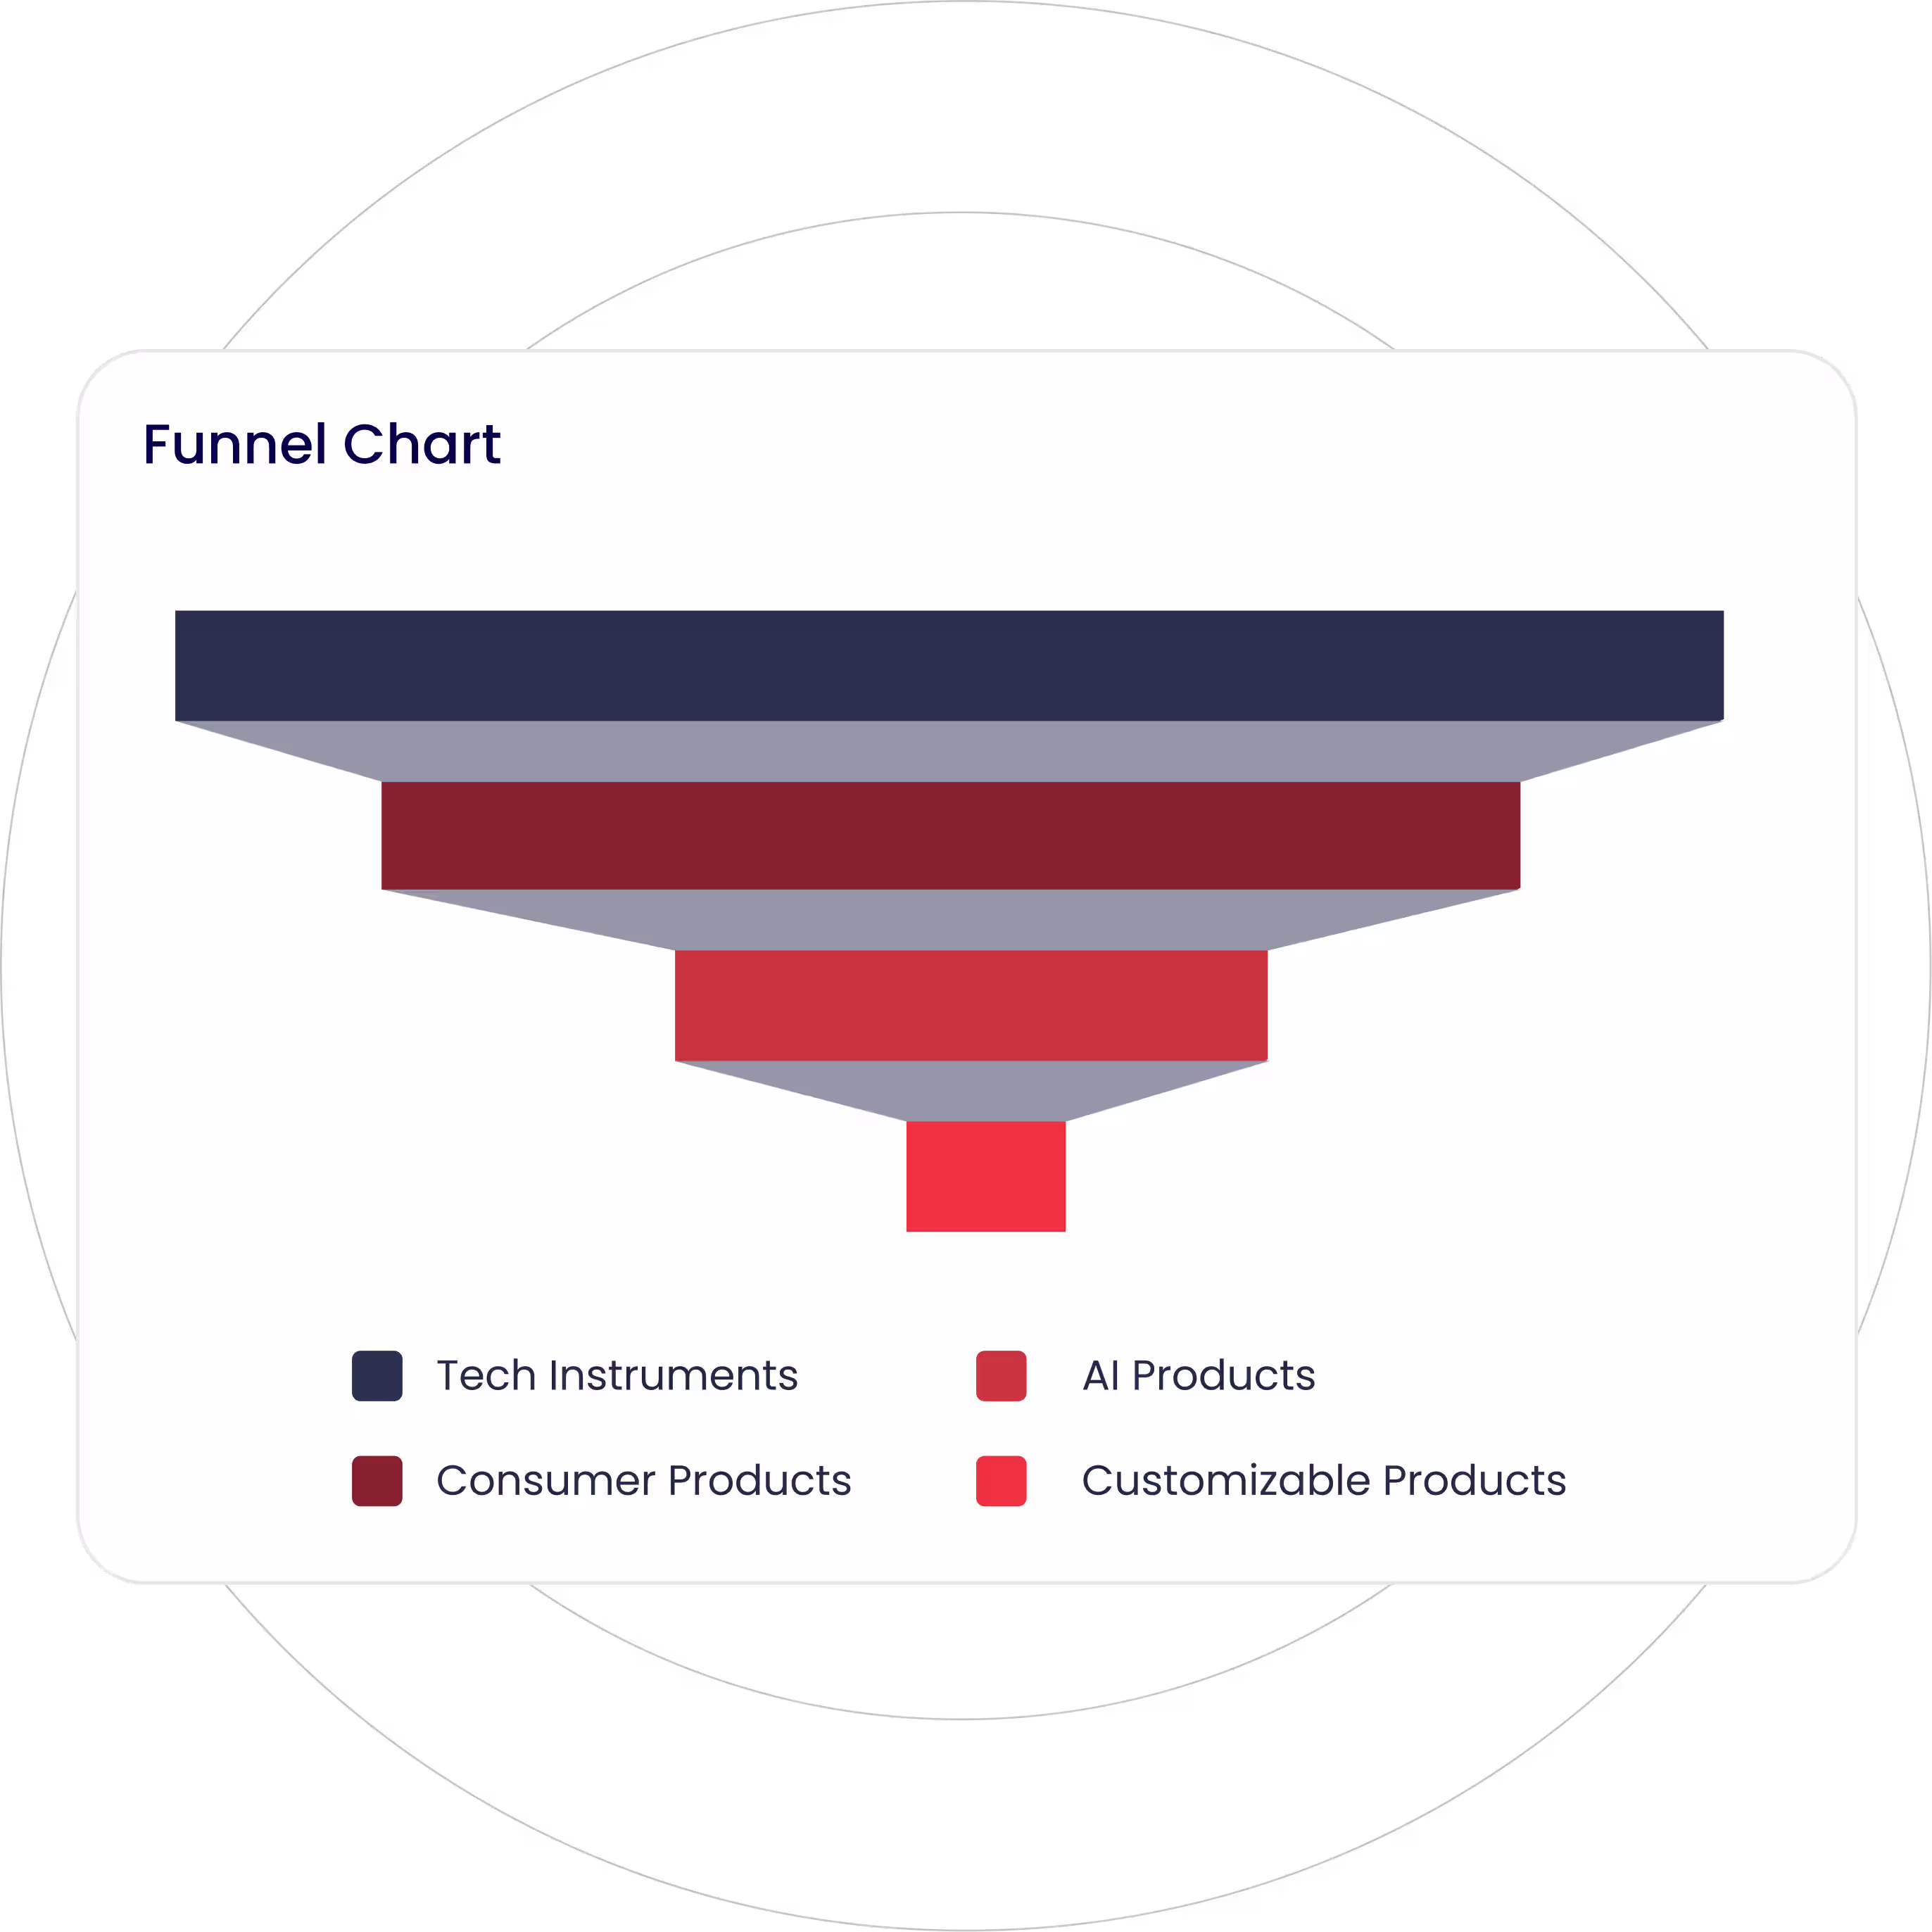
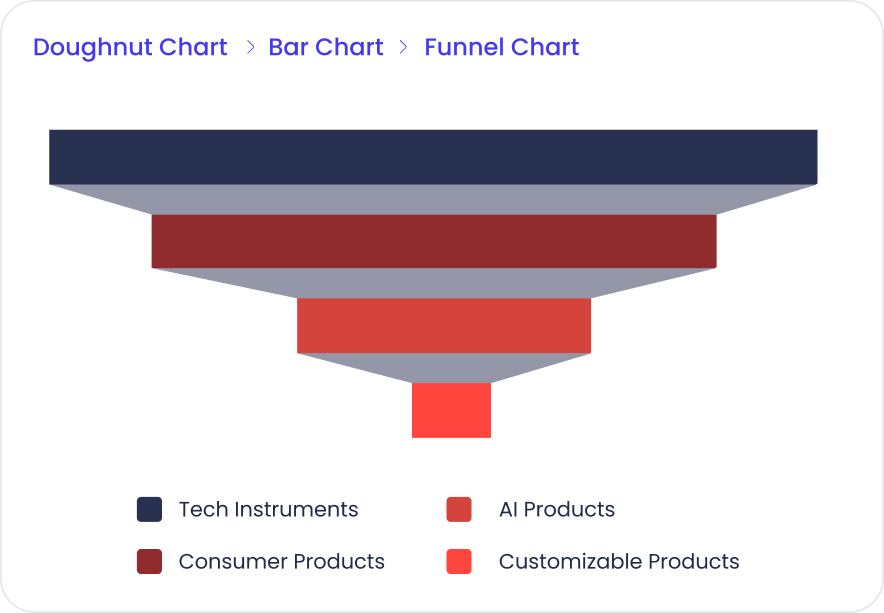
Visualize data as it moves through different stages of a process with decreasing segments. Ideal to visualize conversion rates or sales pipelines.
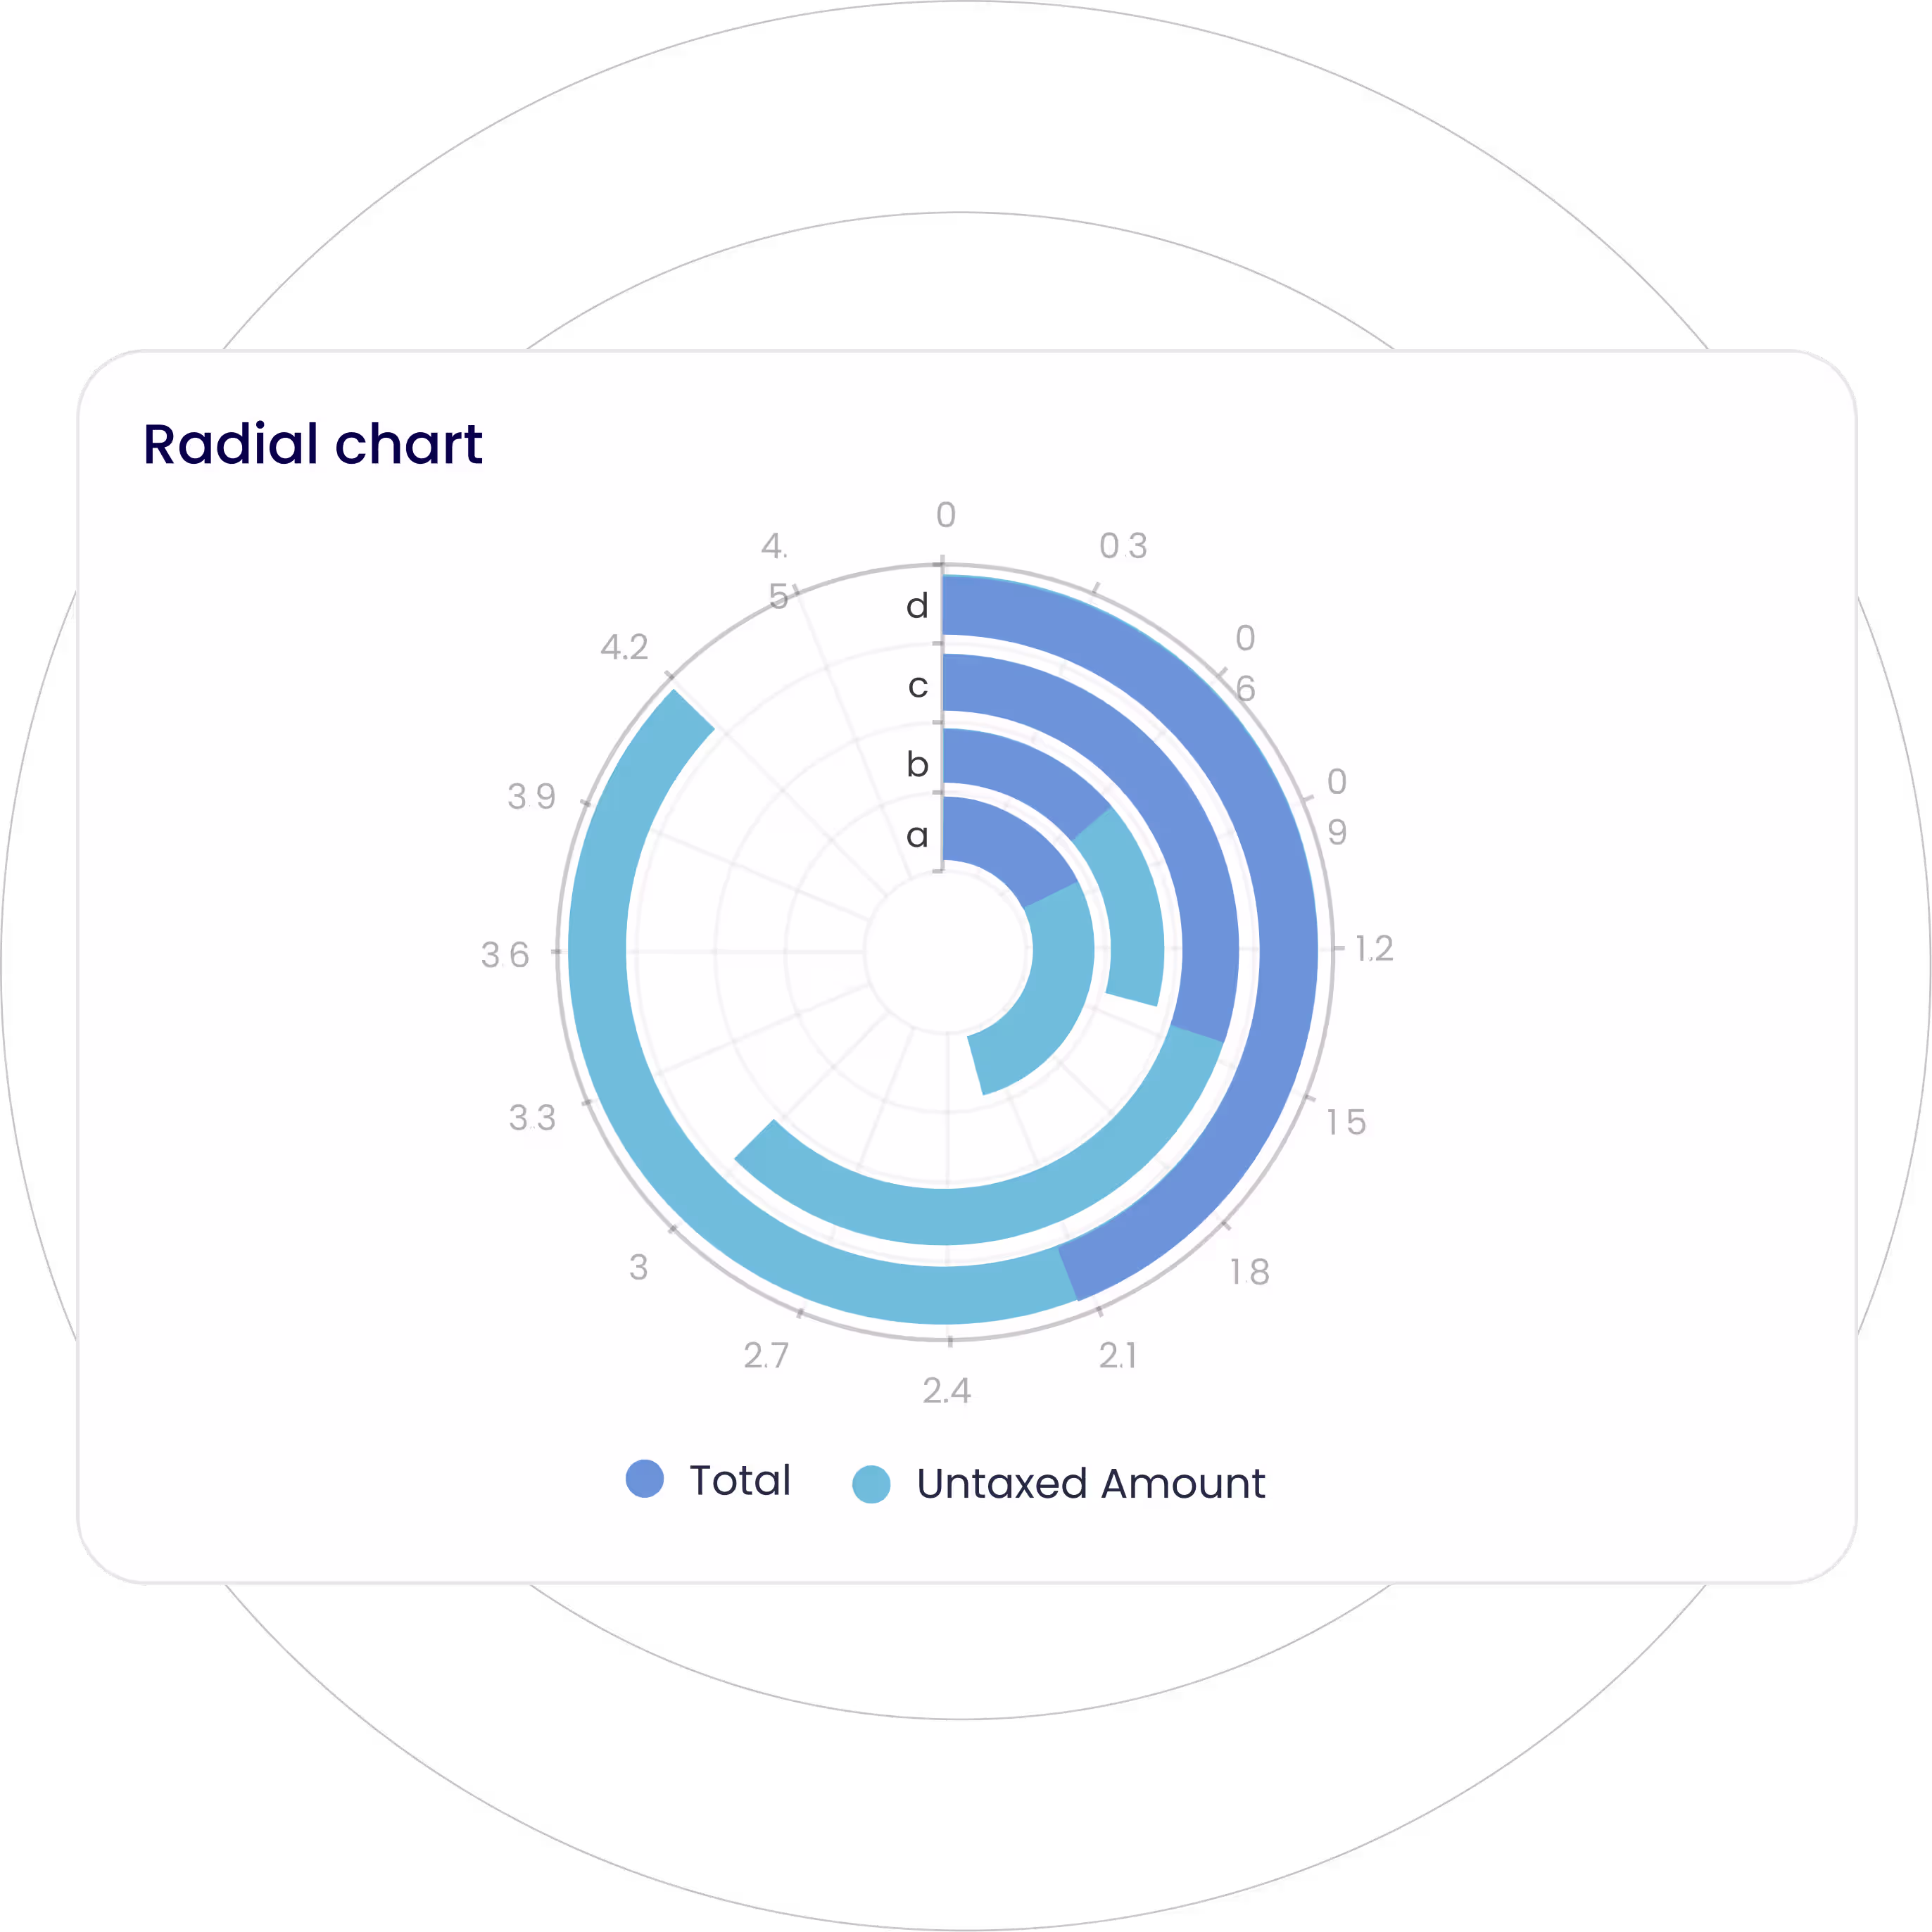
Represent multivariate data along concentric circles, where each circle represents a different variable or category.
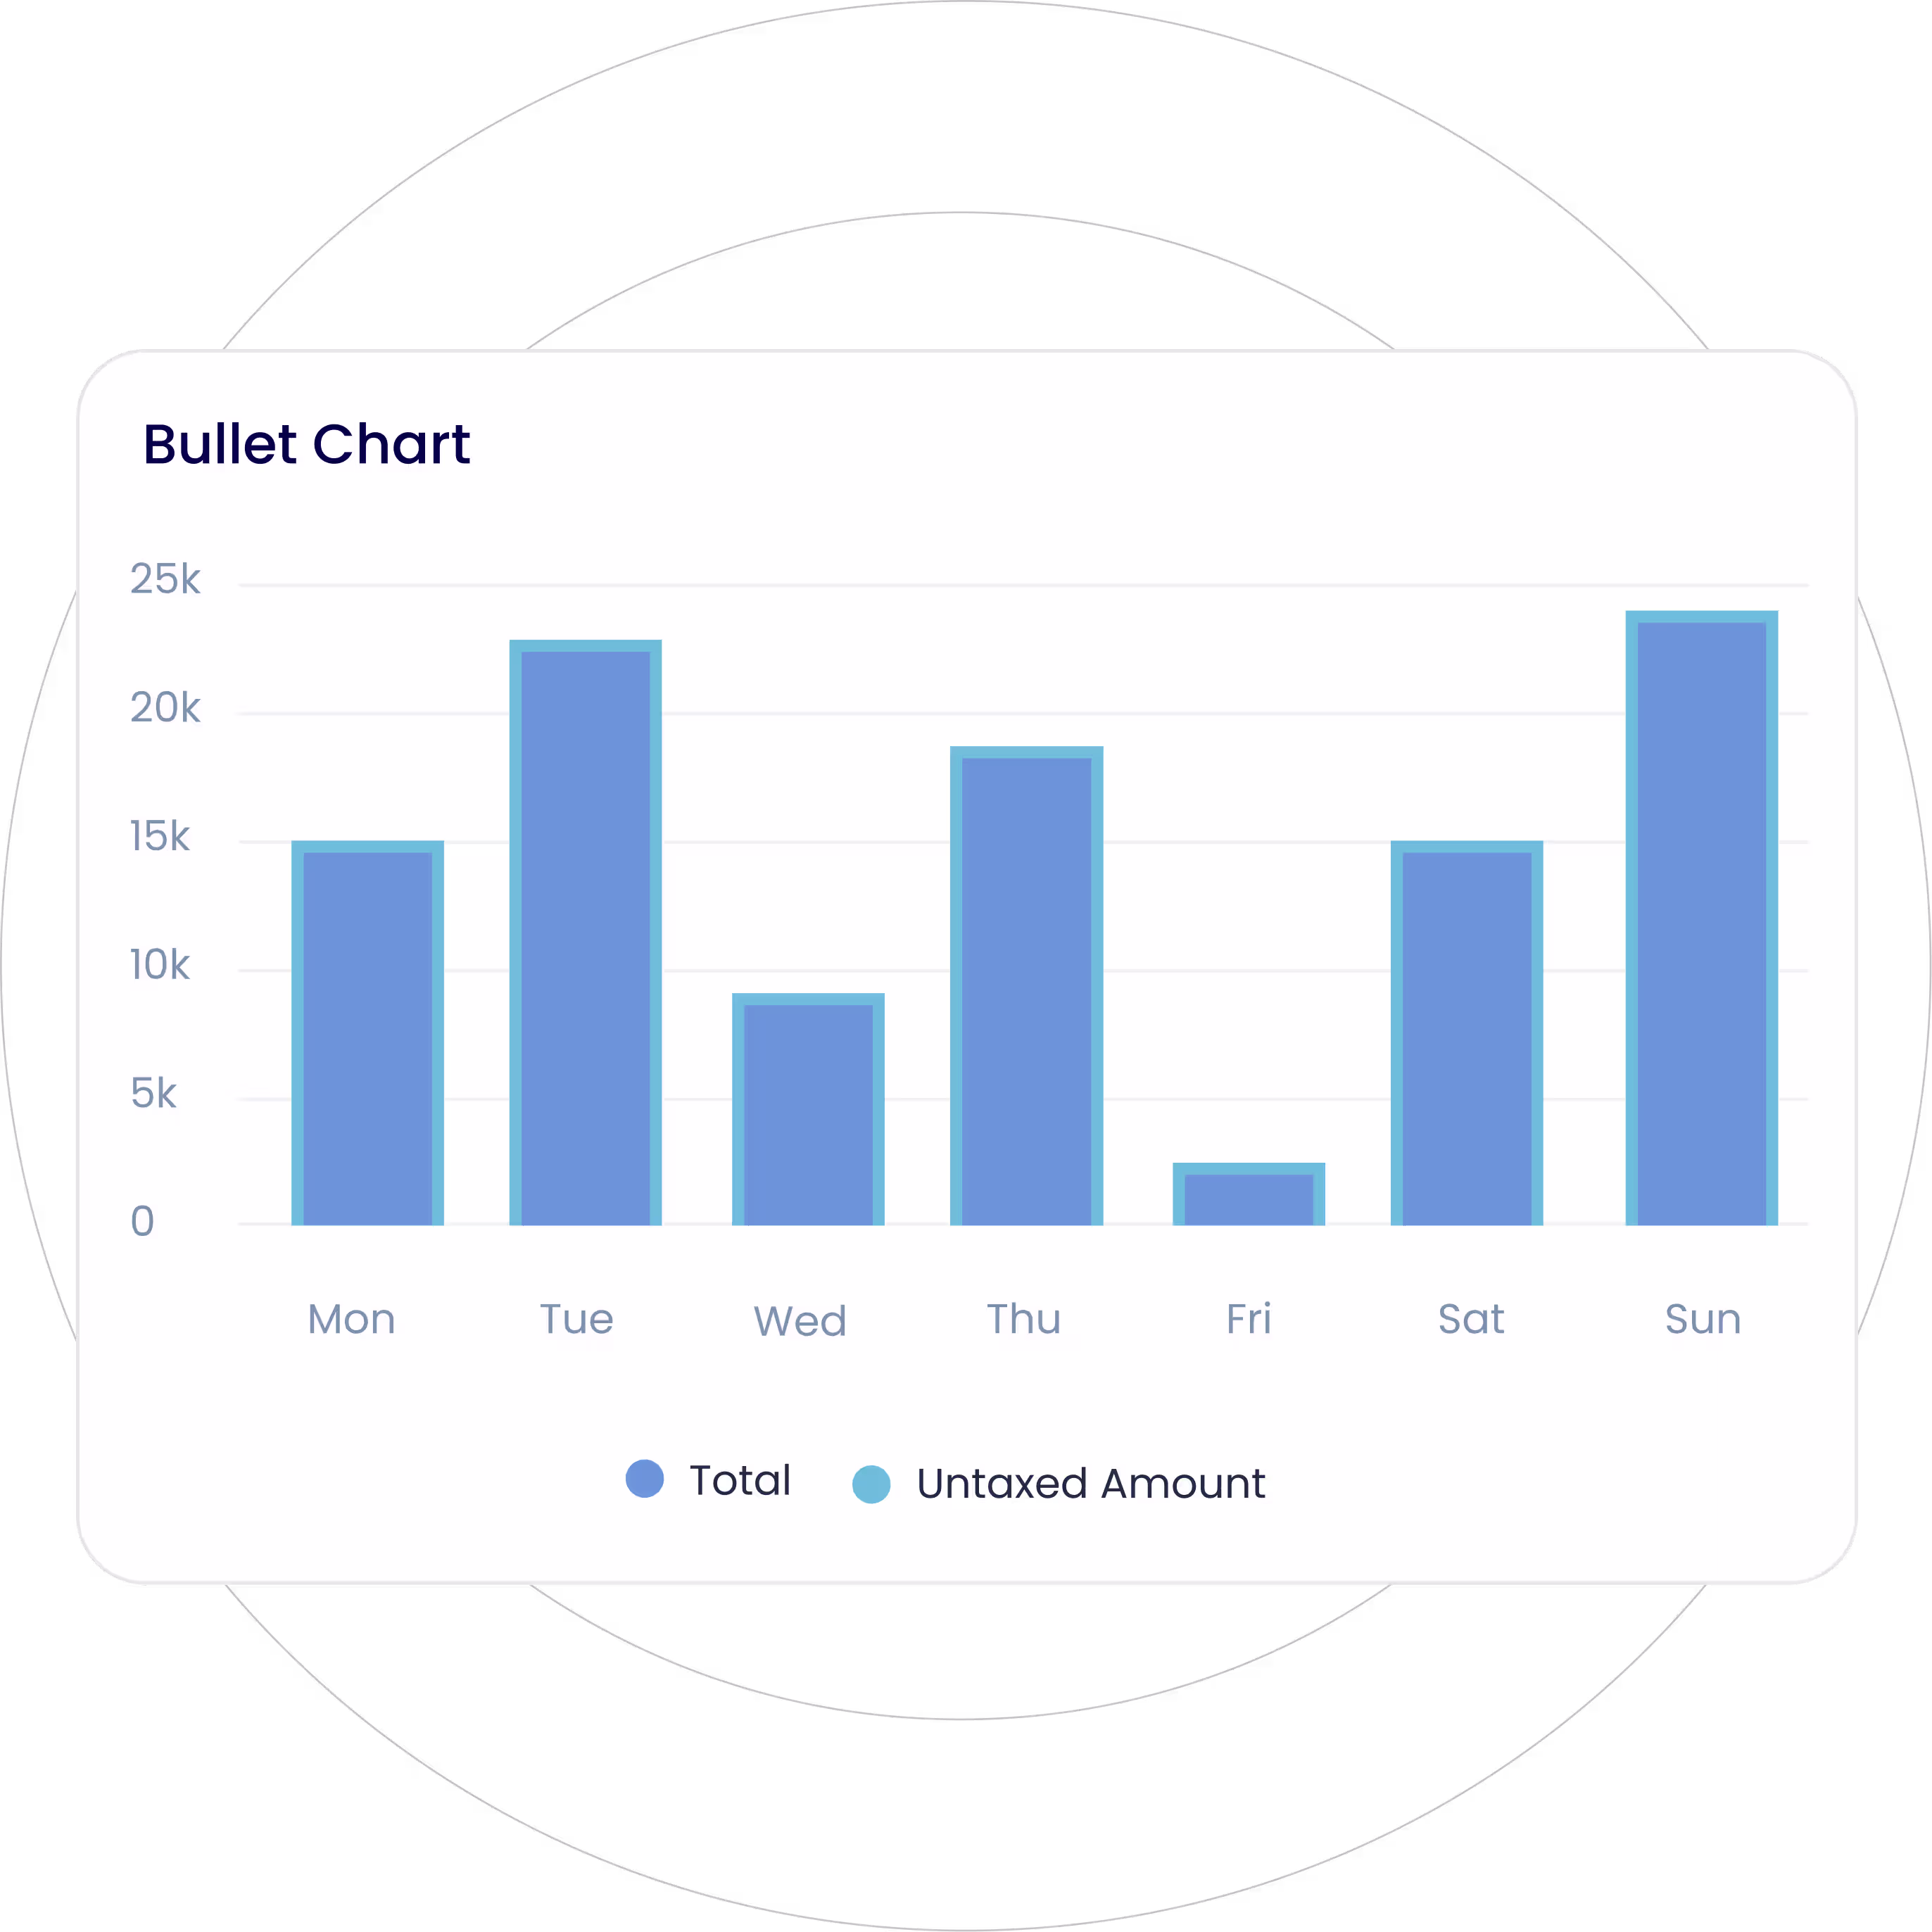
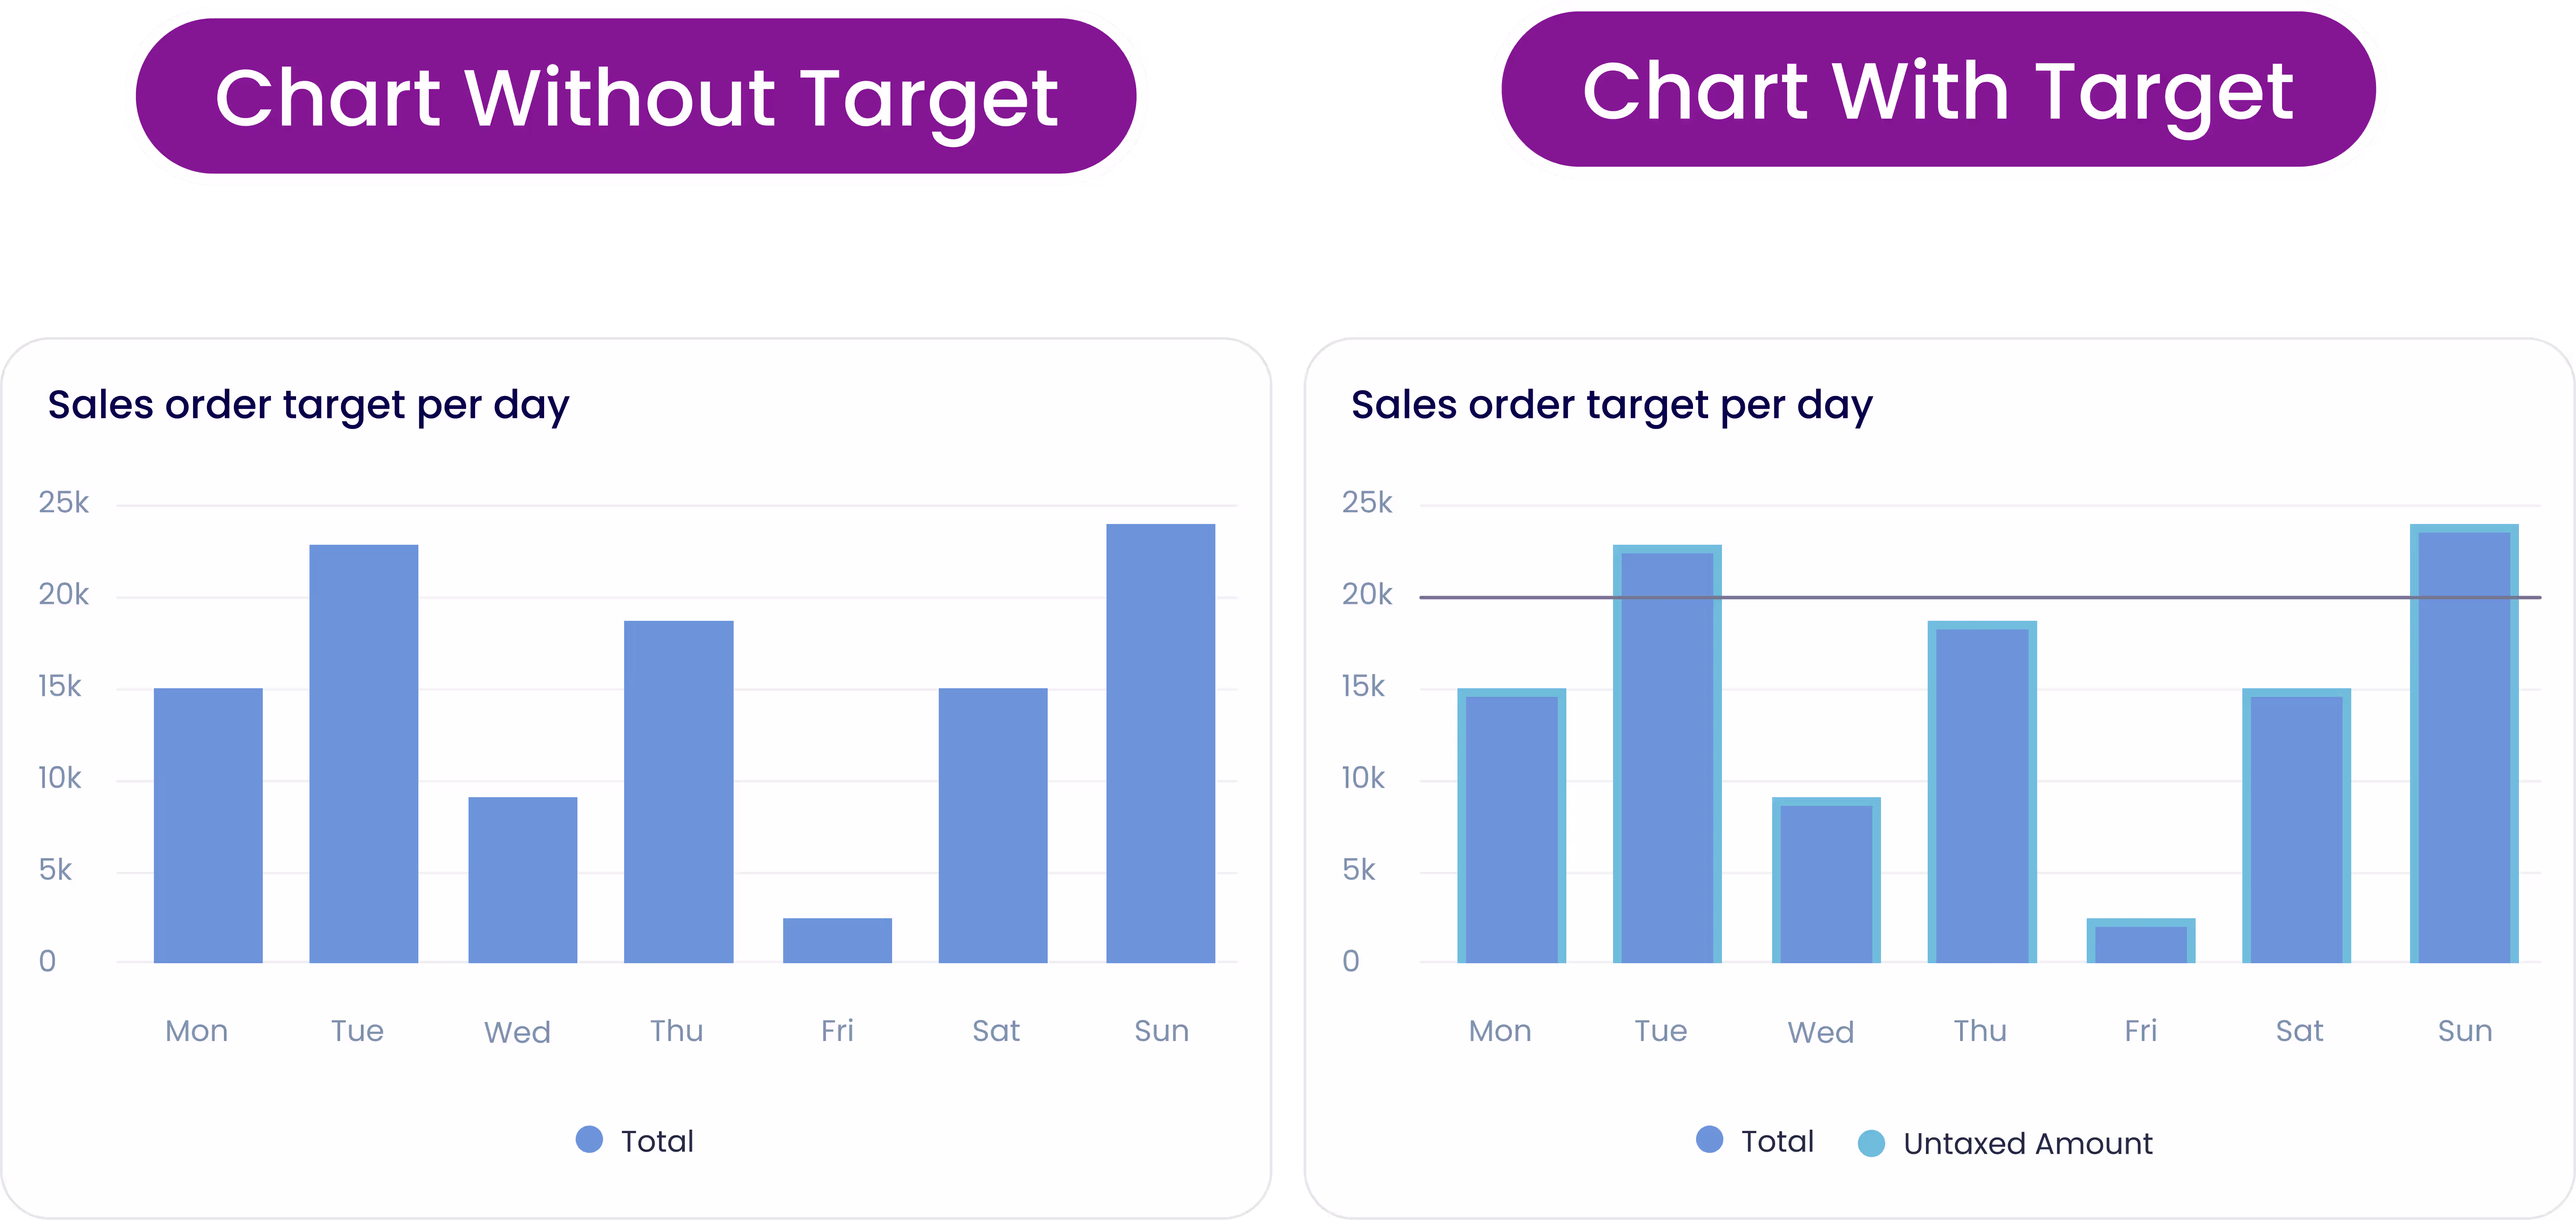
A variation of a bar chart with a reference line and markers to visualize performance against the target or benchmark.
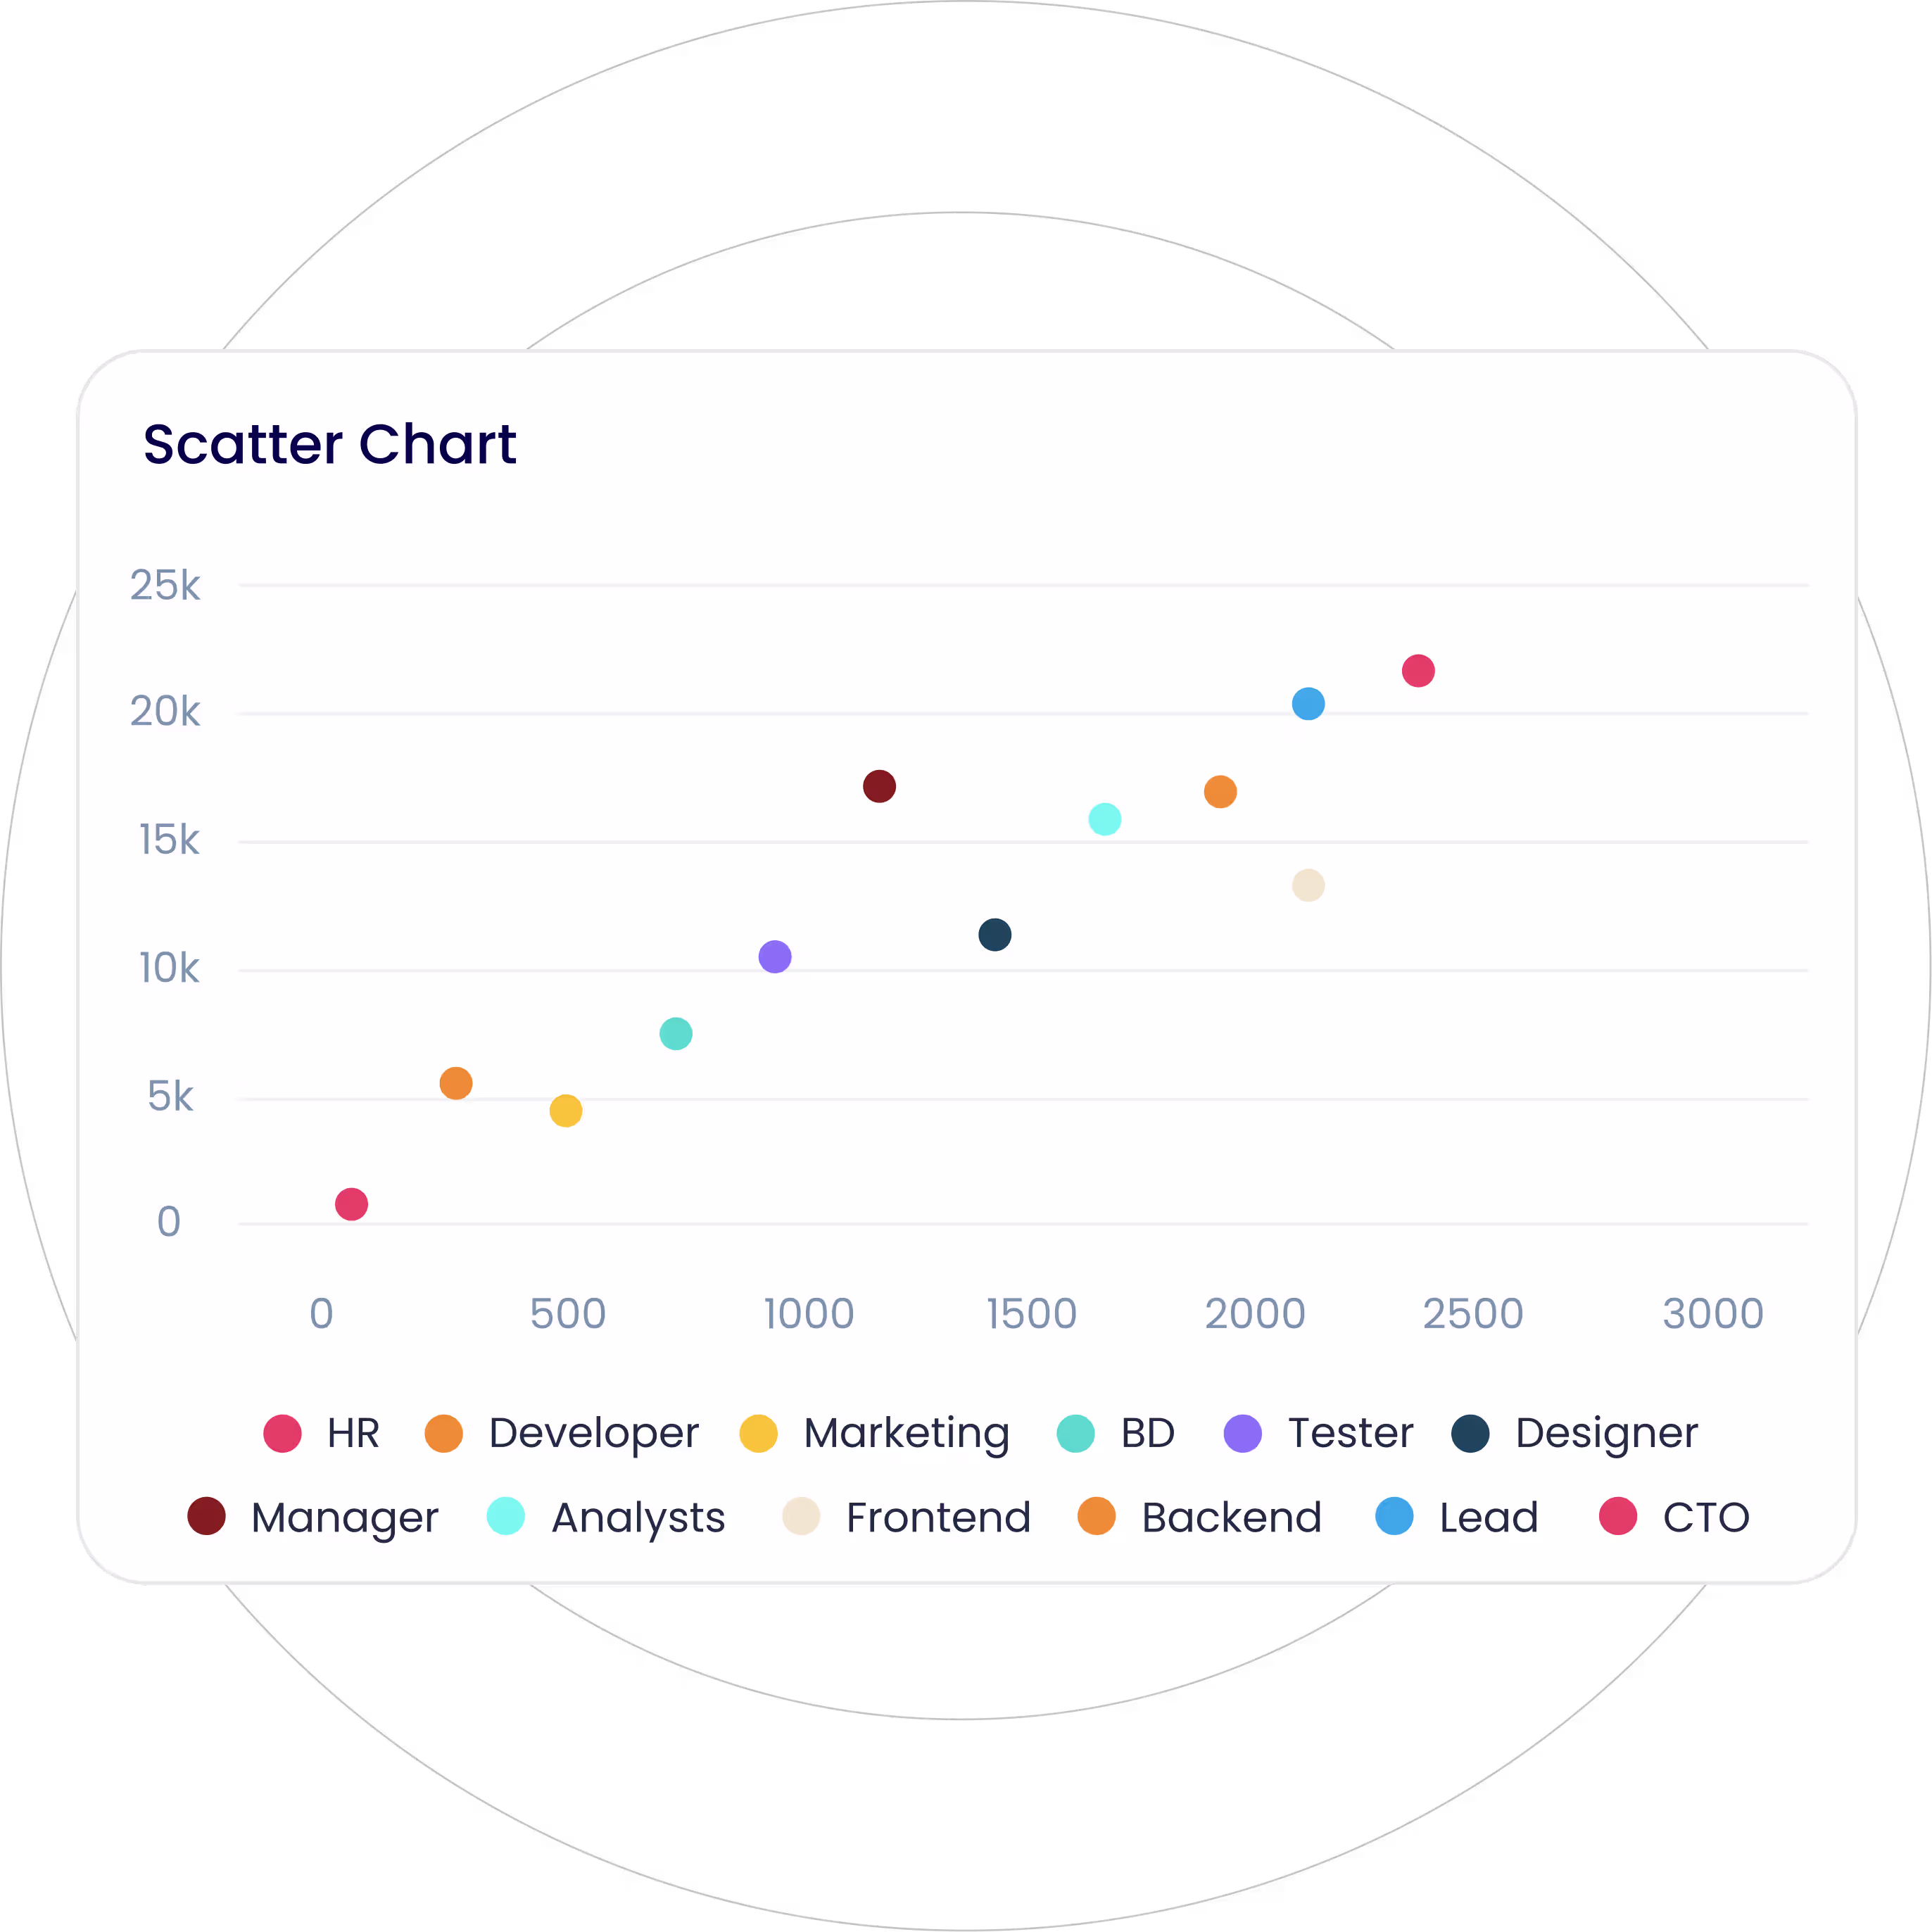
Visualize the relationship between two continuous variables of a data set, plotted across the X-Y axis.
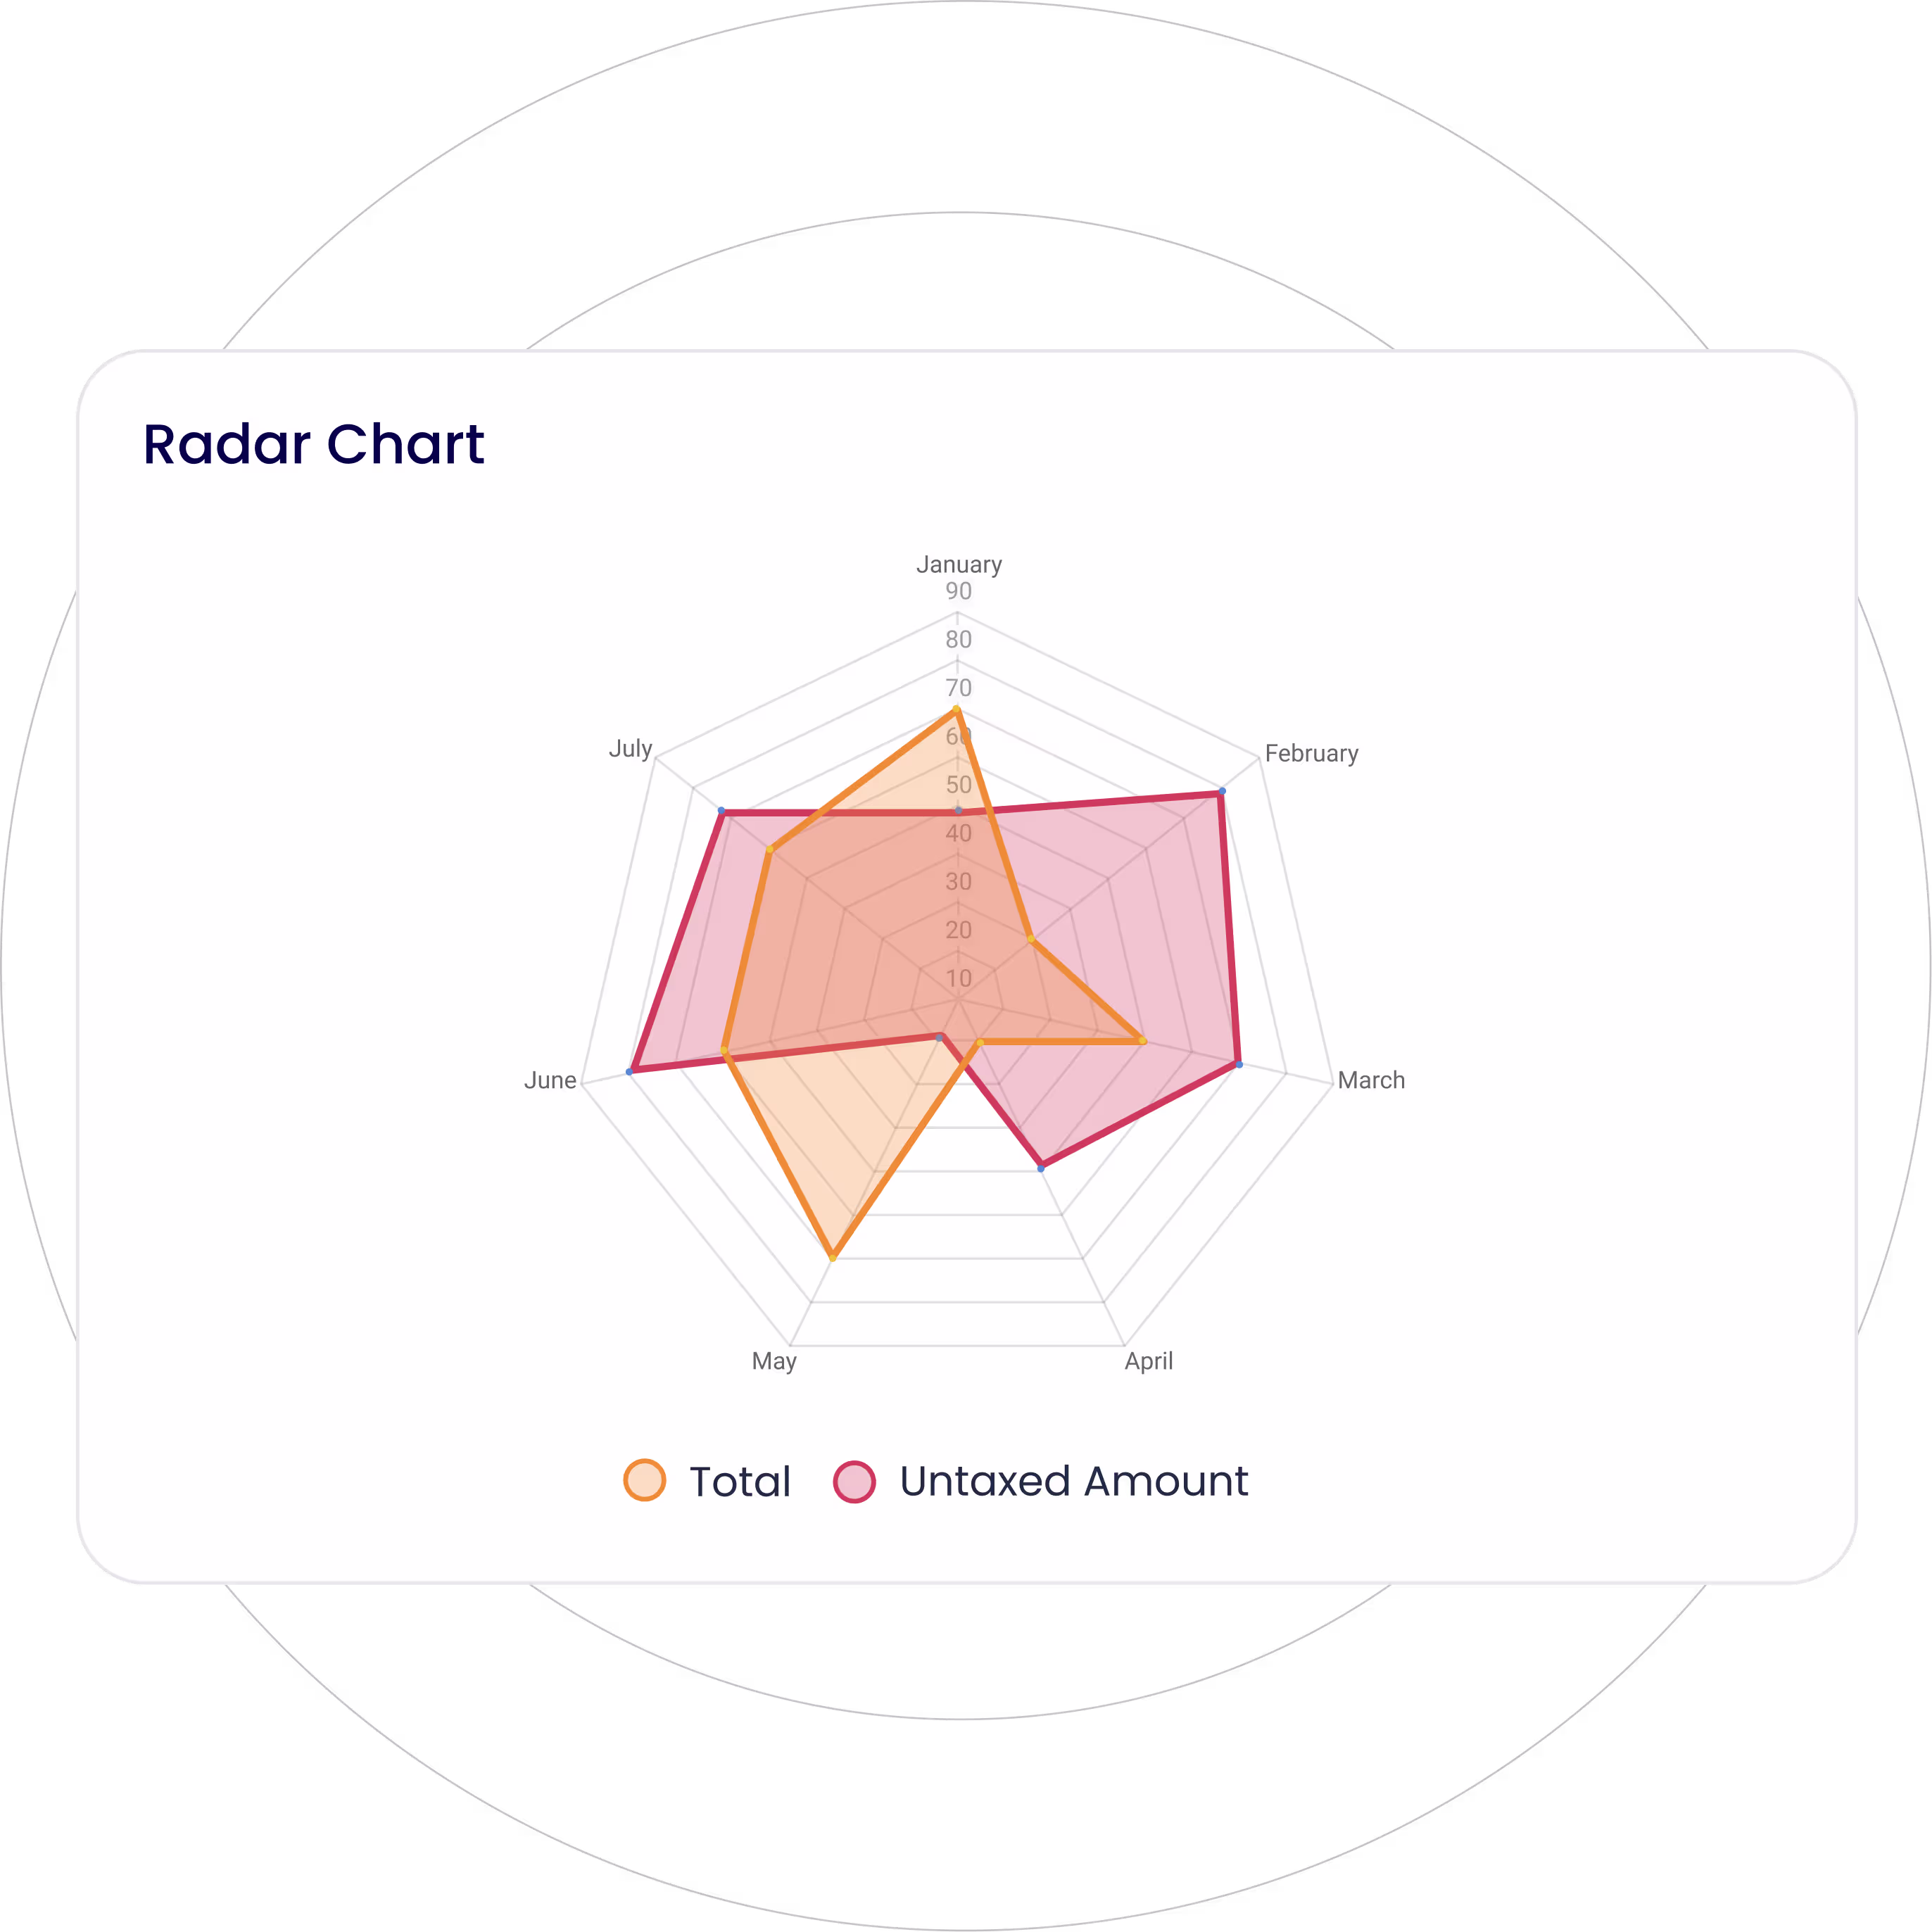
Display multivariate data stacked at an axis with the same central point, resembling a spider’s web.
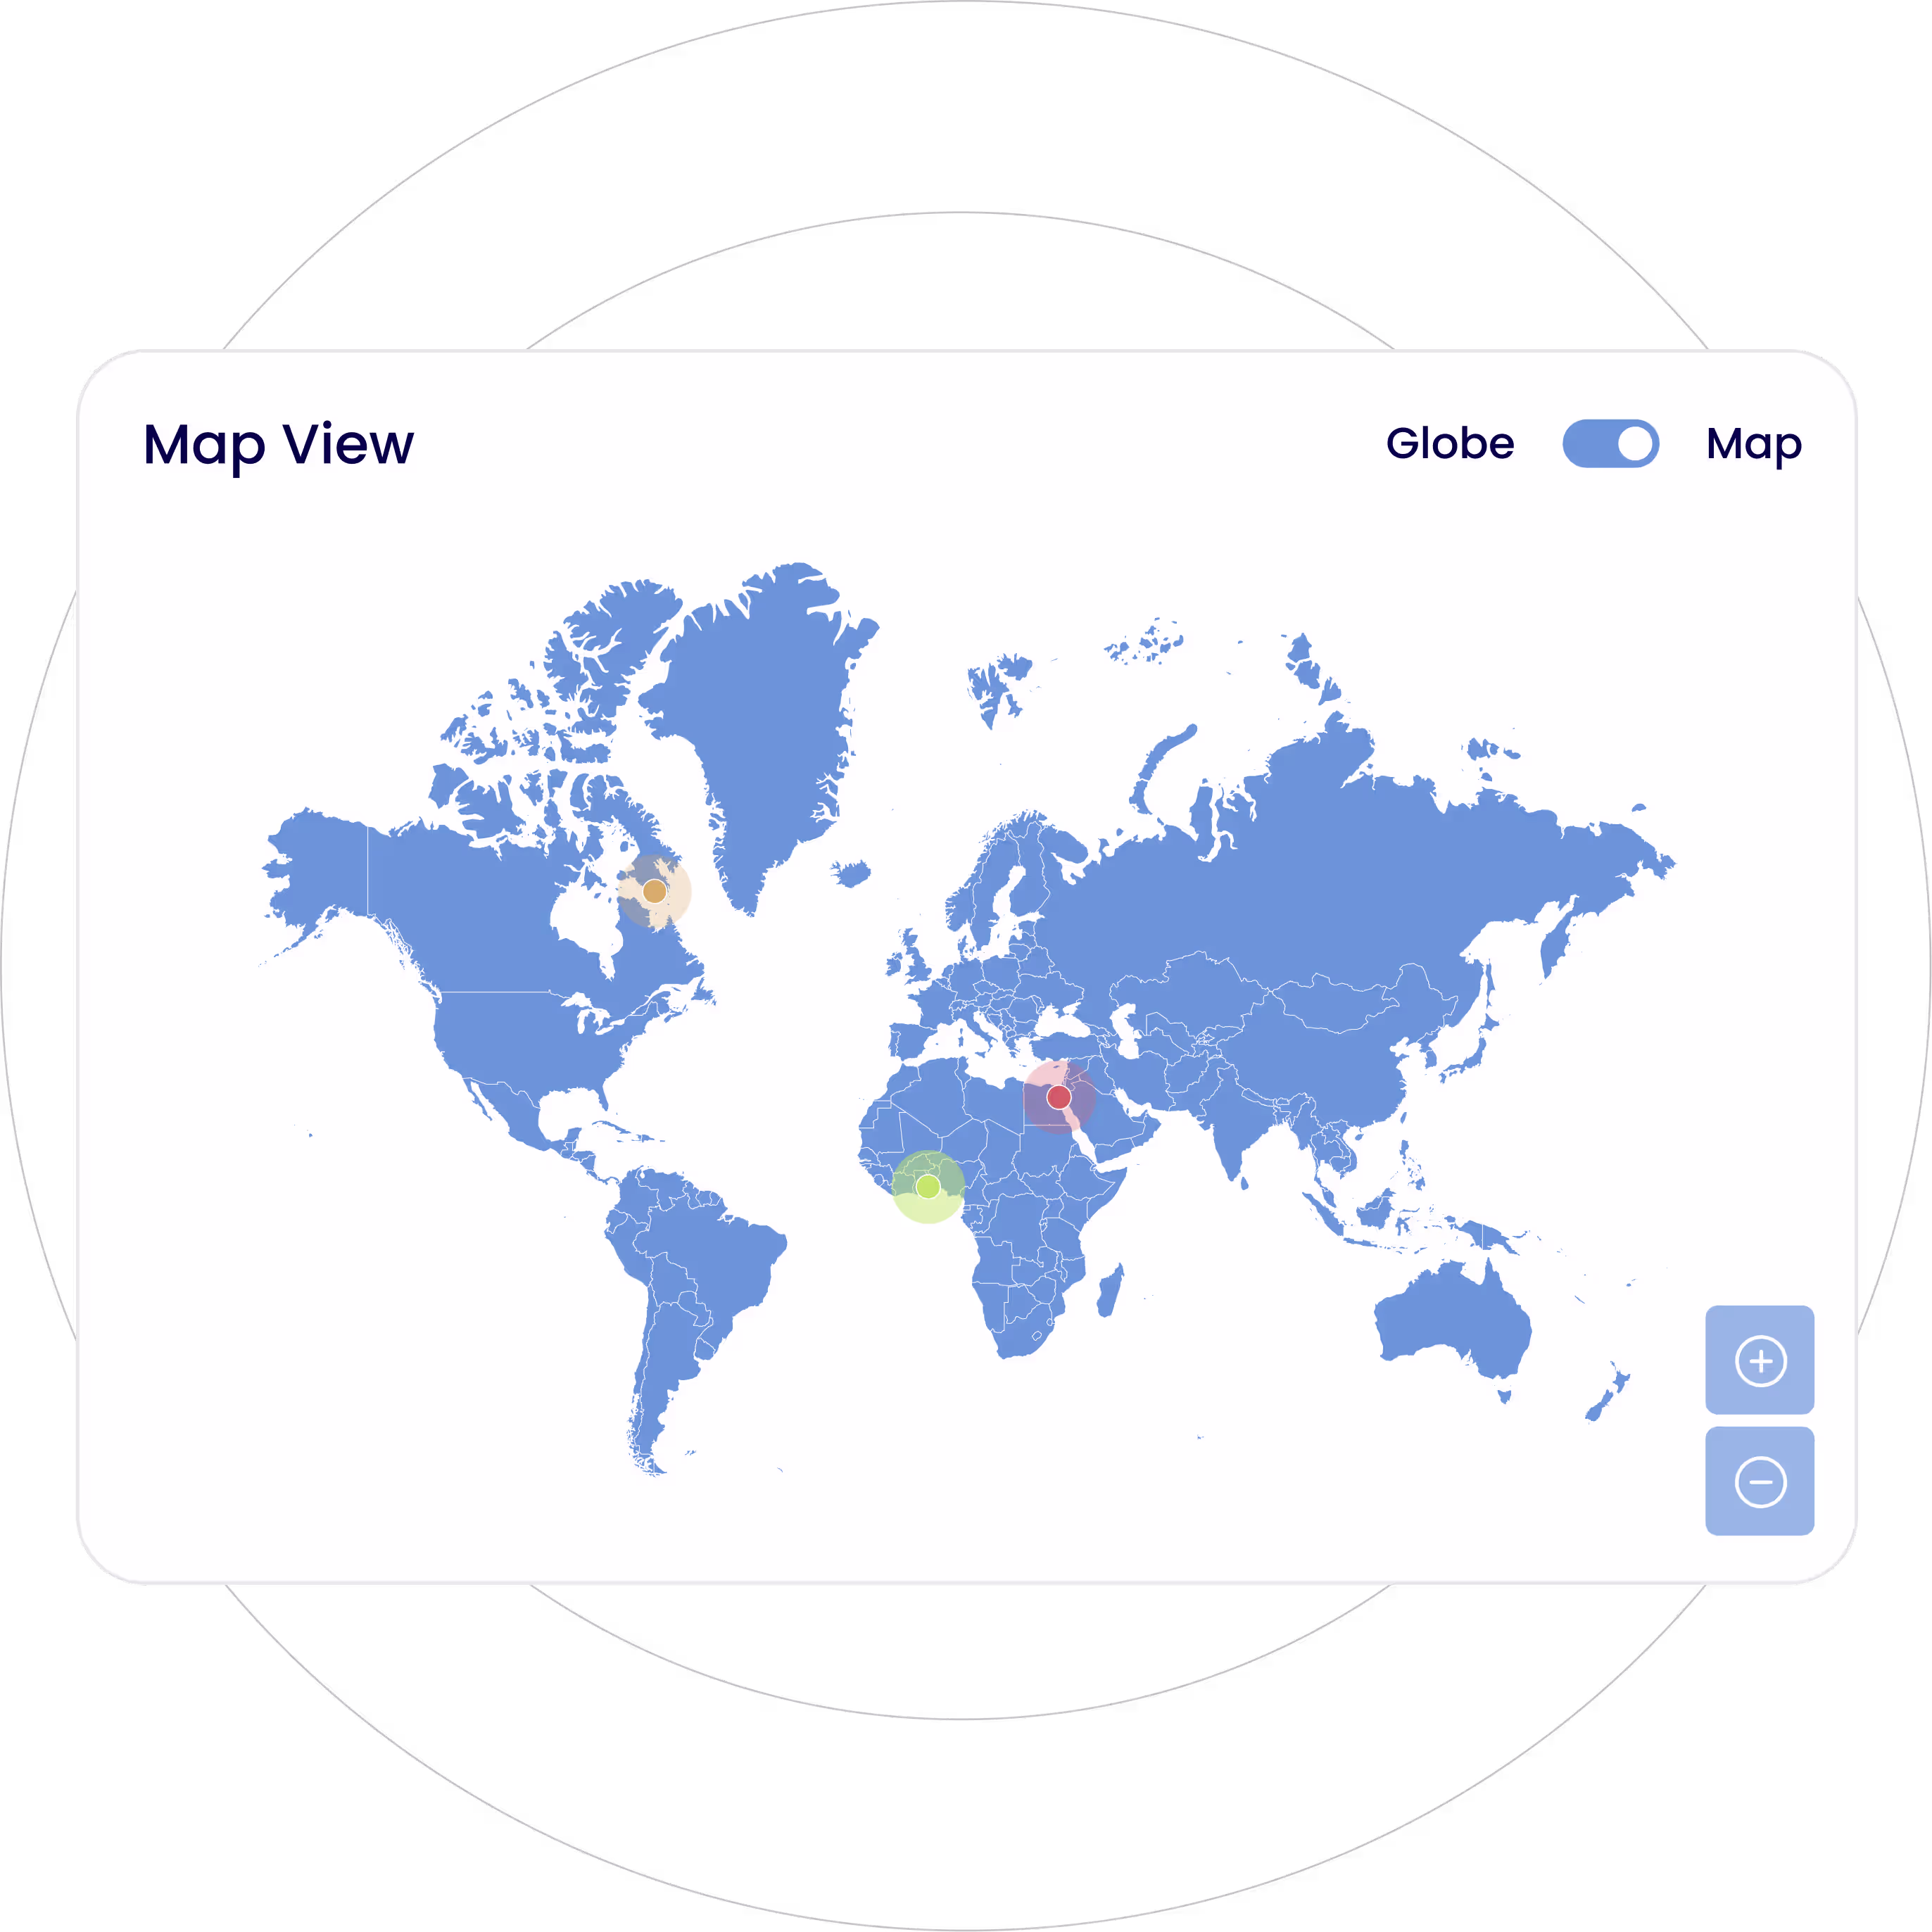
Visualize spatial data by plotting it on a geographical map for location-based analysis.
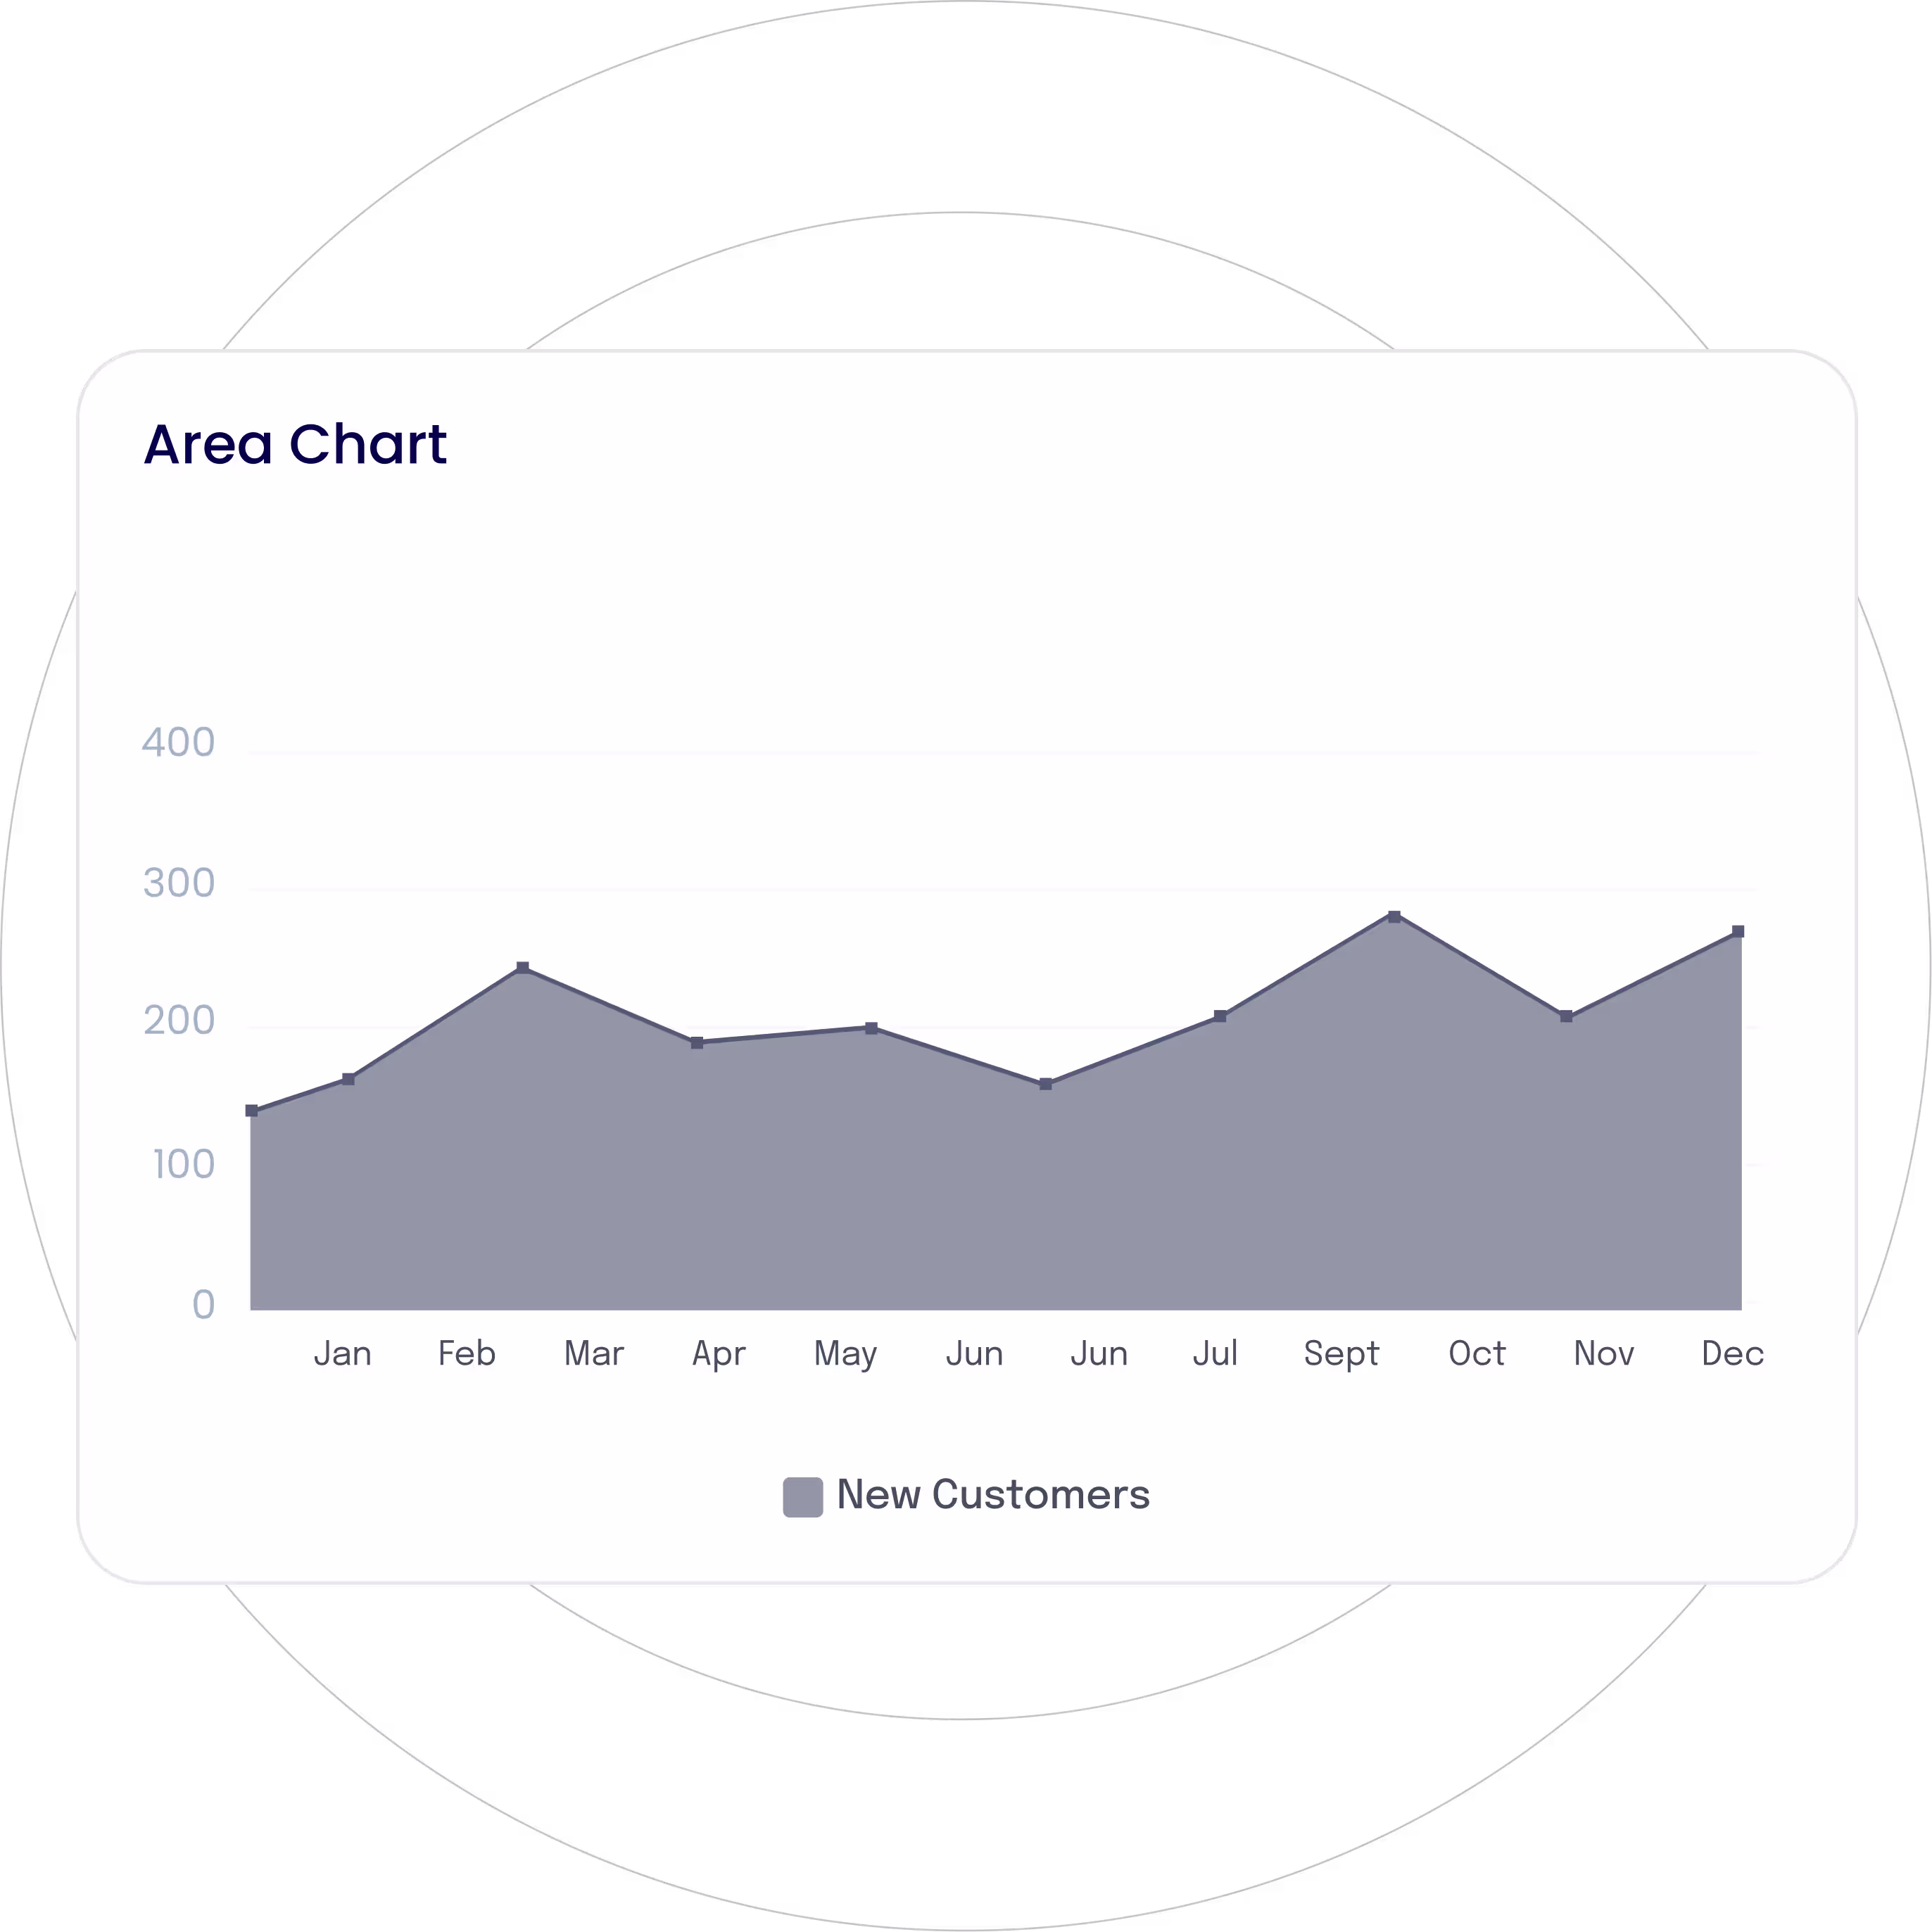
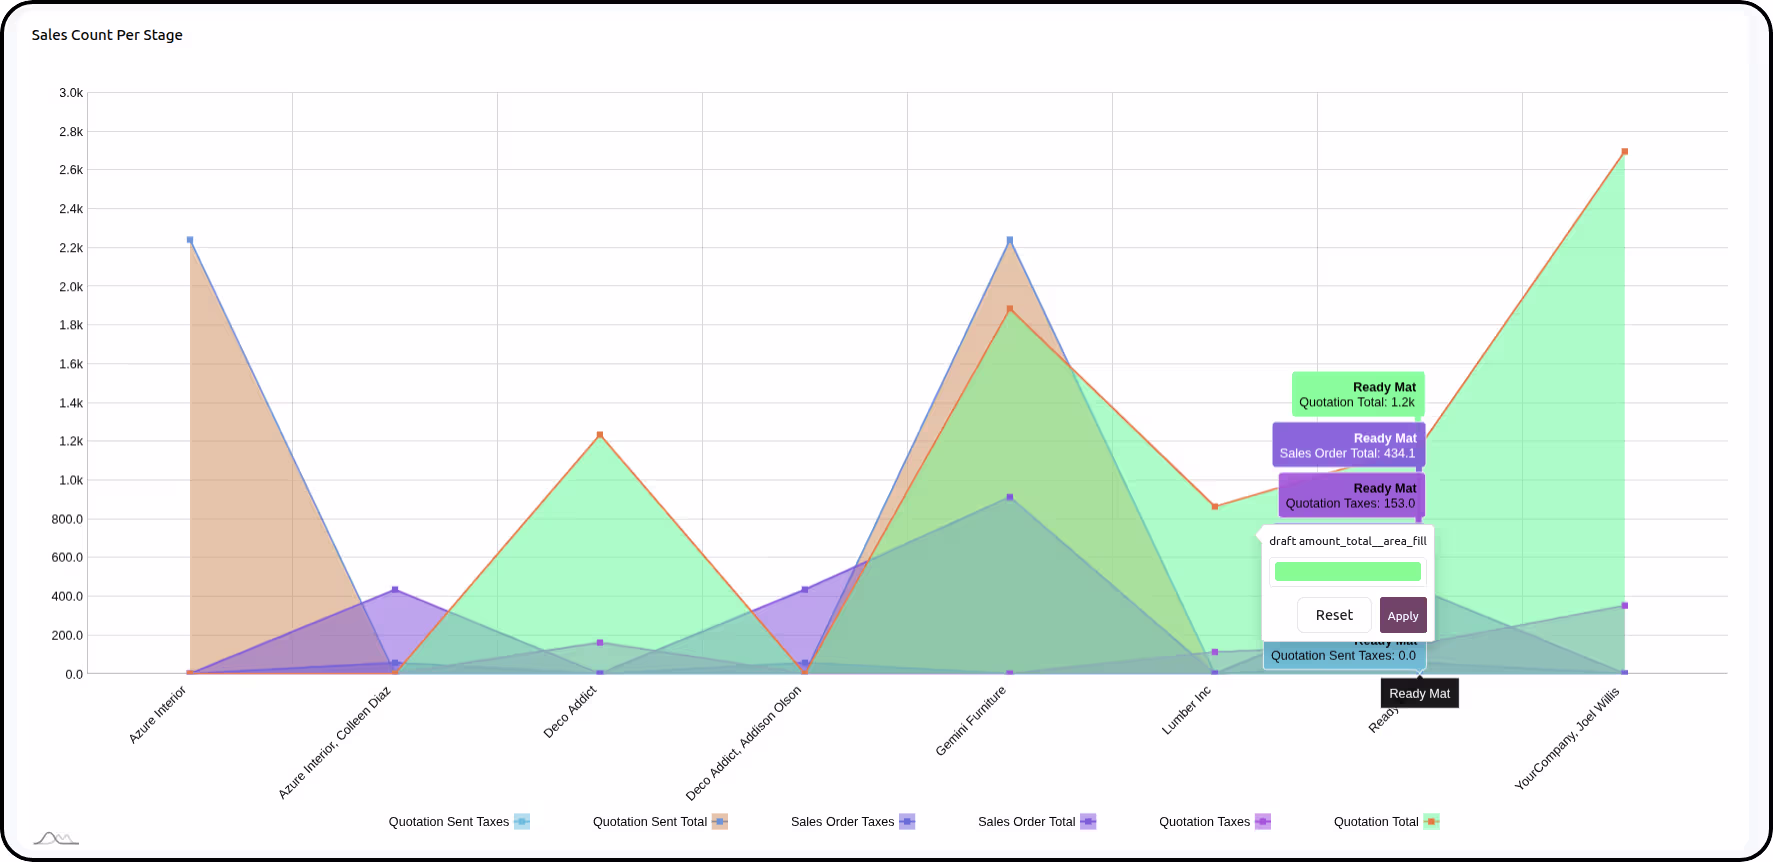
Display cumulative data by filling the area beneath the line chart, illustrating the changes over time or the magnitude of data.
Display key performance indicators (KIPs) in small square-shaped visualizations for a quick glance.
Visualize data trends, changes, or relationships over time by connecting data points with straight lines.
Present detailed data in a tabular format with rows and columns for easy sorting and comparison.
Visualize categorical data with rectangular vertical bars with the height proportionate to the value they represent.
Represent categorical data with rectangular horizontal bars, representing the difference between data categories.
Organize all tasks or actions that need to be completed in the form of a checklist, ensuring easy tracking of progress.
Represent cyclical data using radial lines separating segments, with each segment’s area representing its value.
Display your data in a circular graph, with each slice of a circle representing a fraction or proportionate part of the whole.
Similar to a pie chart with a central hole, providing a clean and modern look.
Visualize multivariate data wherein data points are displayed as petals radiating from a central point, with each petal’s size or color representing its value.
Visualize data as it moves through different stages of a process with decreasing segments. Ideal to visualize conversion rates or sales pipelines.
Represent multivariate data along concentric circles, where each circle represents a different variable or category.
A variation of a bar chart with a reference line and markers to visualize performance against the target or benchmark.
Visualize the relationship between two continuous variables of a data set, plotted across the X-Y axis.
Display multivariate data stacked at an axis with the same central point, resembling a spider’s web.
Visualize spatial data by plotting it on a geographical map for location-based analysis.
Display cumulative data by filling the area beneath the line chart, illustrating the changes over time or the magnitude of data.
Get started with Dashboard Ninja Onvodo® and build stunning Onvodo® dashboards in minutes!
Upgrade to a modern, intuitive, and scalable interface.
What makes Onvodo® Dashboard Ninja Onvodo® Unique
The ultimate time and money saving Onvodo® tool for your Business.
Unleash the Power of AI in
Your
Onvodo® Dashboard
Generate smart, interactive charts with a single click.

Dashboard With AI
Focused Dashboard
Items With AI
With AI Items
Reporting Dashboards
Streaming Dashboard
& Flexible Layout
Items (Excel, CSV, PDF,
PNG)
Dashboards or Specific
Dashboard Items
Enterprise/
Onvodo®.sh Support
Move Dashboard
Dashboard Tile Items
Group By, Limit & Sort By
2 List View Styles
Dashboards
Personalization/
Configuration
Interactive Dashboard
Layouts
Item Data

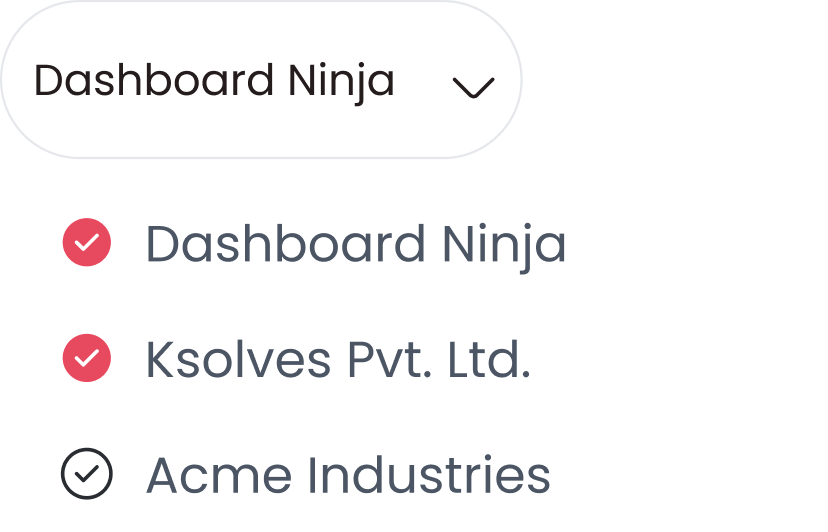
%MYCOMPANY Filter
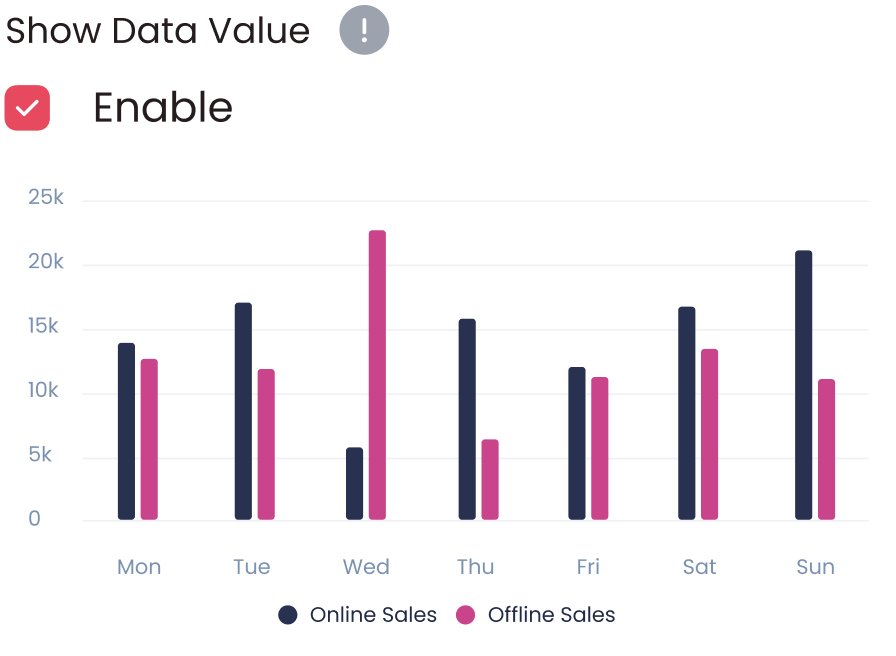
Data Values
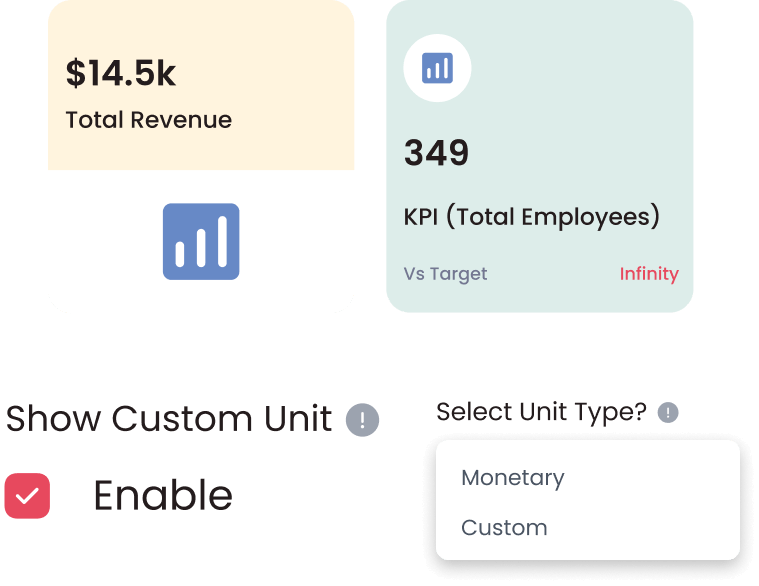
Custom Units
Support
Support

Support
Visualize Your Business Like Never Before Create smart, interactive reports with Dashboard Ninja Onvodo® AI.
Schedule your free demo today!

Free 90 Days Support
Onvodo® will provide FREE 90 days support for any doubt, queries, and bug fixing (excluding data recovery) or any type of issues related to this module. This is applicable from the date of purchase.


Dashboard Ninja Onvodo® Features
Explore intuitive features that empower you to turn your Onvodo® data into actionable insights. Track key performance indicators and make informed, data-driven decisions.
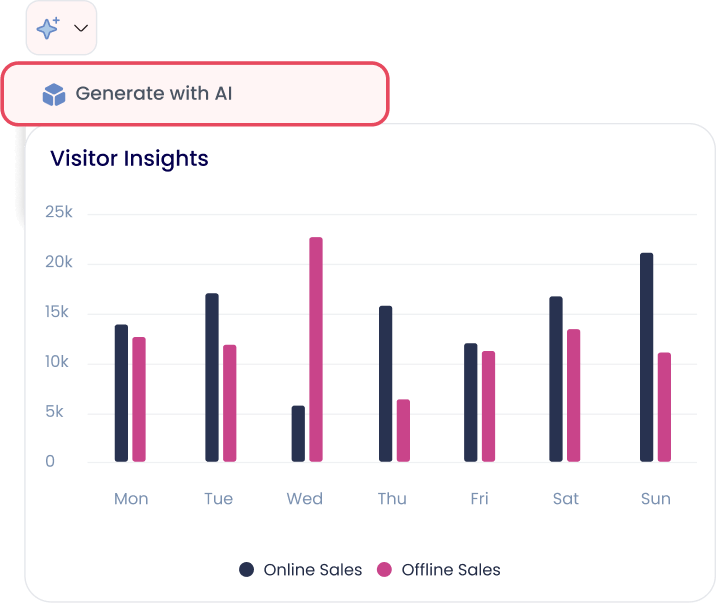
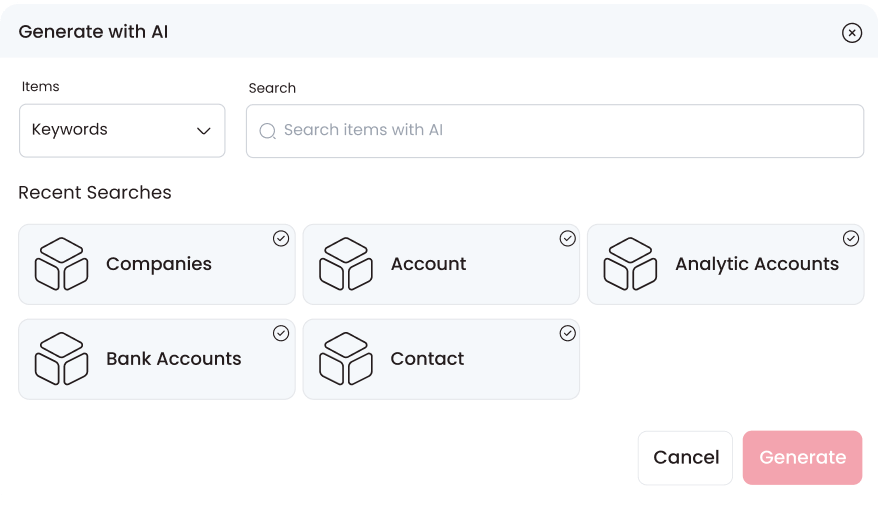
Generate Items with AI
Generate multiple items for your Onvodo® Dashboard with AI.
Gain the flexibility to
choose from a range of charts and graphs and save them
with ease.
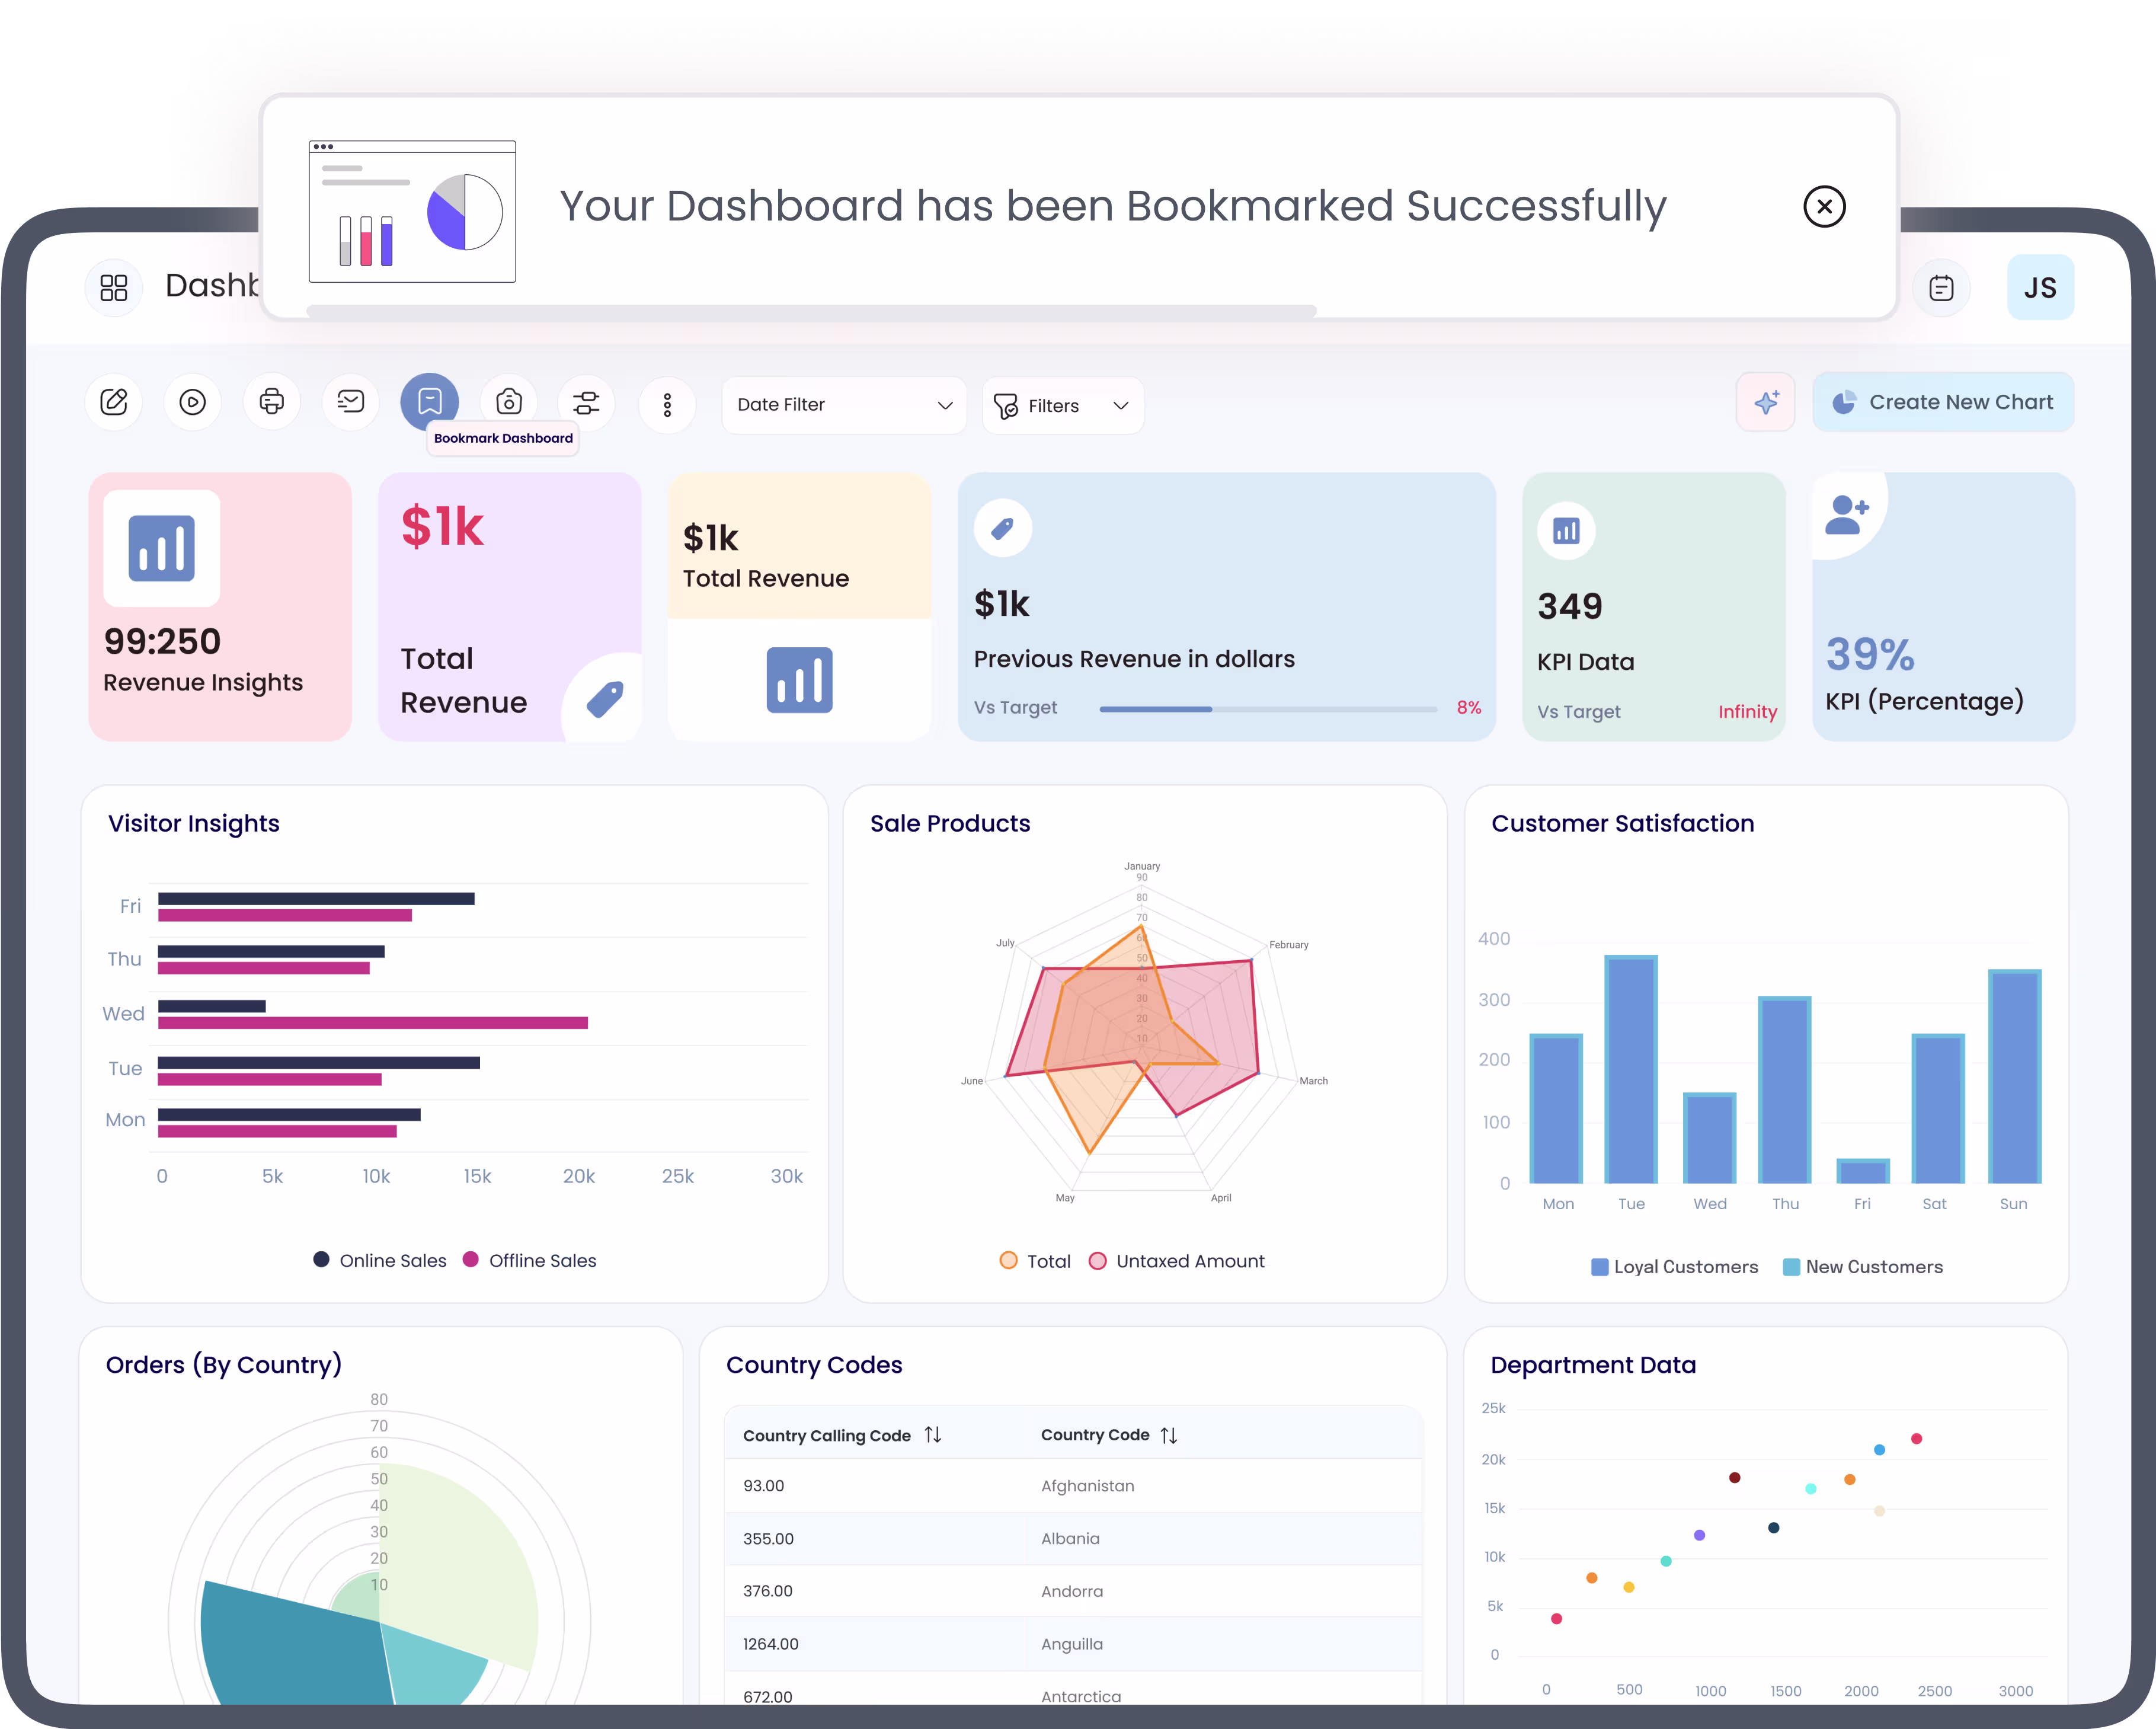
Bookmark Dashboard
Bookmark your key dashboards and easily access them for faster data analysis. Effortlessly remove dashboards from the bookmark when you are done with them.
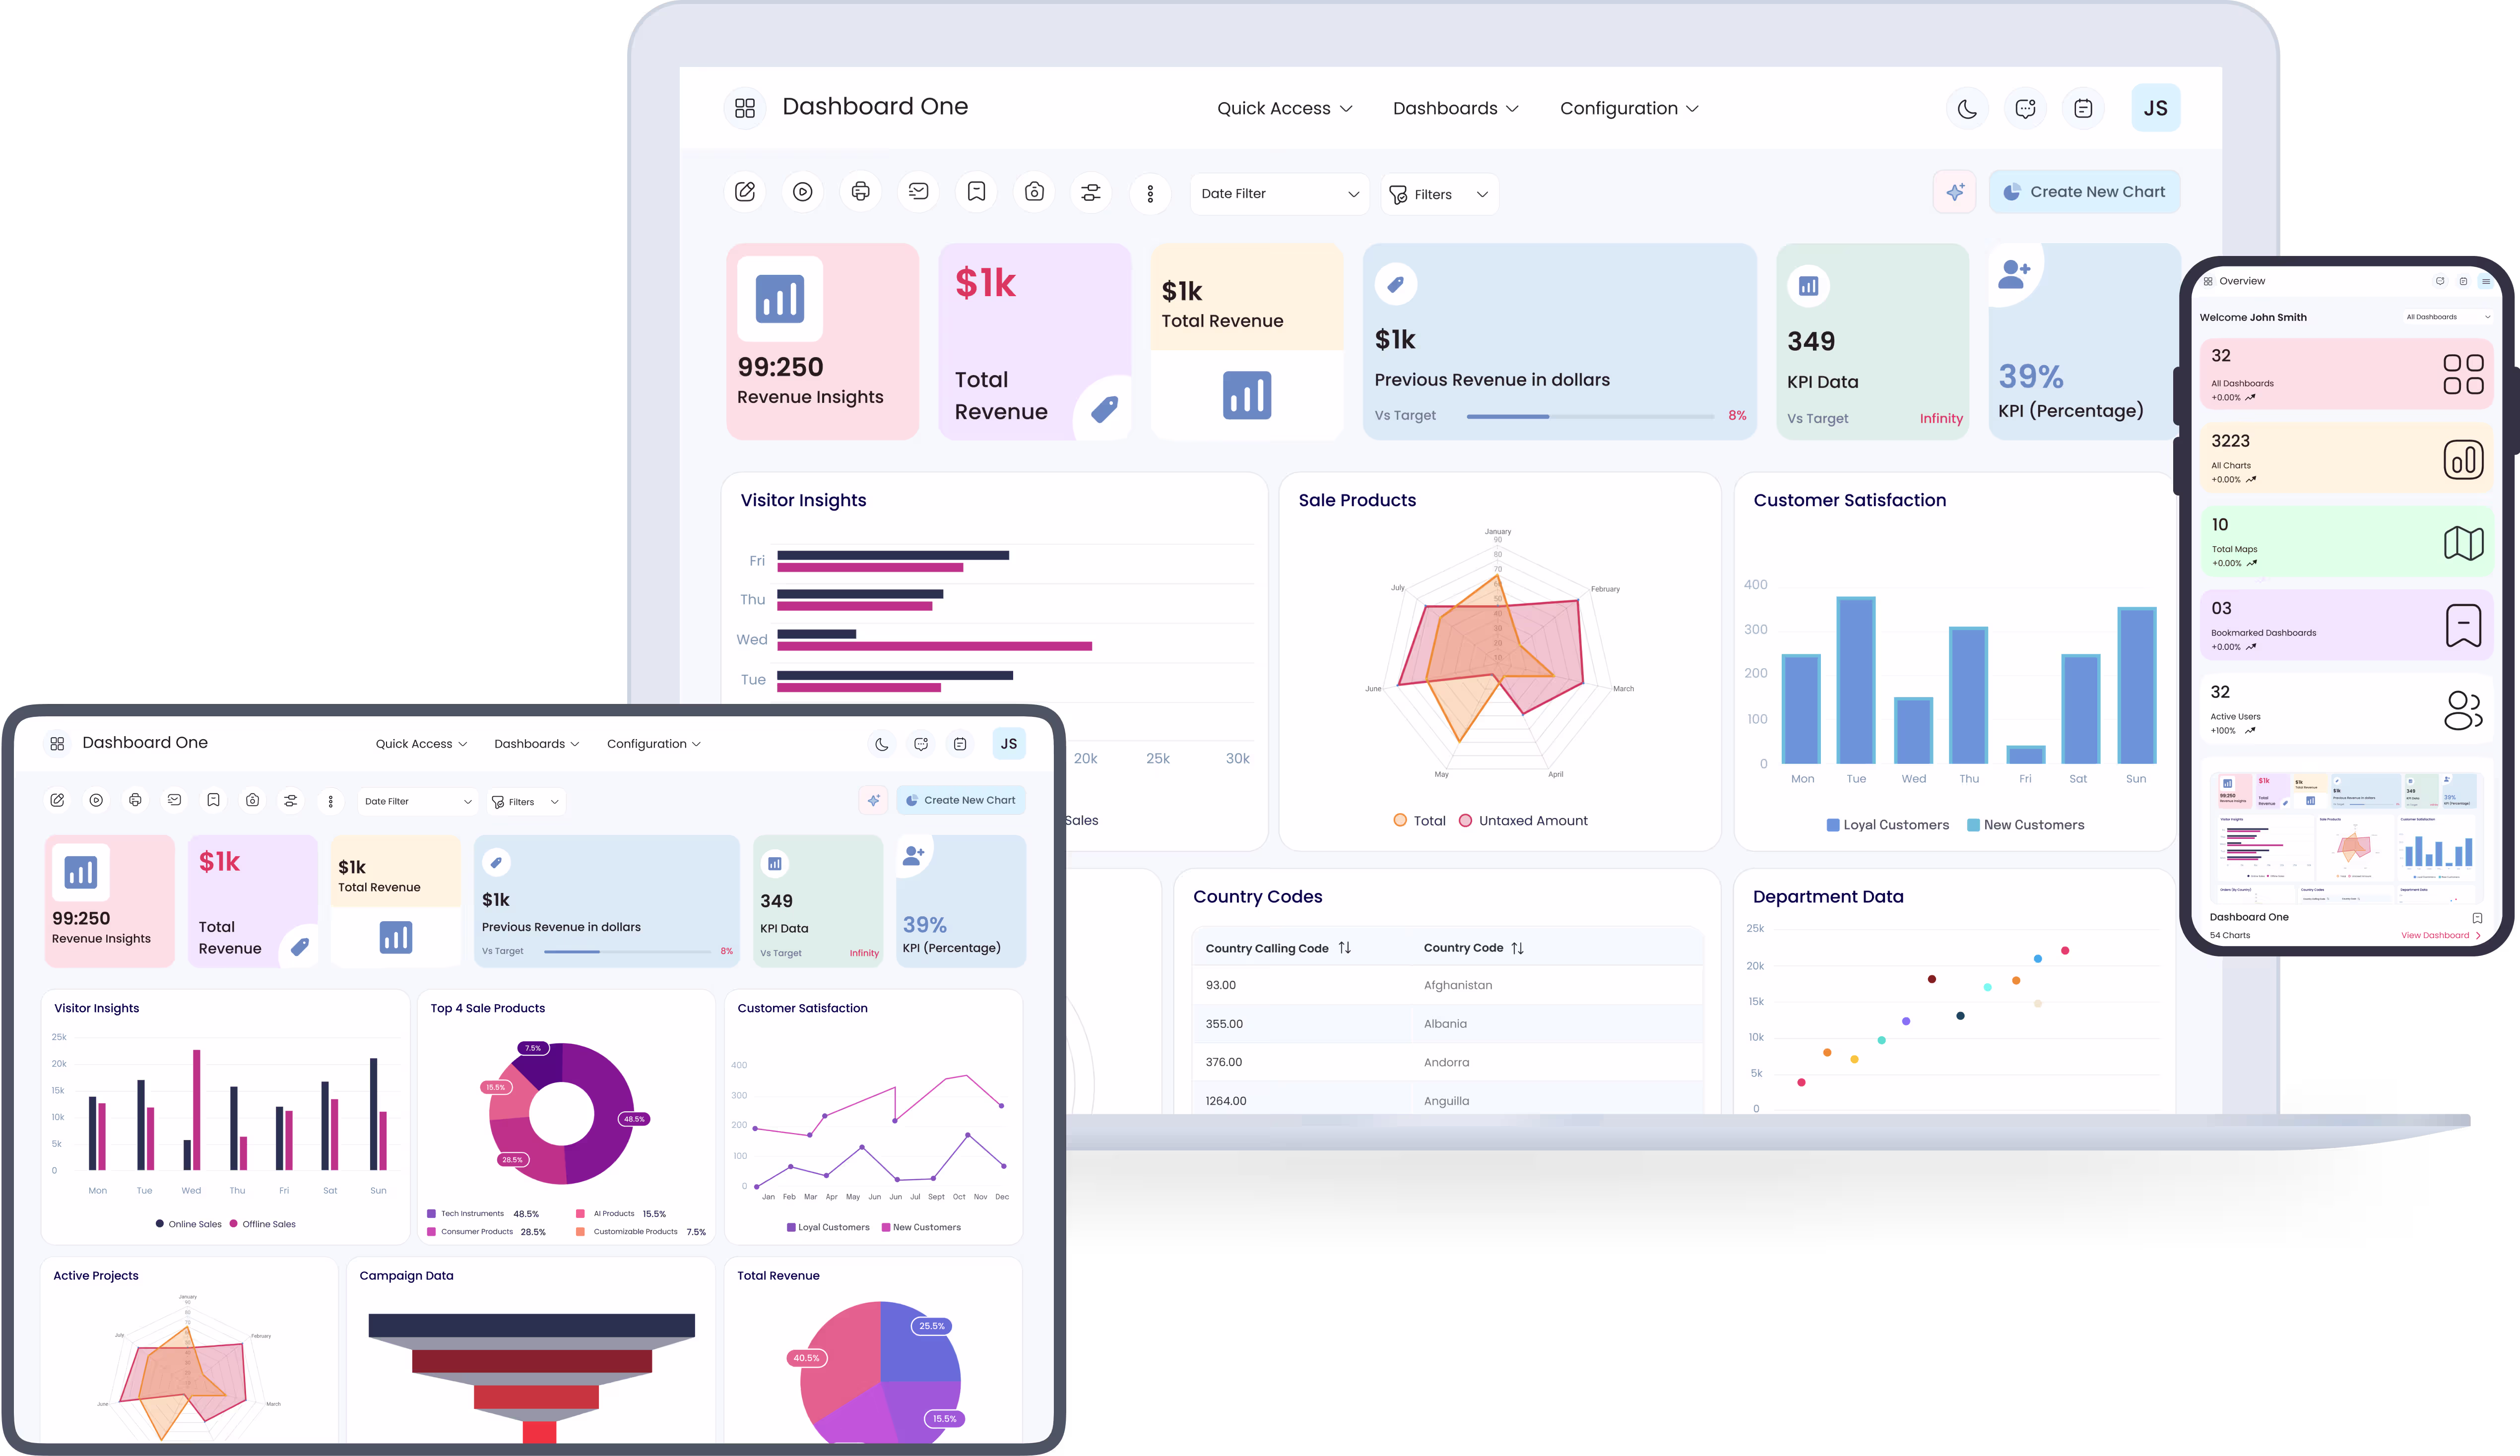
Responsive Fluid & Flexible Layout
Conveniently view your data over different devices such as Mobile, Desktop, or Tablet for easy access. It offers an optimized browsing experience to track business performance on the go.
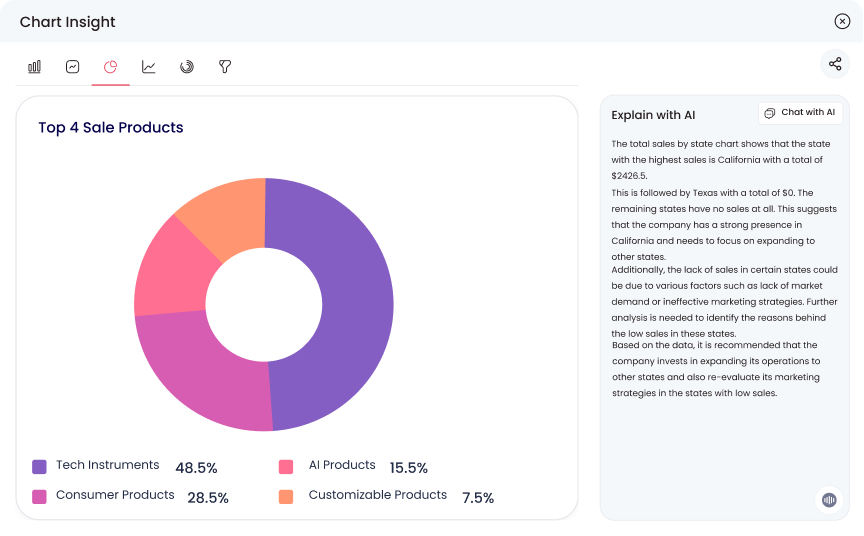
Extract Chart Insights With AI
Interpret complex charts with single-click AI-generated explanations! Identify hidden patterns & trends and make informed data-backed business decisions.
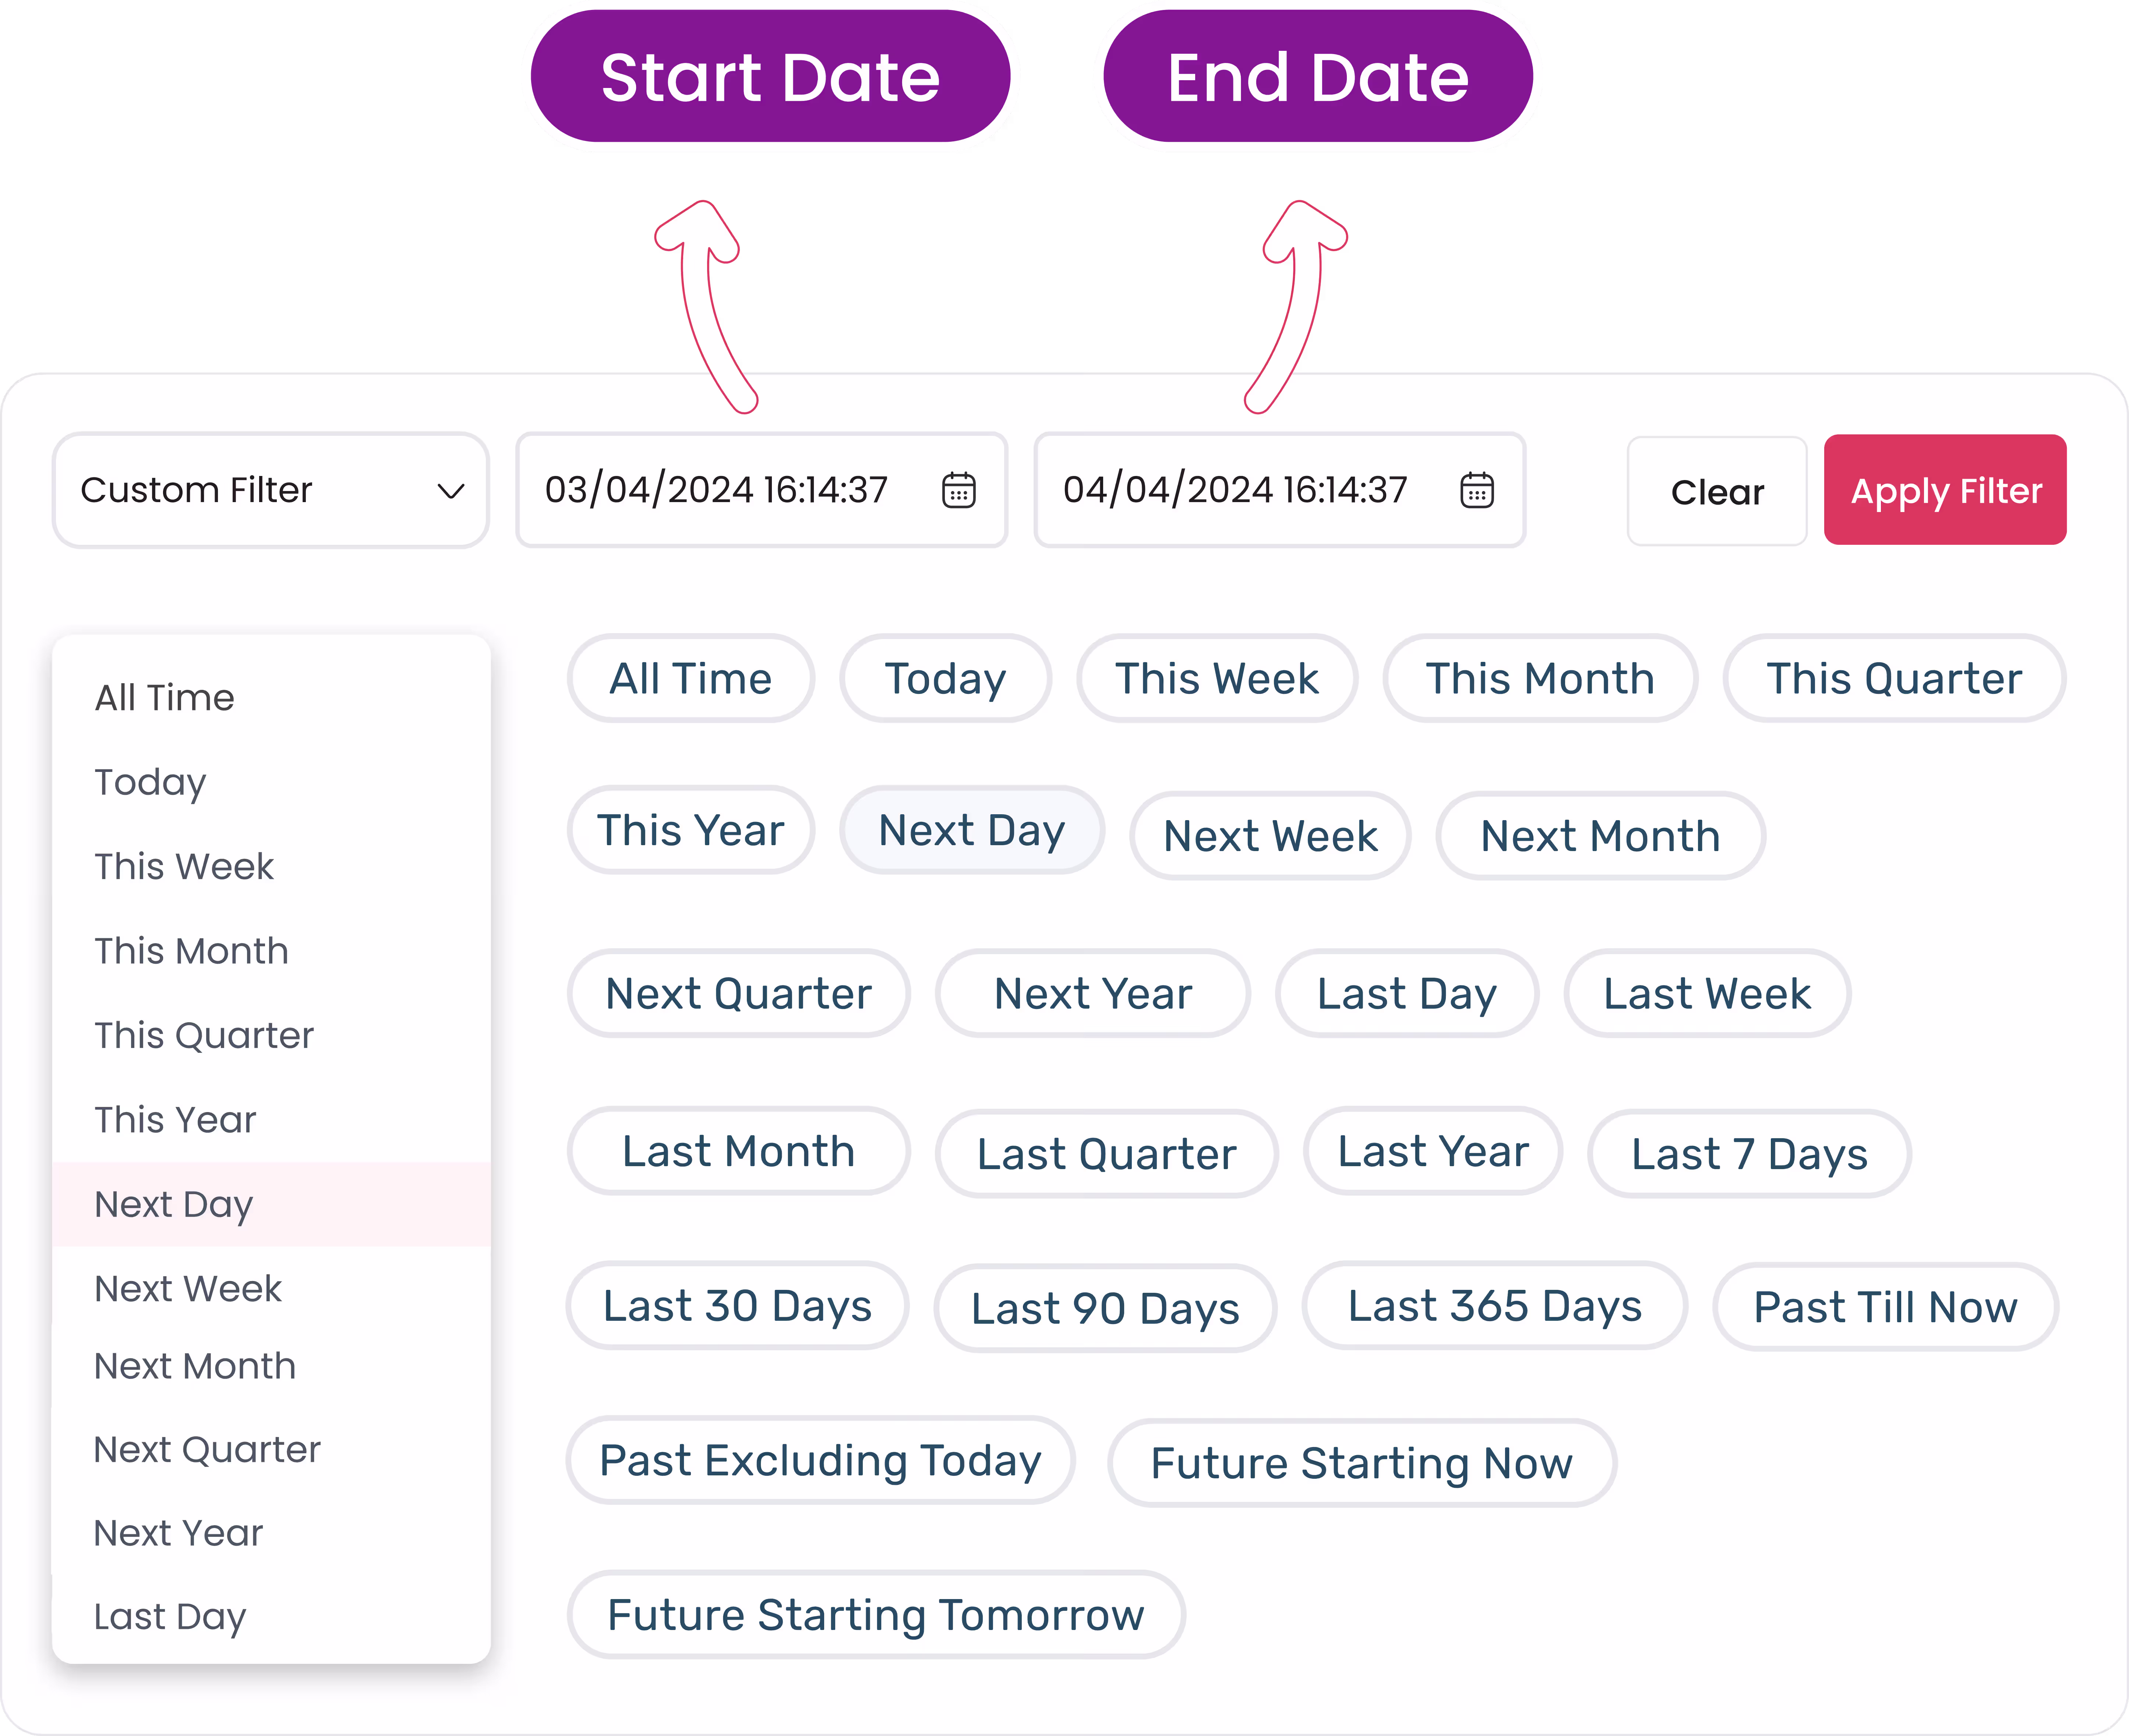
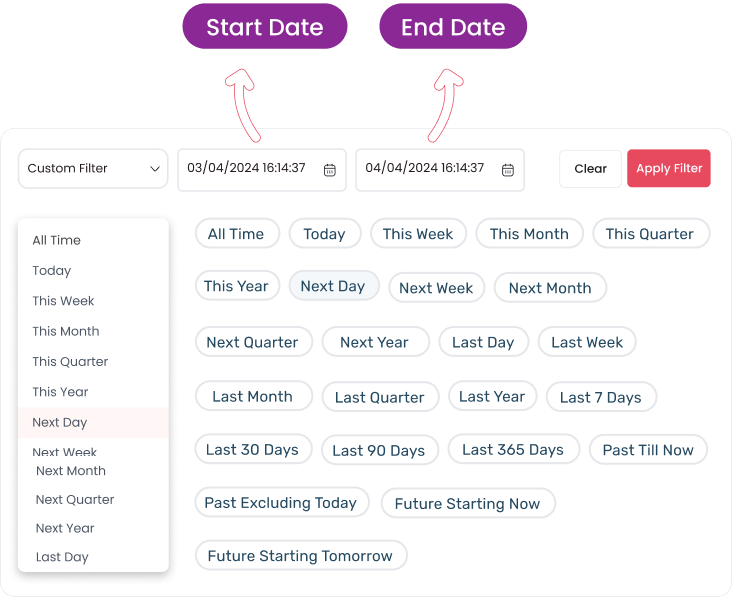
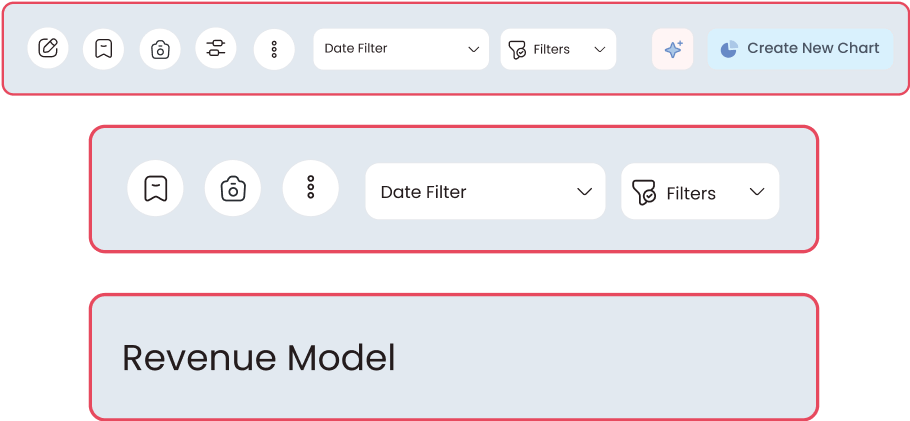
Advanced Date Filter
Present data in a timely manner over a selected period in the date filter option. Select from 20 predefined date filters (Last 7 days, Last 30 days, Last 90 days, & more) or choose a custom date.
Internal Chat
Collaborate with your team members with the chat feature on every item of a dashboard. A dedicated channel is created for conversations on each item, and all channels are organized in a unified inbox.
Switch Layout
Switch from one graph style to another with just a single click, retaining the same data. Effortlessly analyze your data with the desired data visualization chart!
Generate keyword-focused Onvodo® Dashboard Items with AI
Now just provide the keyword, and AI will create the dashboard items for you within seconds.
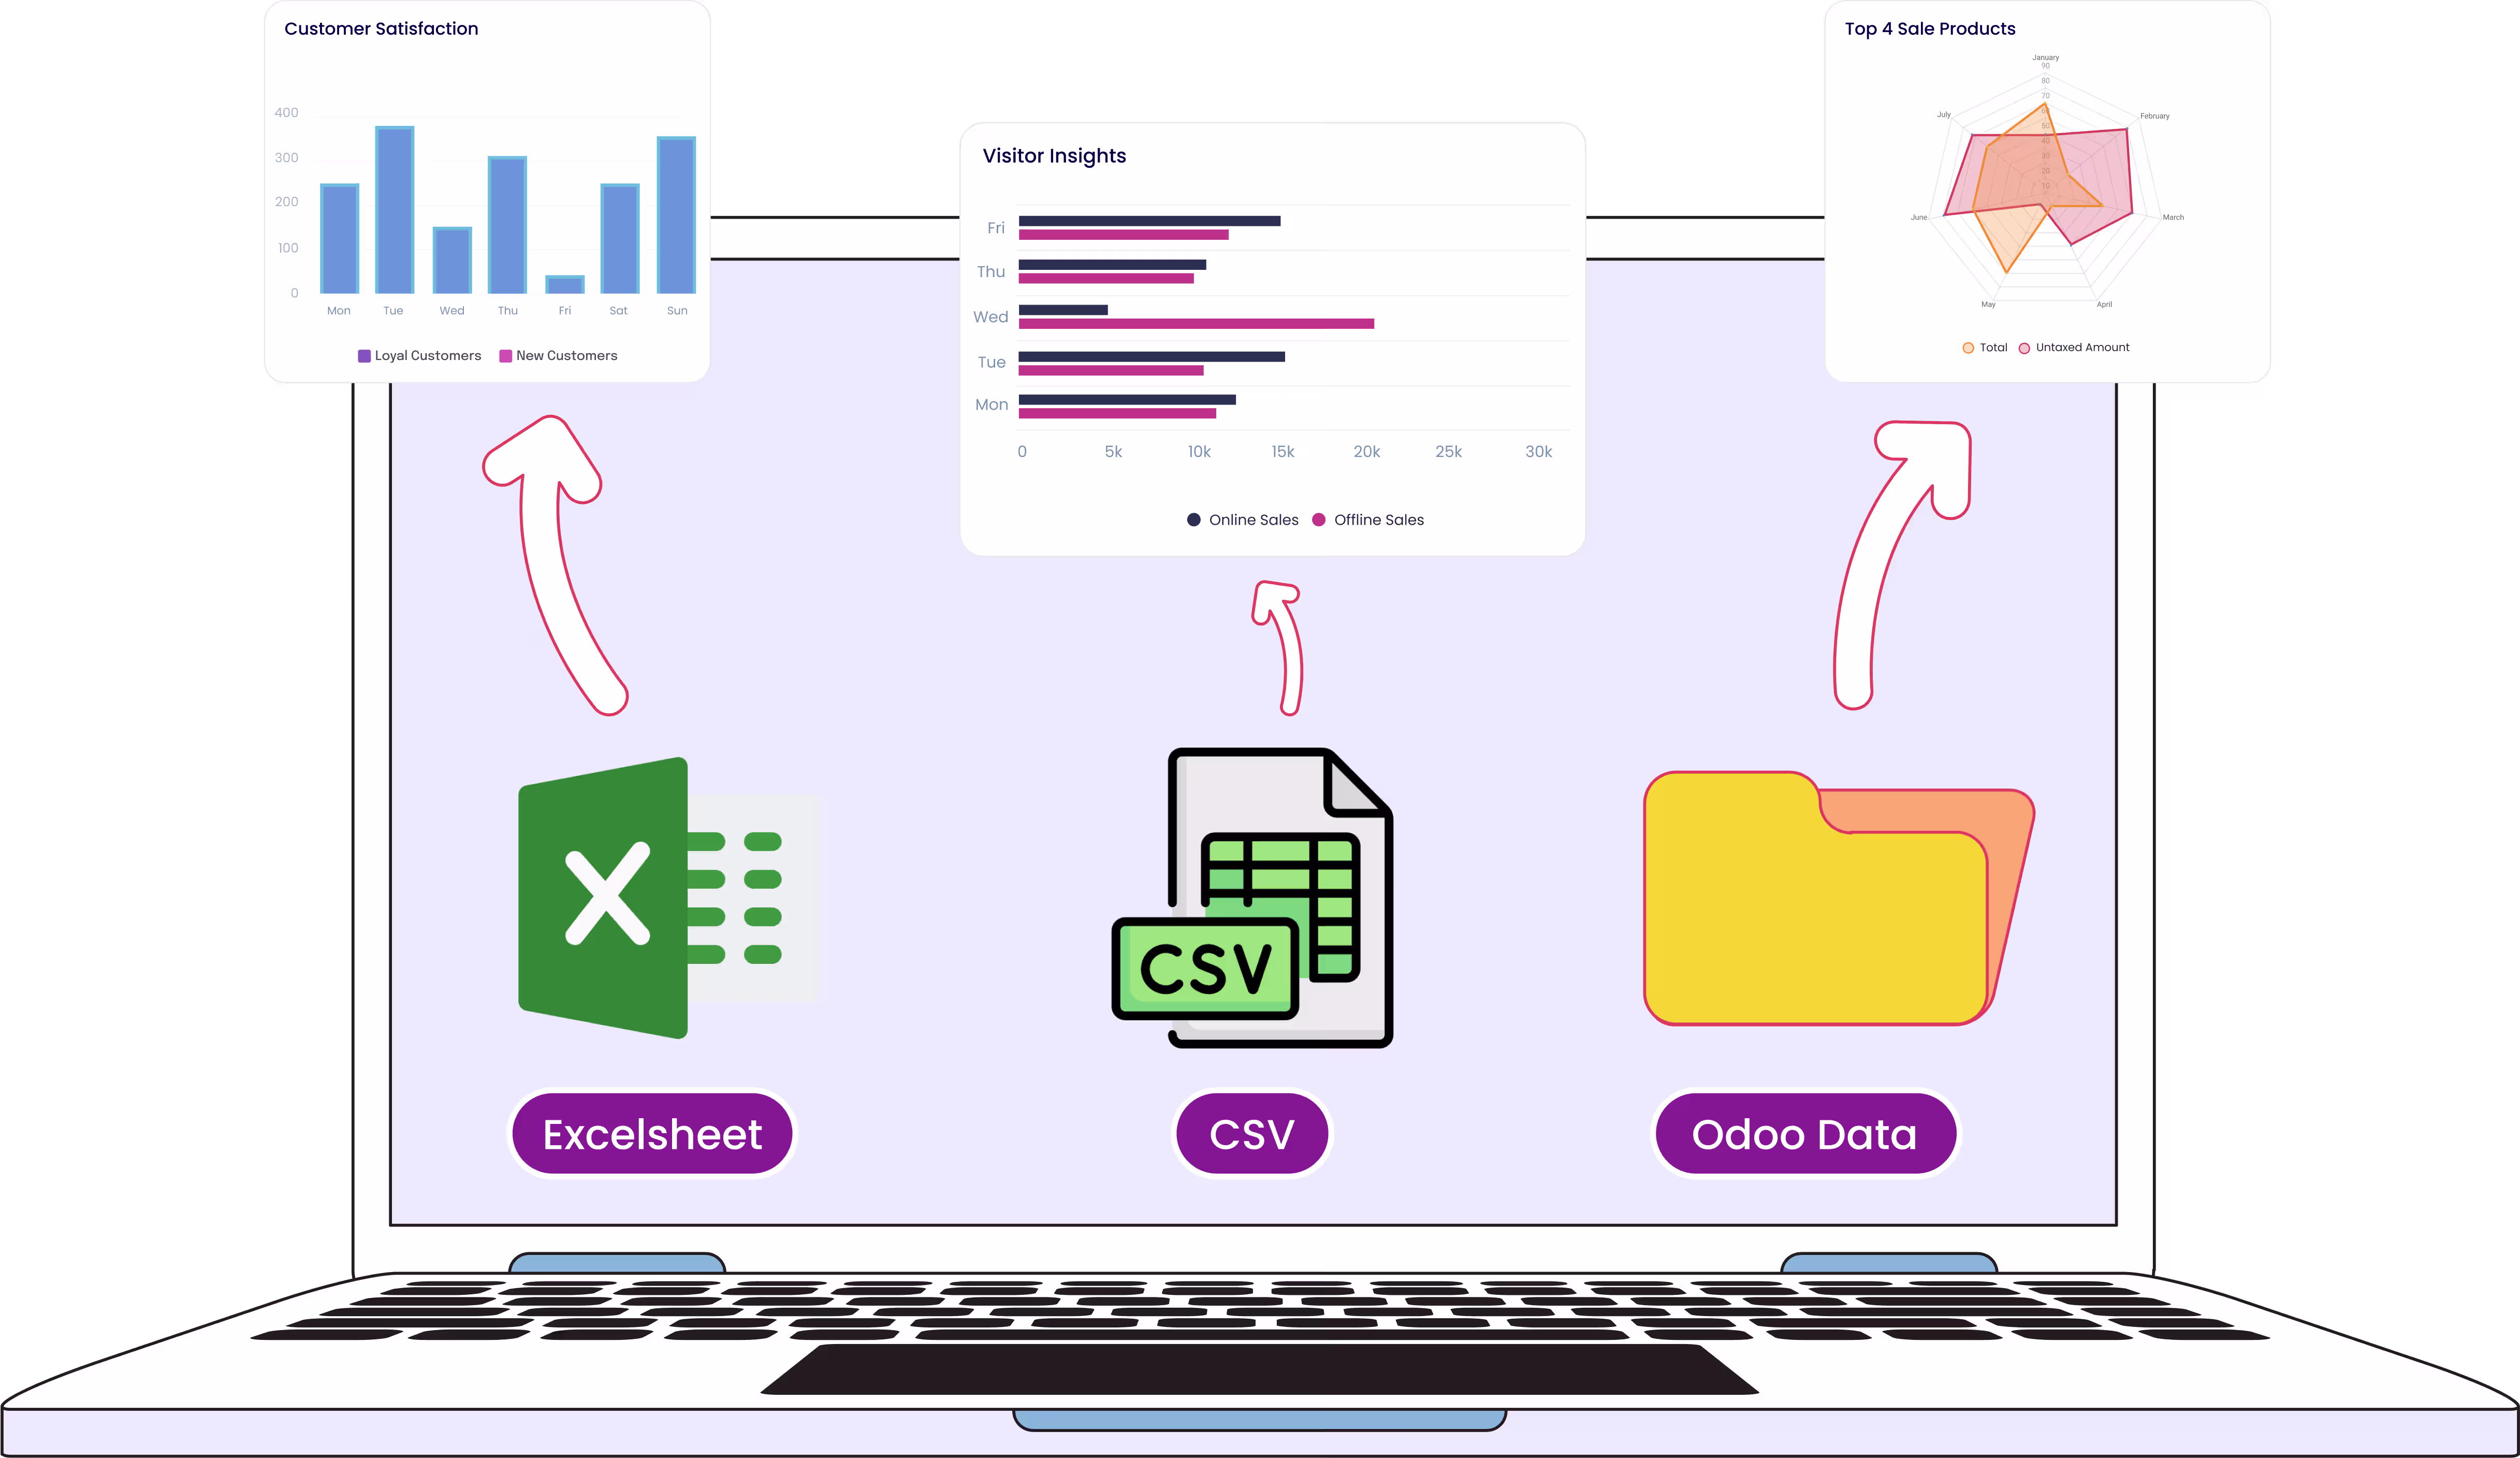
Create charts From Excel & CSV Files
Easily upload Excel or CSV files, and let the system automatically synchronize the data. It will then process the data and create charts.
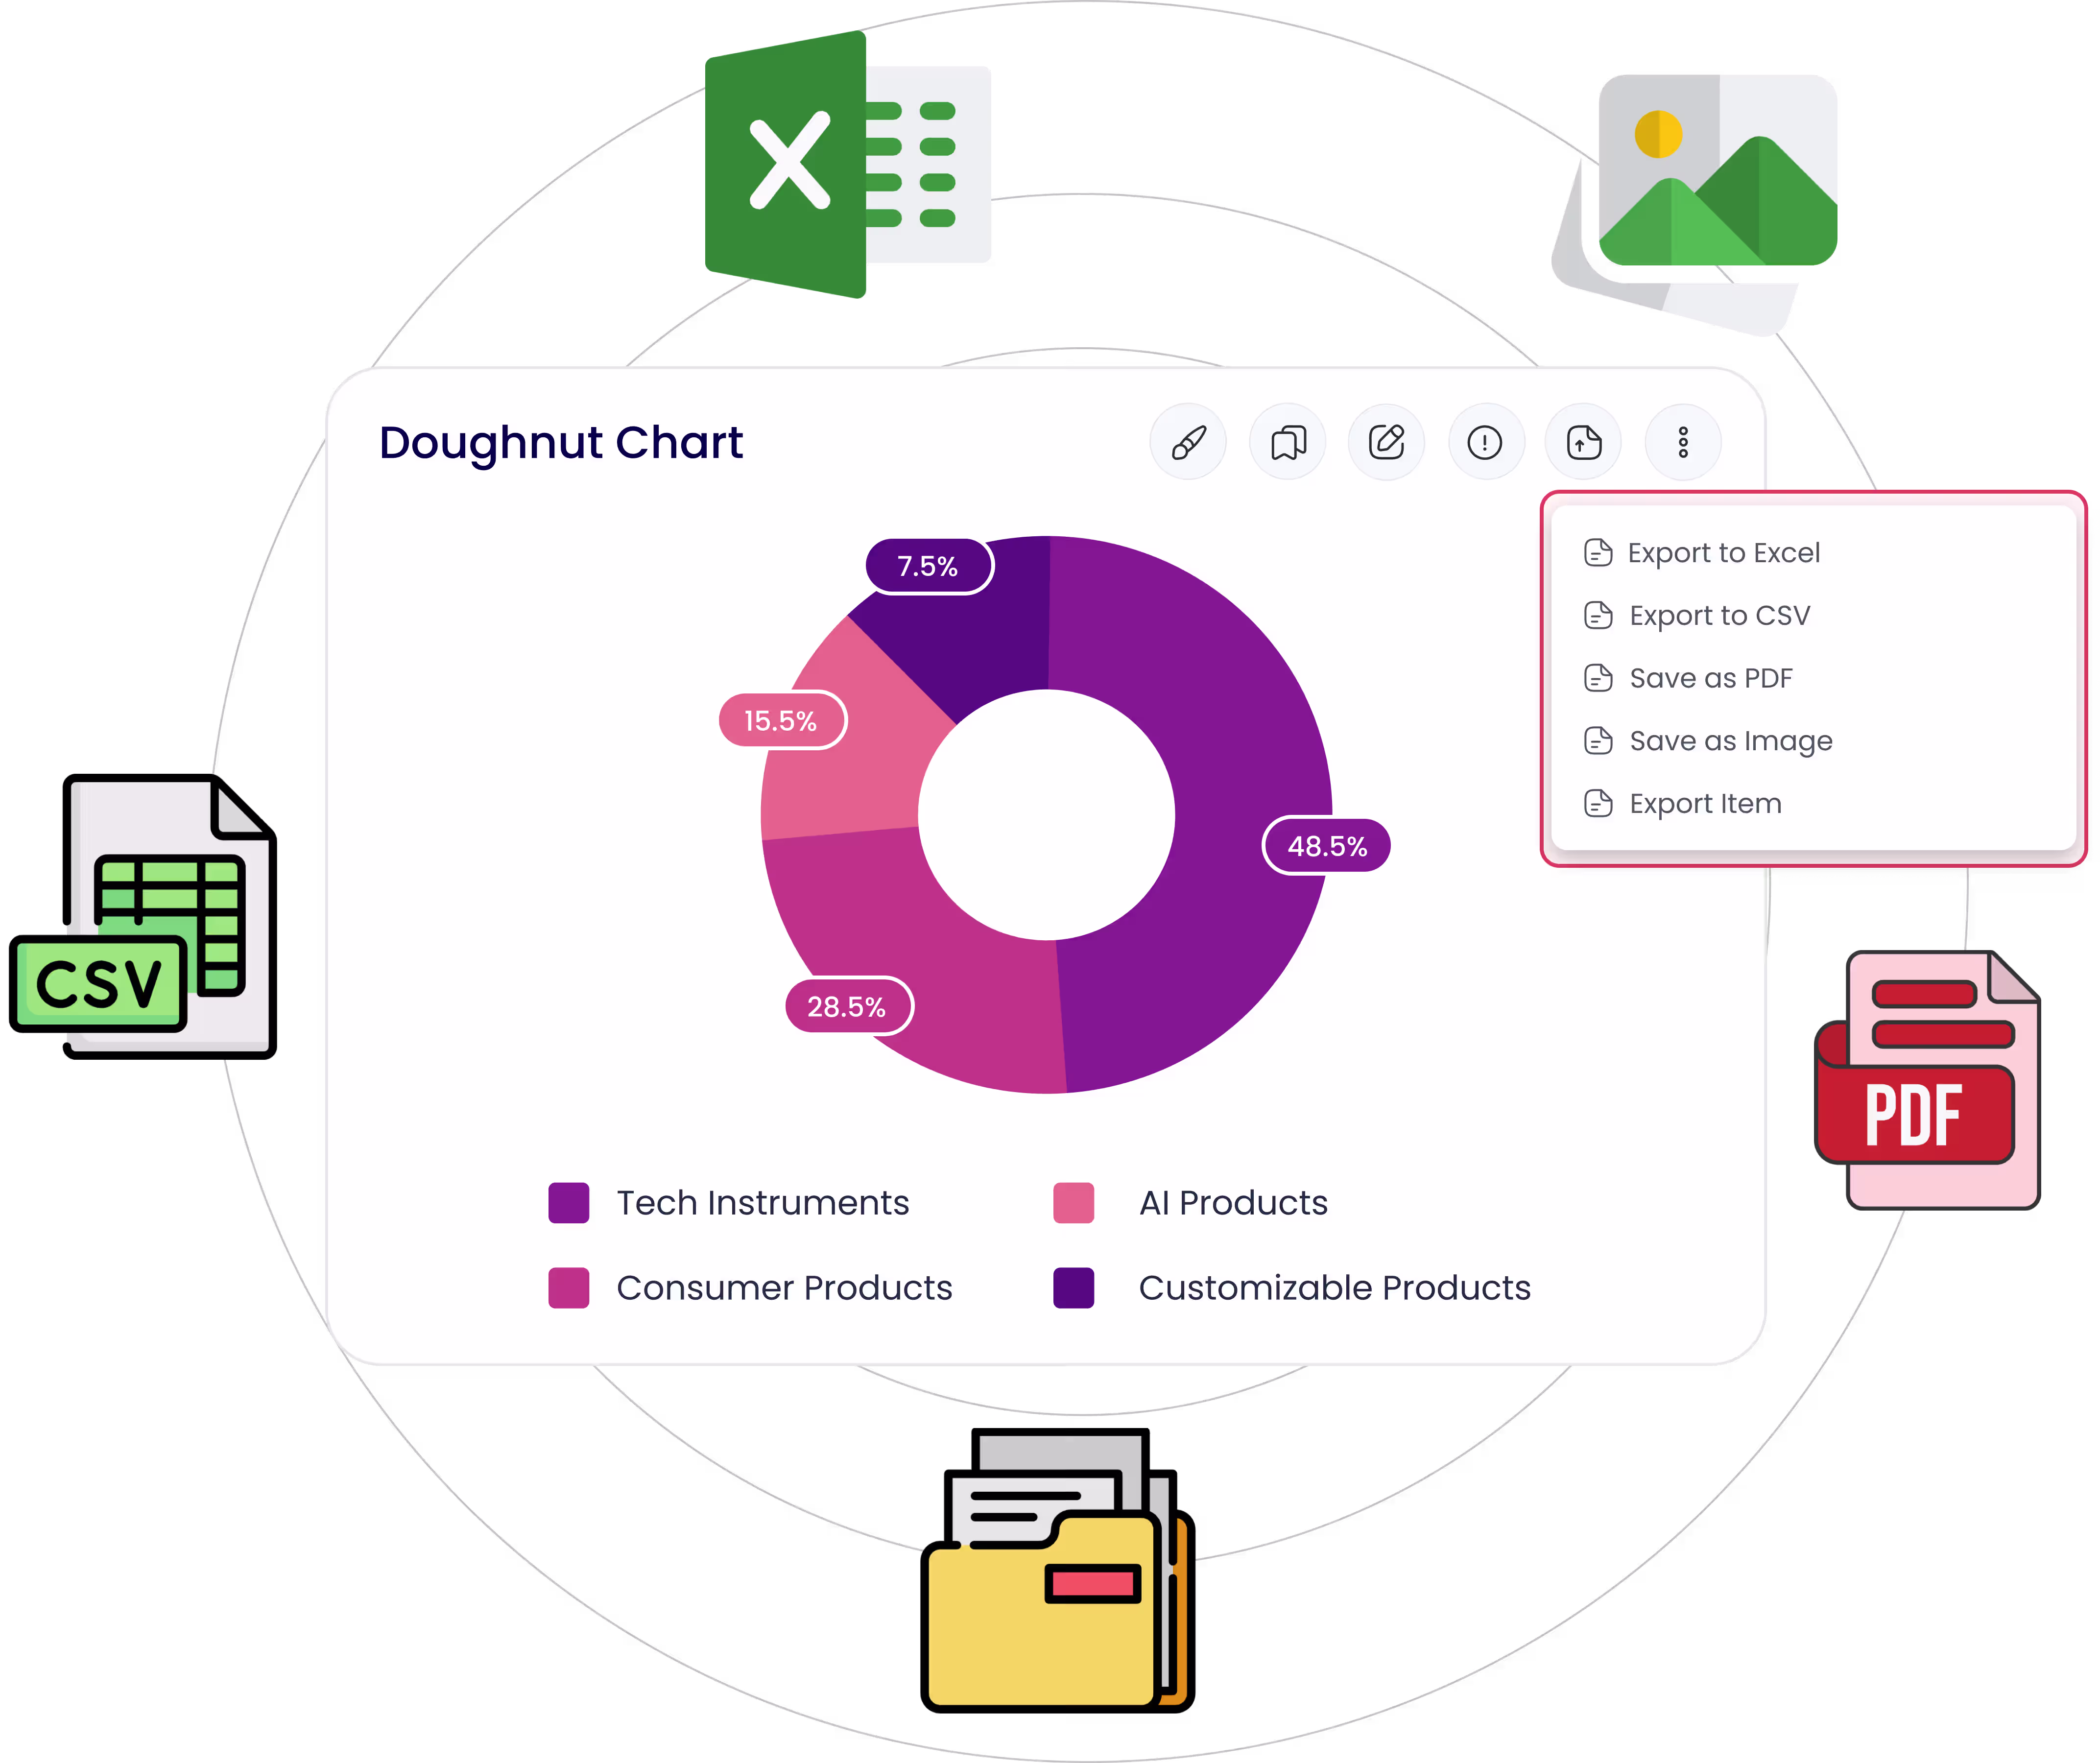
Download Onvodo® Dashboard Items (Excel, CSV, PDF, PNG)
Exported data items can be used for offline presentations, seminars, or emails.
Real-Time Streaming
Dashboard
Upgrades the data in real-time to give a 360 view of the business performance. This feature will update the data if any changes occur from the backend in real-time or after a specific interval of time.
Drill Down / Drill Up Data
Modify the degree of details presented in a dashboard entity. Drill-down to access detailed data or drill-up to get a broader view of information.
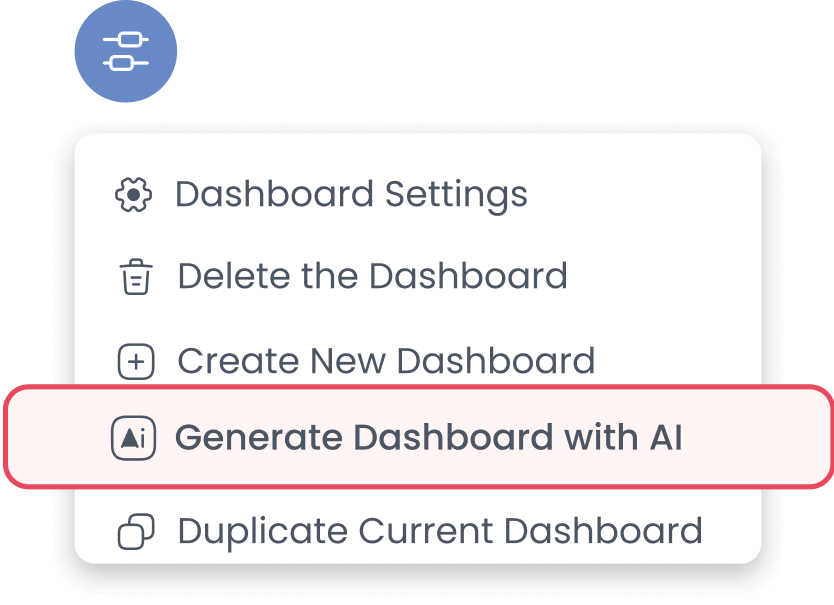
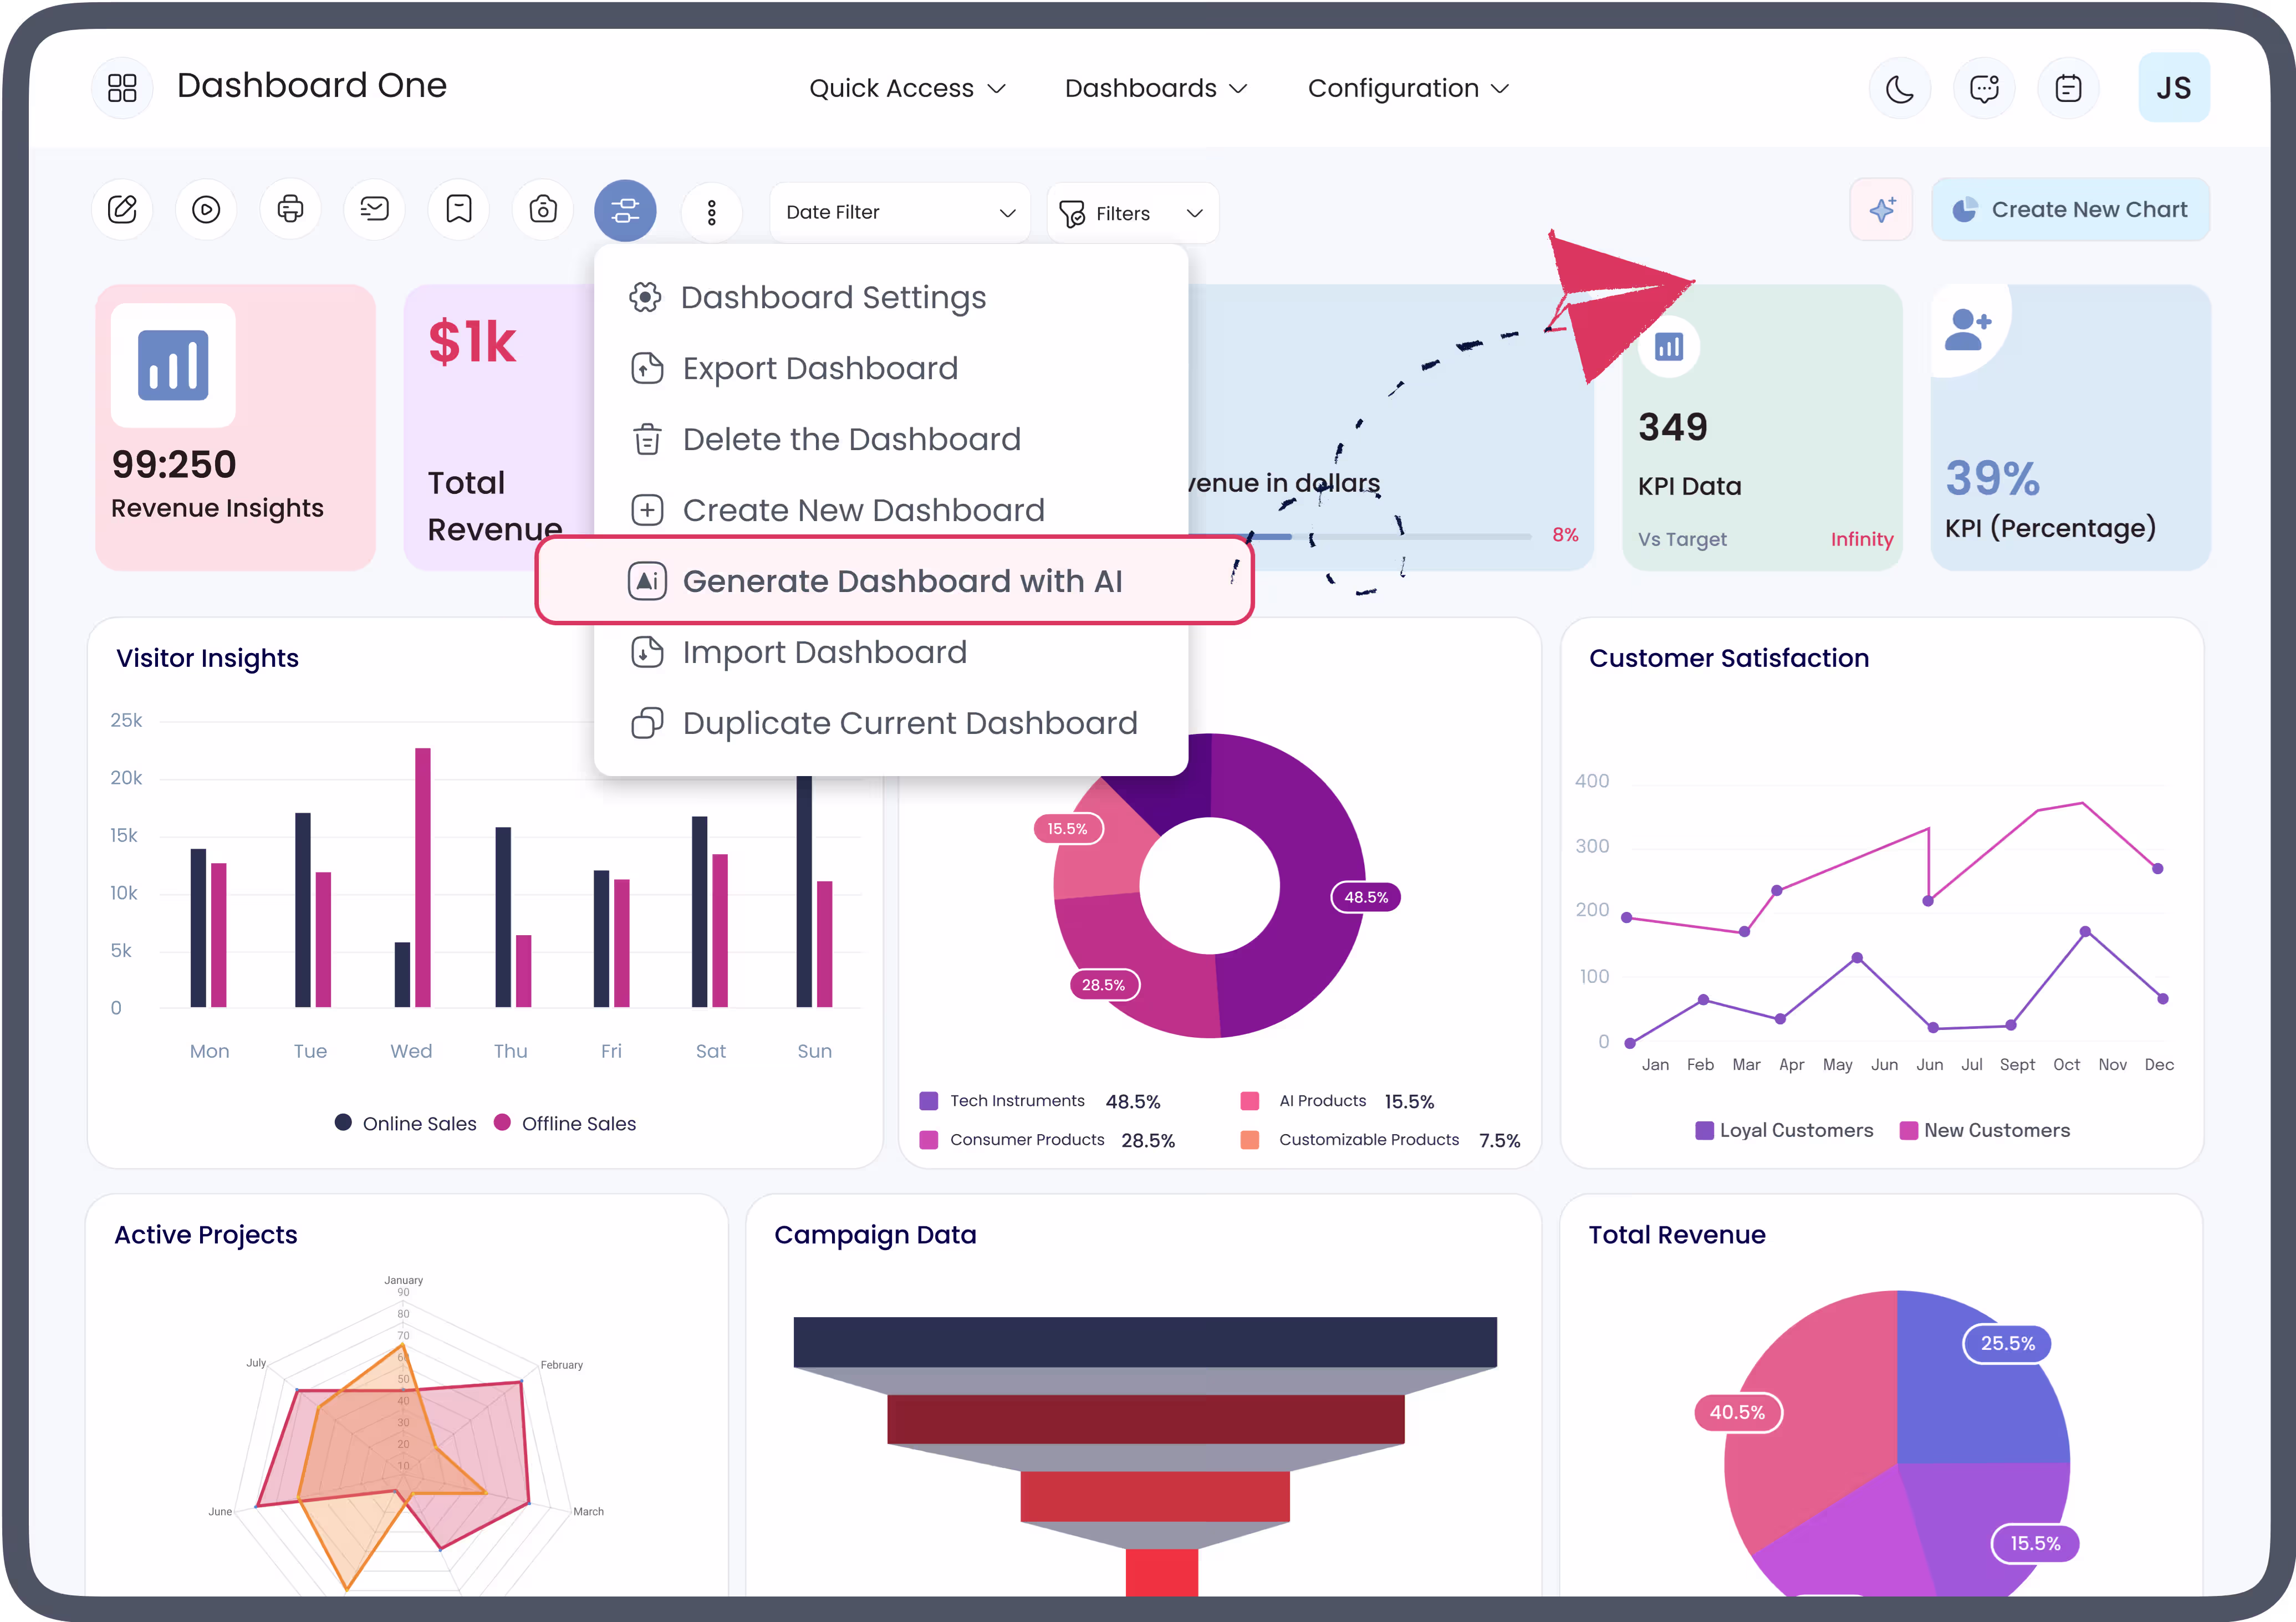
Generate Complete Onvodo® Dashboard with AI
Save your time and effort! Generate a complete Onvodo®
Dashboard
a specific model within a few clicks with AI efficiency.
Export & Import Dashboards or
Specific Onvodo® Dashboard Items
Export an entire Onvodo® Dashboard or Specific Onvodo® Dashboard
Item to a same system or
different Onvodo® instances for saving time and effort while
migrating from one system to another.
Paid Predefined Dashboards
5 Predefined Onvodo® dashboards are provided for different
verticals of a
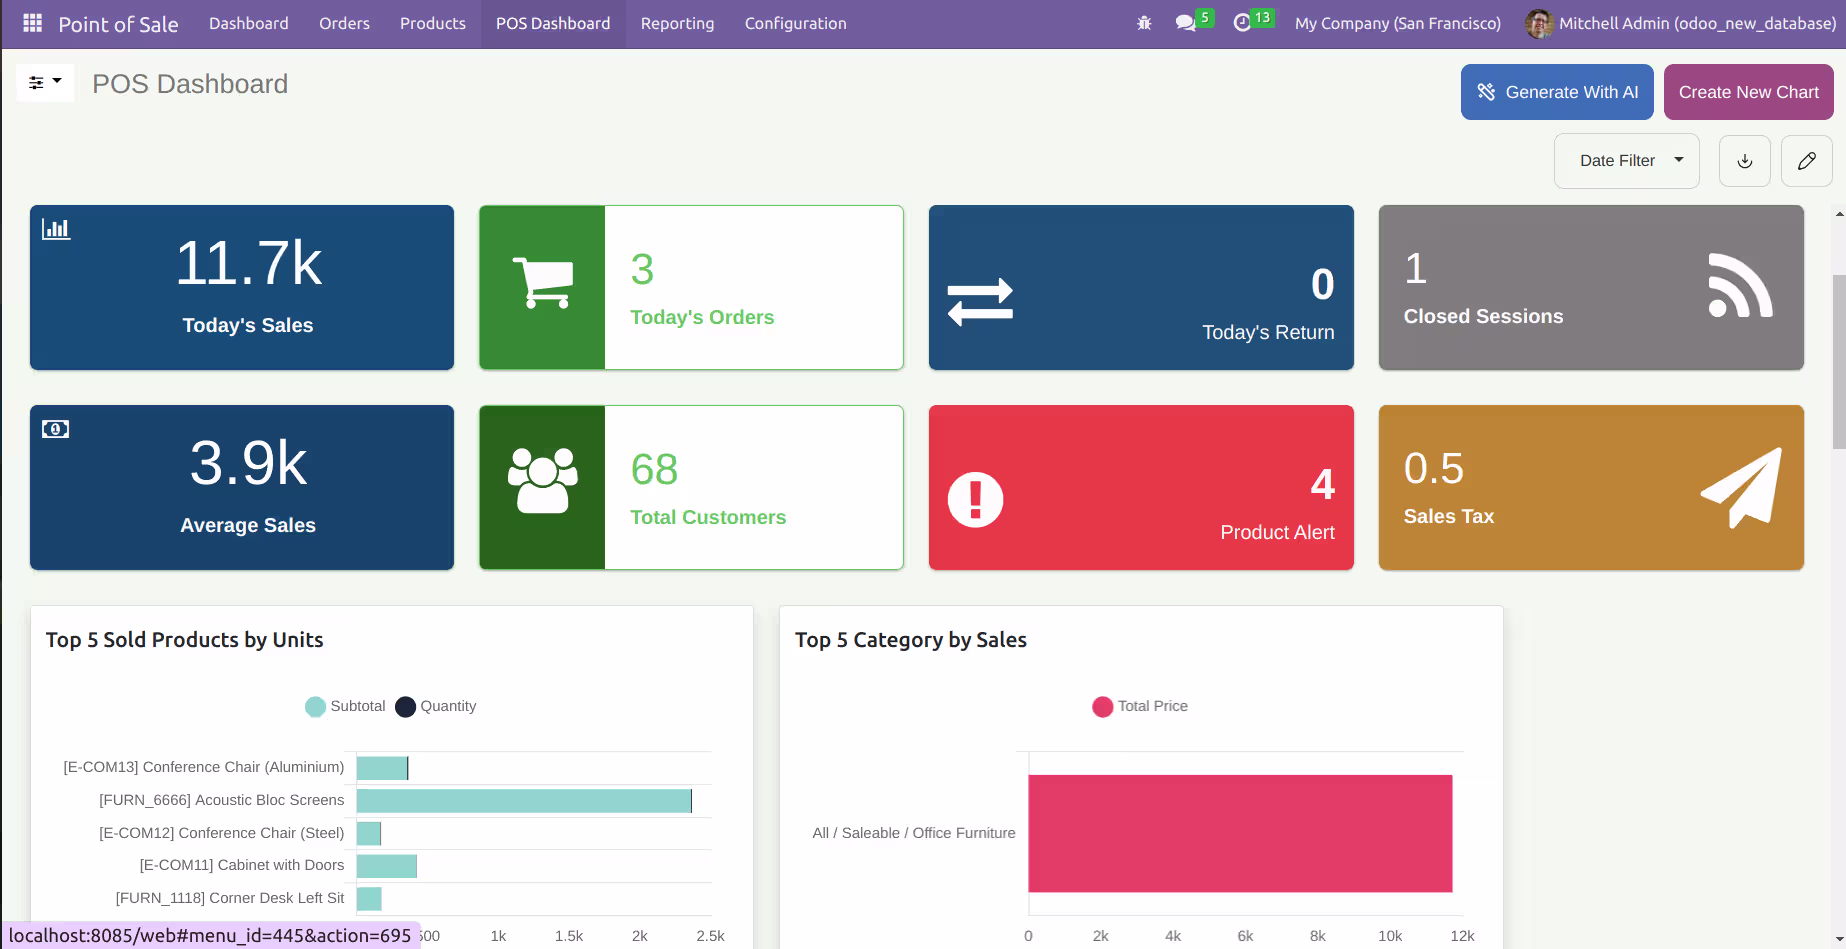
company(Sales, CRM, Account, Inventory, & POS).
Customize them as per your need.
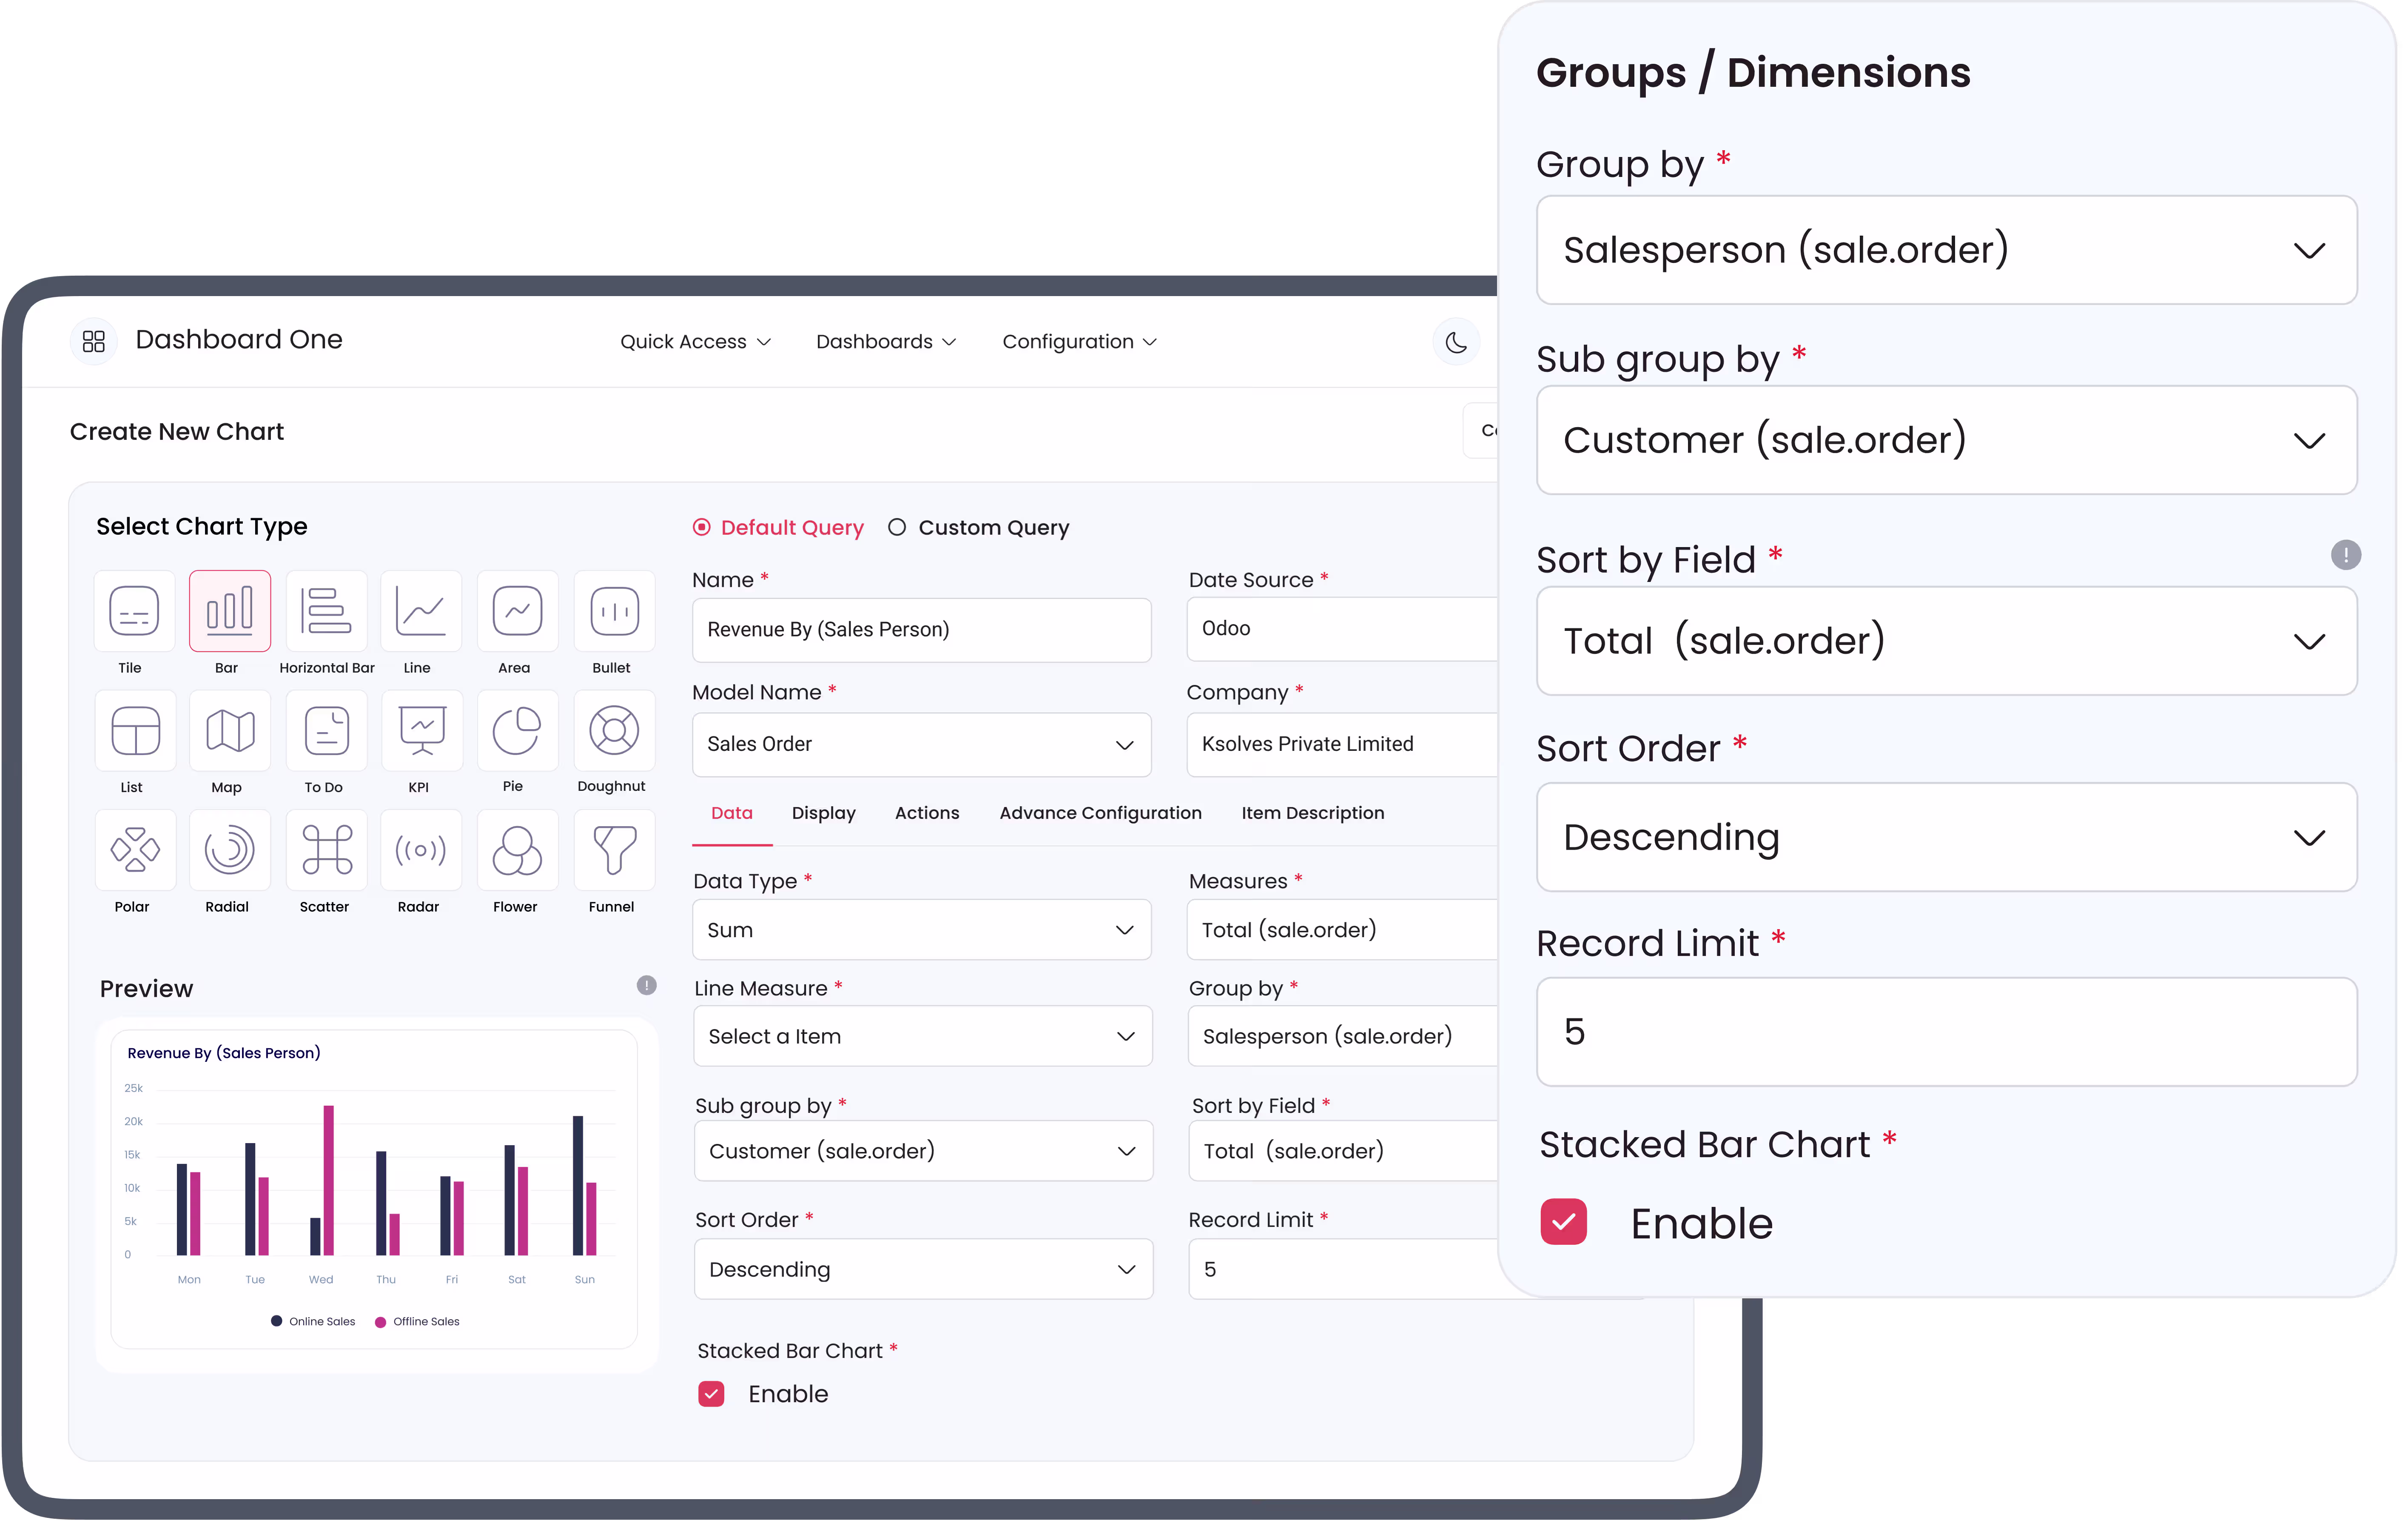
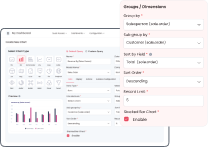
Data Filtration - Group By, Limit & Sort By
Group By, Sort By, Limit, filter condition to get desired data for any dashboard item as per your requirement.
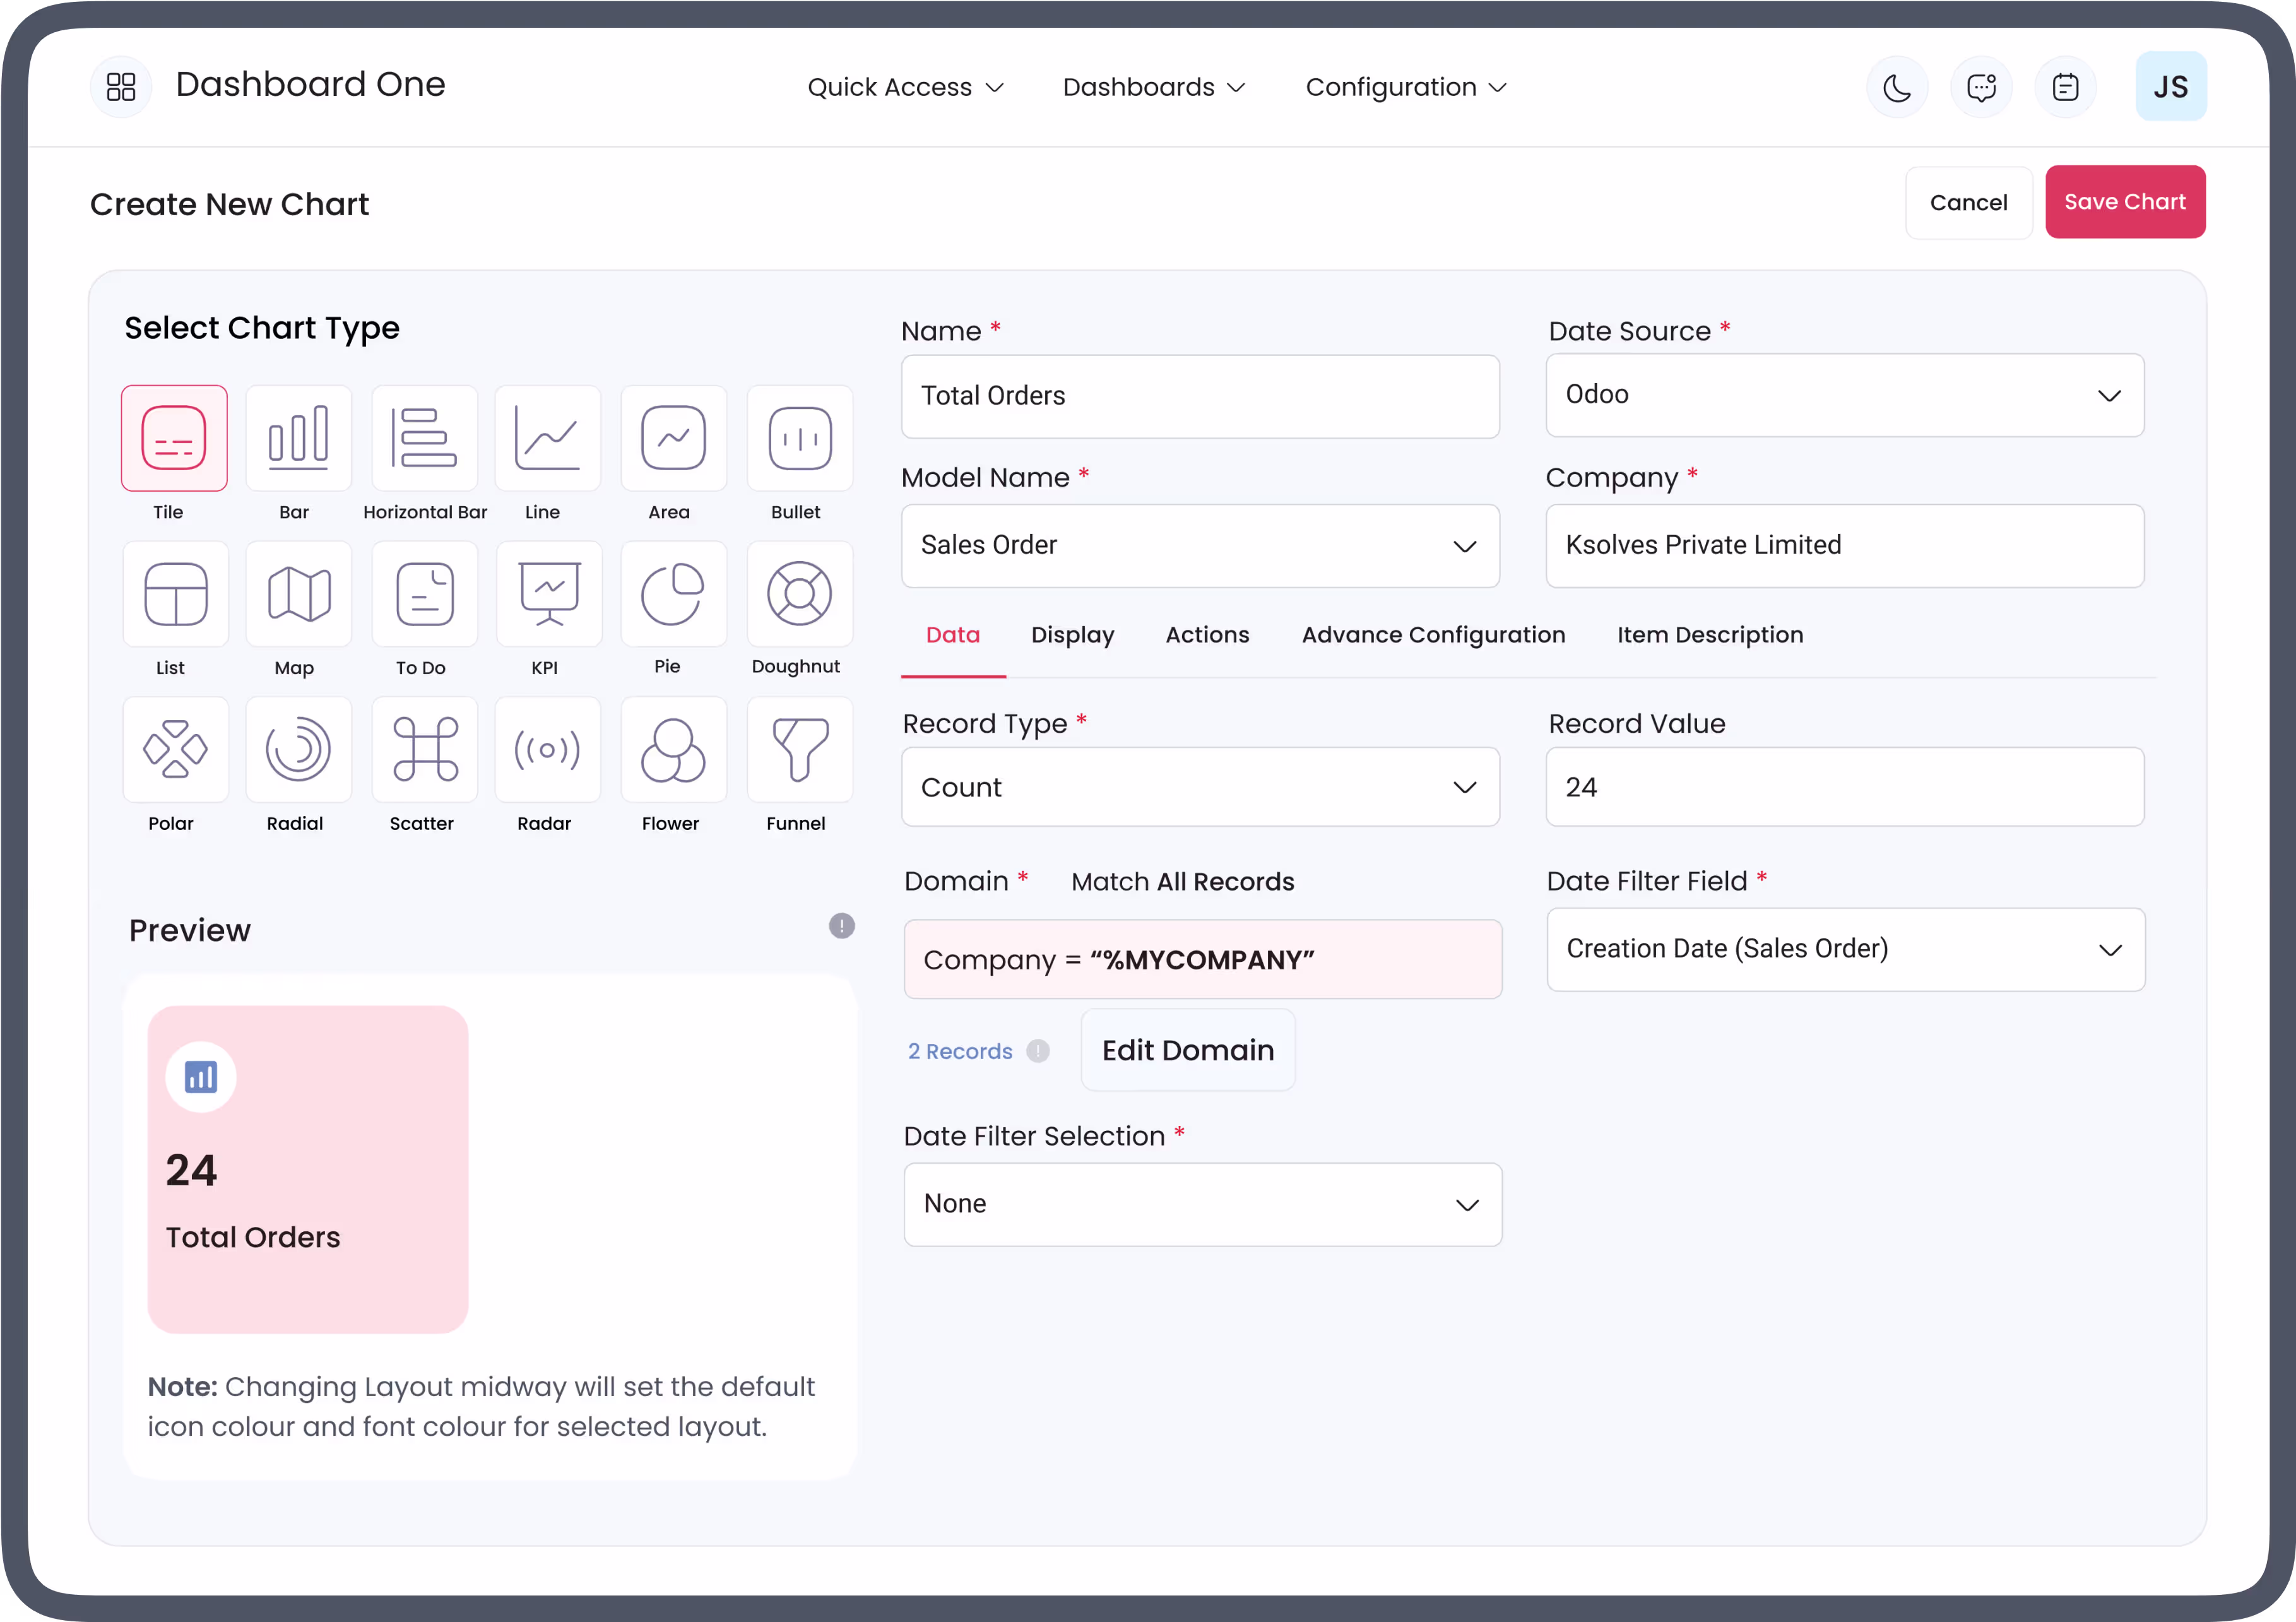
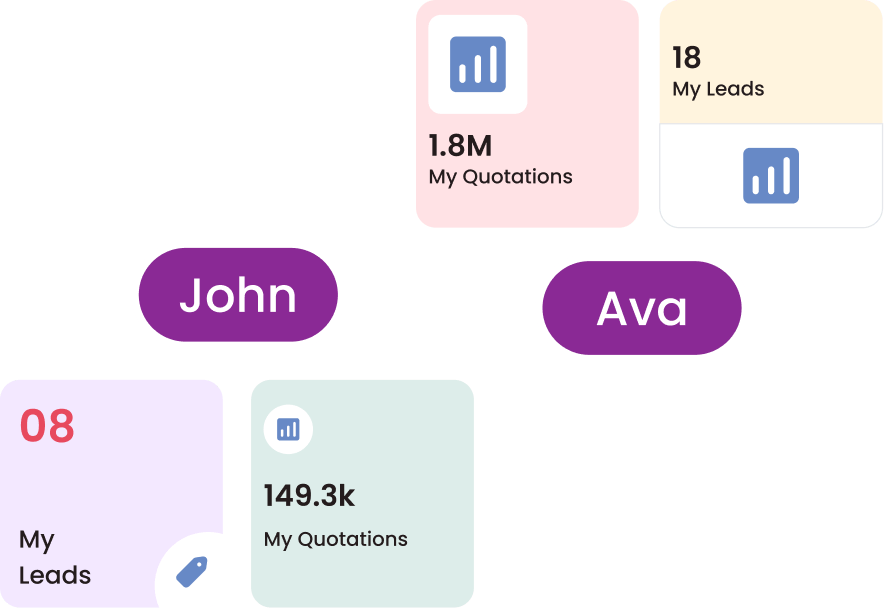
Authentic %MYCOMPANY Filter
Get company-oriented details by filtering the logged-in user data using this dynamic filter.

Unique User ID (%UID)
Filter logged-in user data using %UID in domain filter to see the results related to the logged-in user.
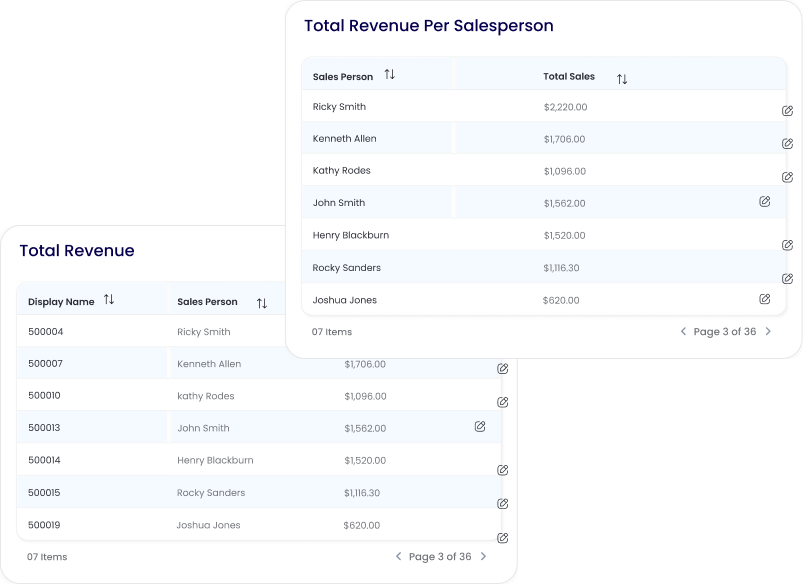
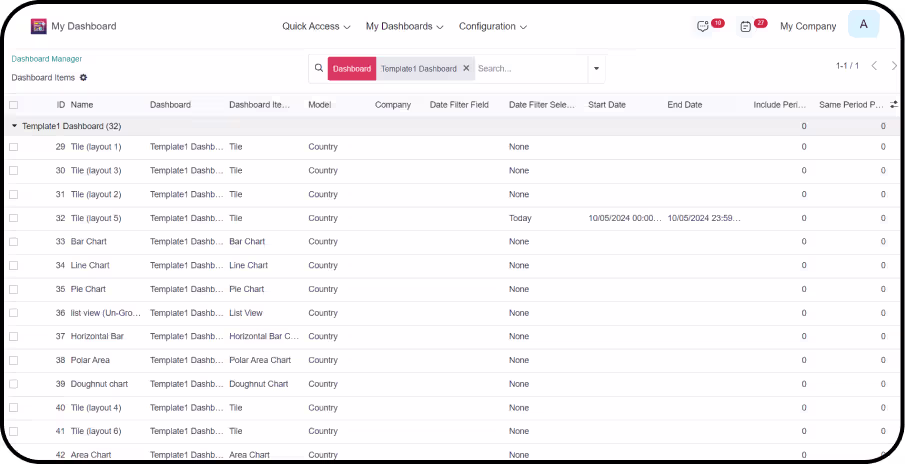
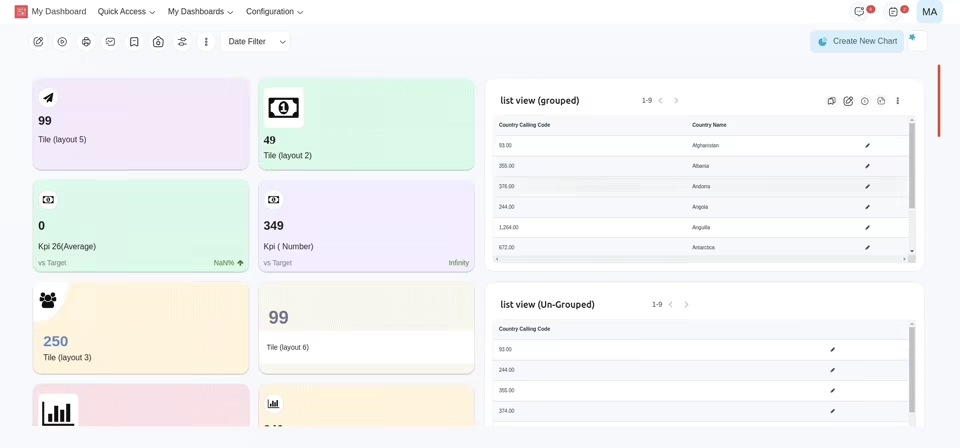
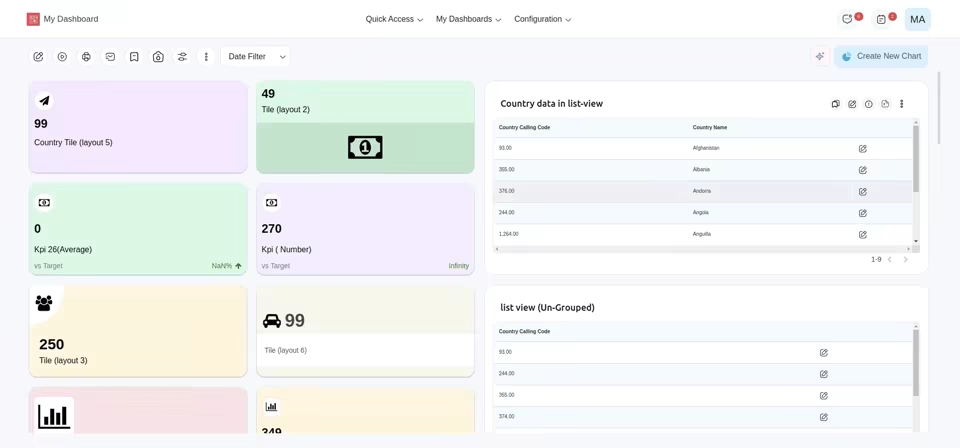
Dashboard Item 2 List View Styles
Use the list-view item to view multi-value data sets in a grouped or ungrouped manner. Example: To see the total sales, average sales, total quotations of the top 10 sales persons.
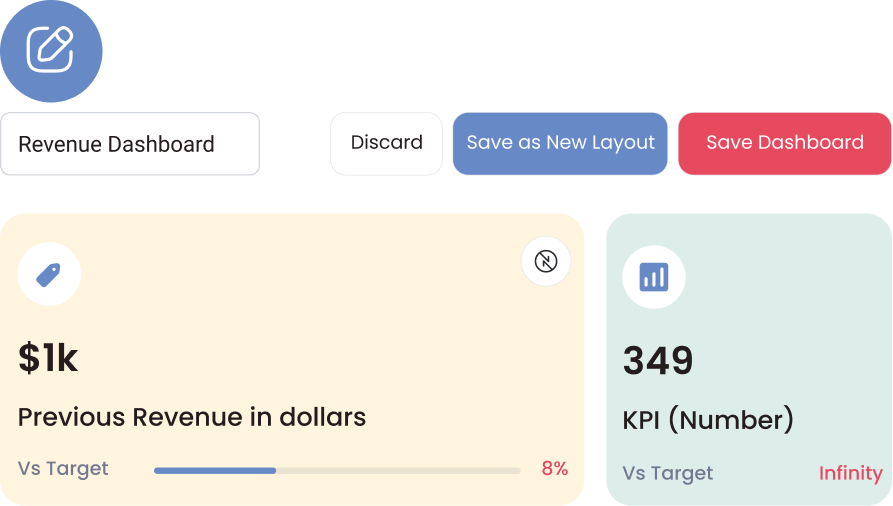
Design Your Own Dashboard Layout
Design your dashboard layouts by resizing, dragging,
repositioning the dashboard
items, and renaming the dashboard heading for arranging
all items as per your need.
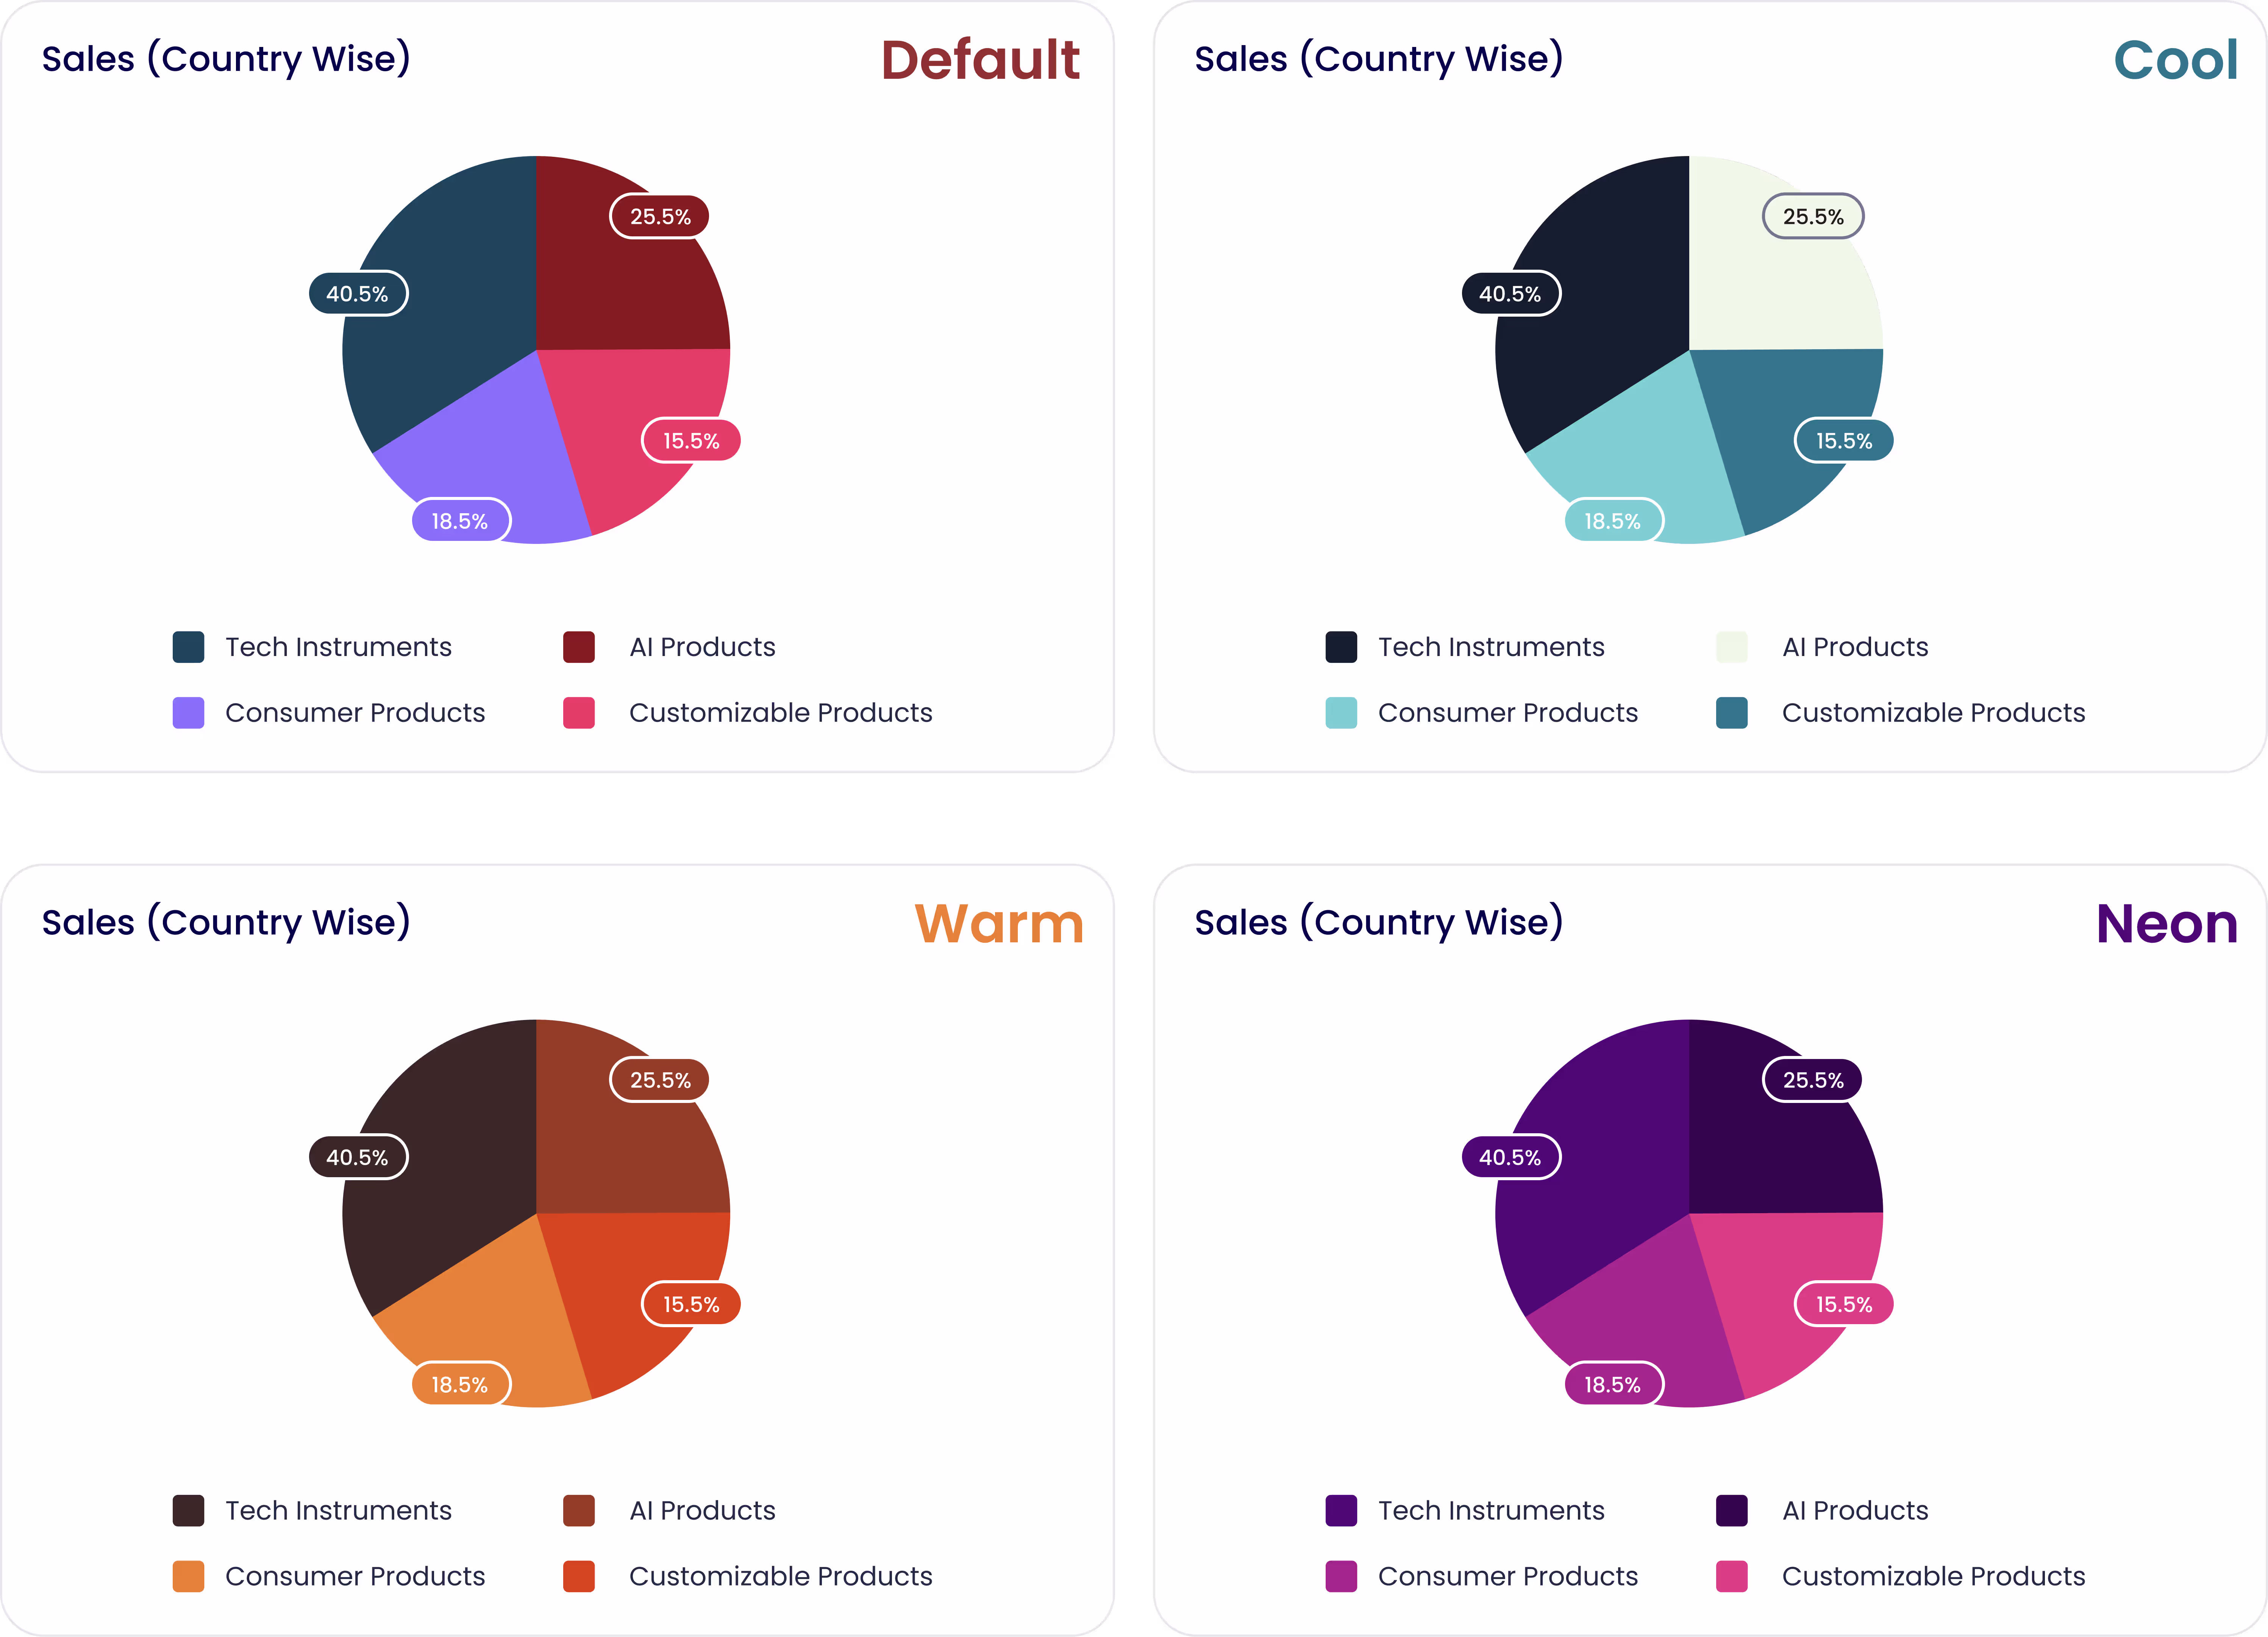
Multi - Color Themes
Beautiful, interactive, and outstanding multi-colored themes can be added to your dashboard.
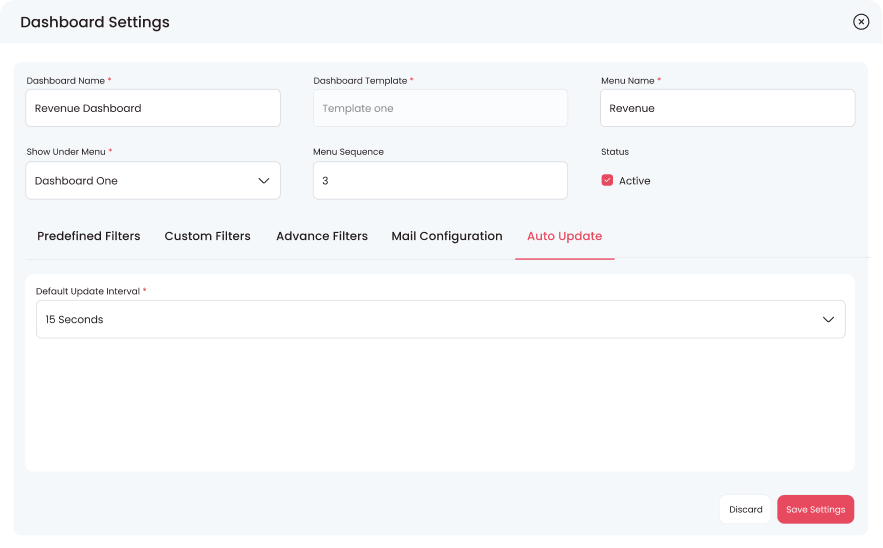
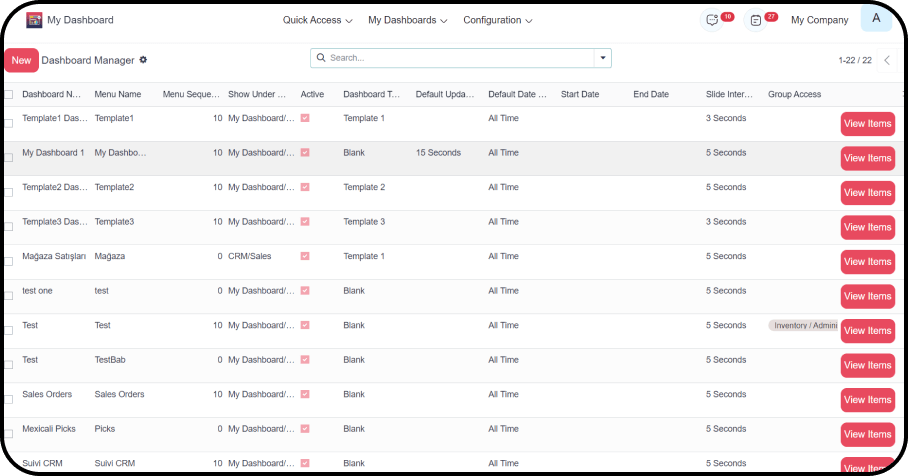
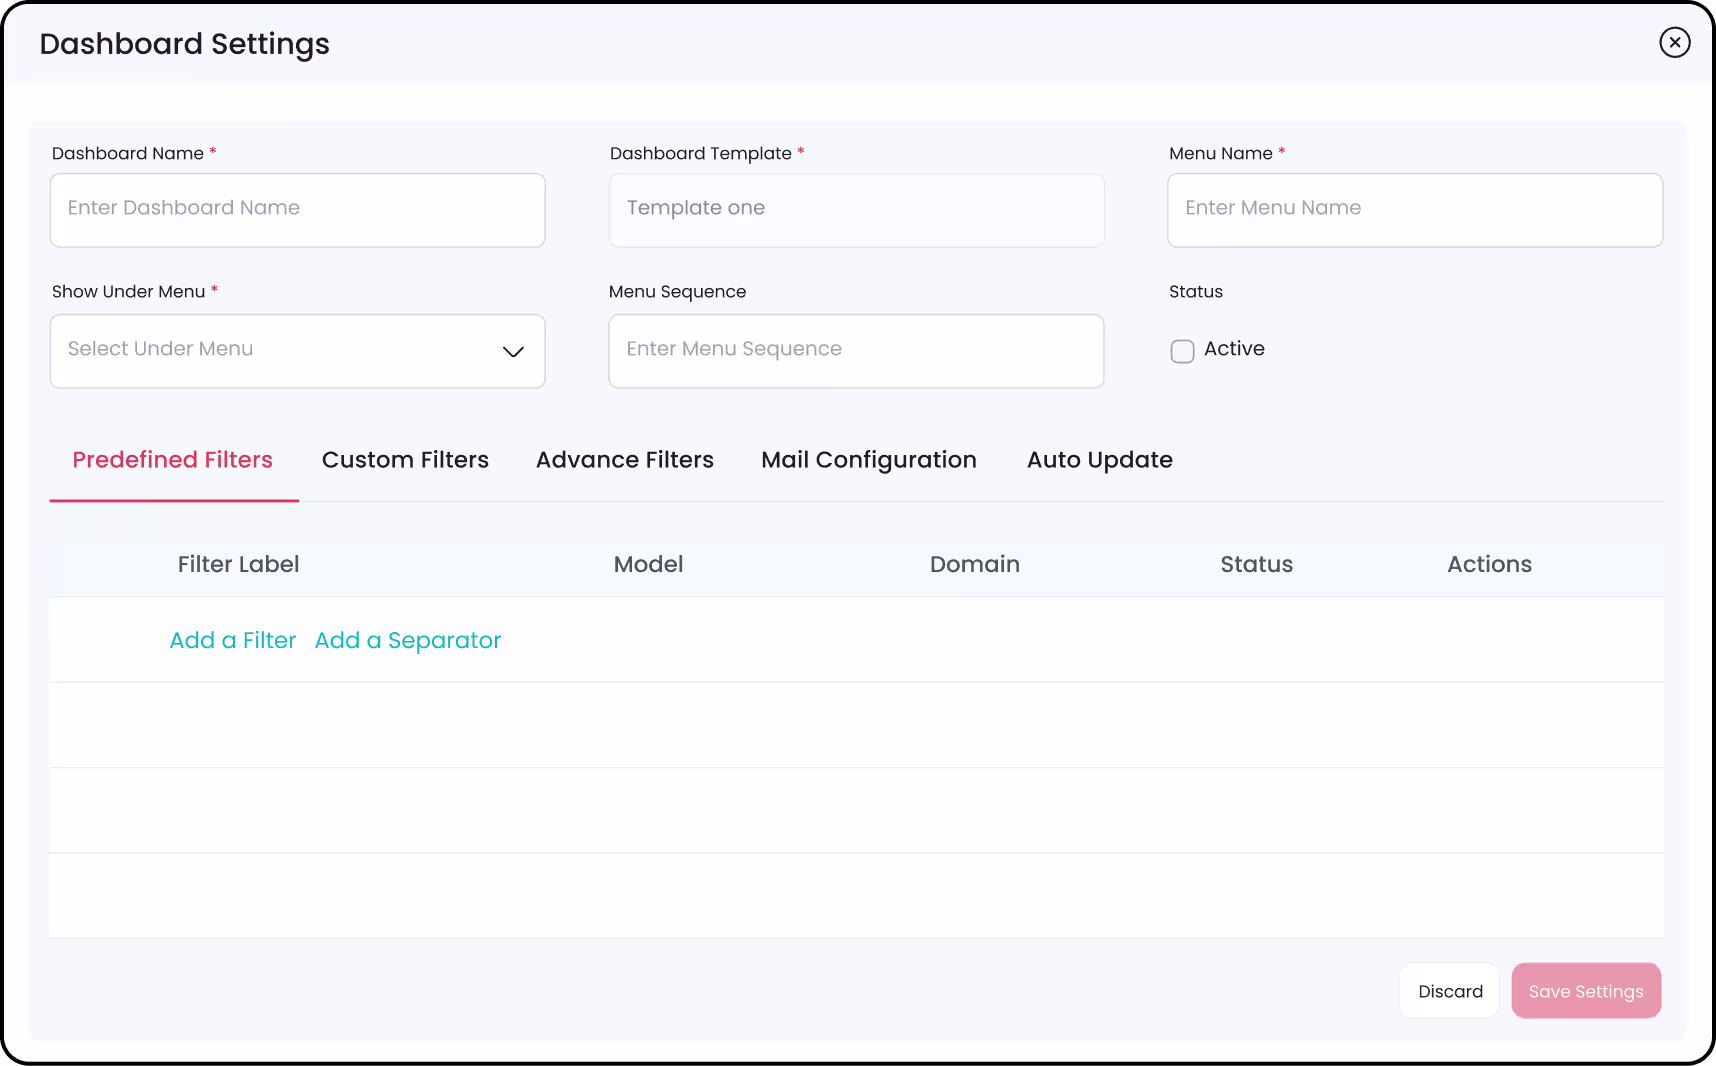
Dashboard Personalization/Configuration
Configure the dashboard name, menu, group access, choose
the sequence,
and more while creating interactive presentable dashboards
for your business.
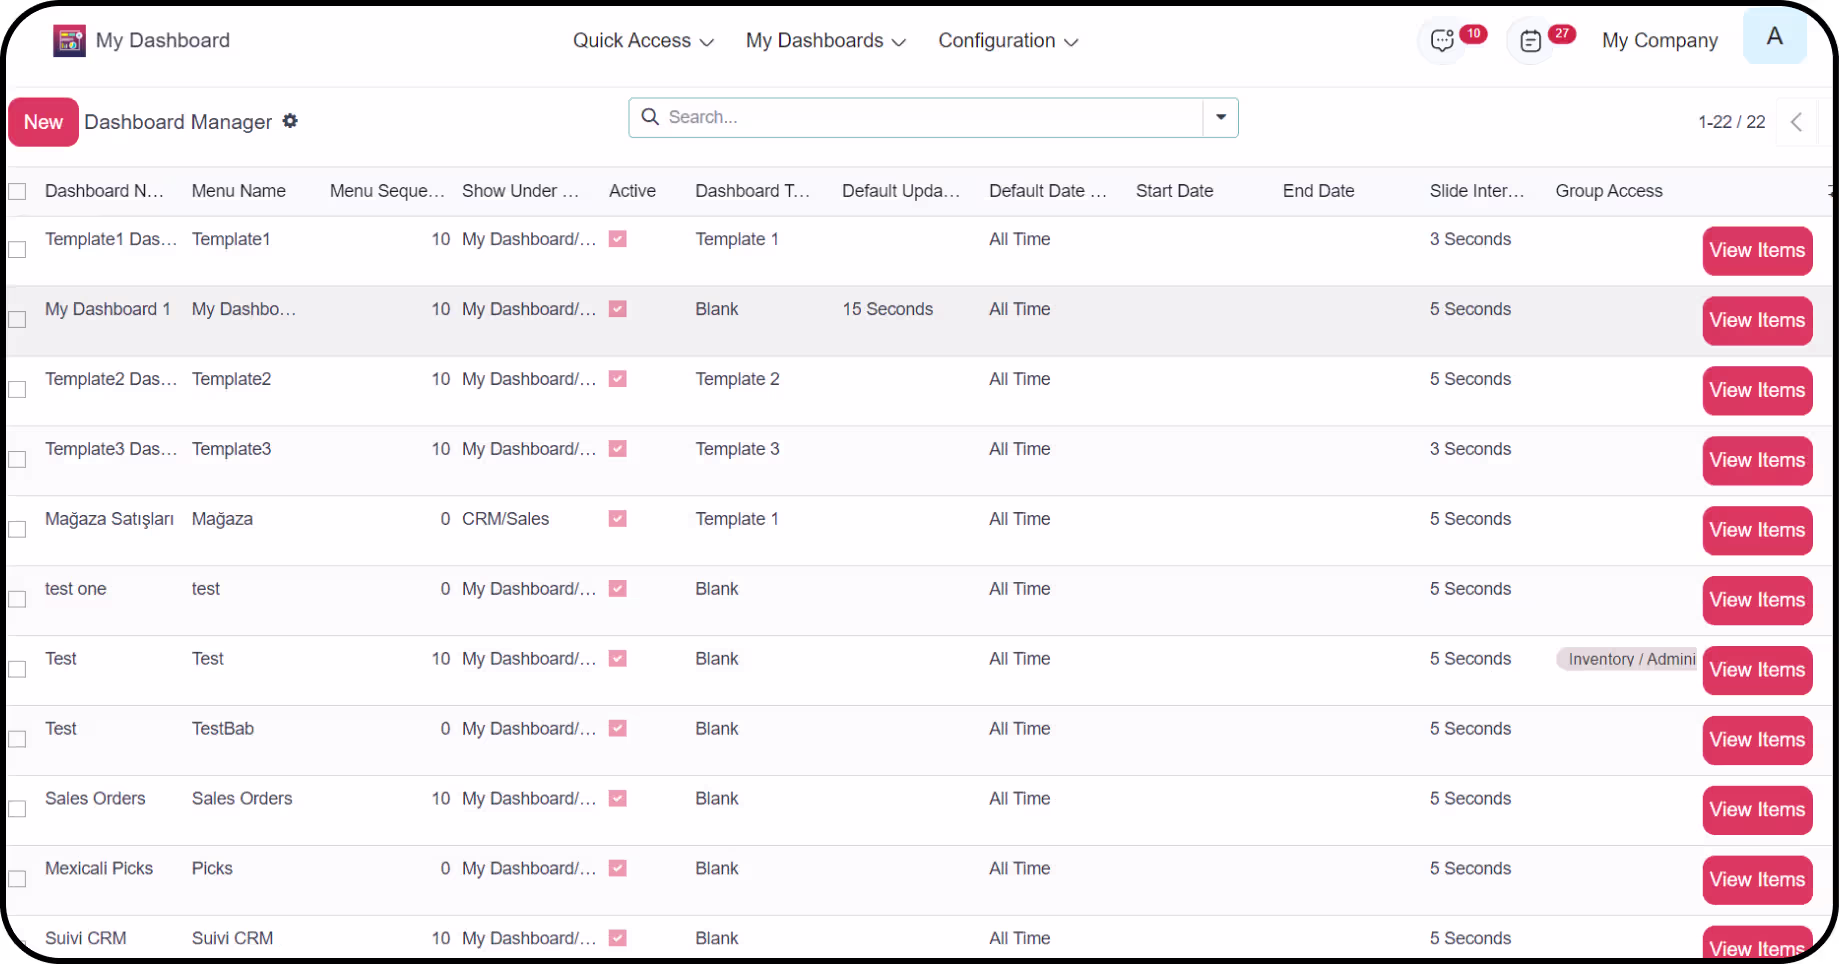
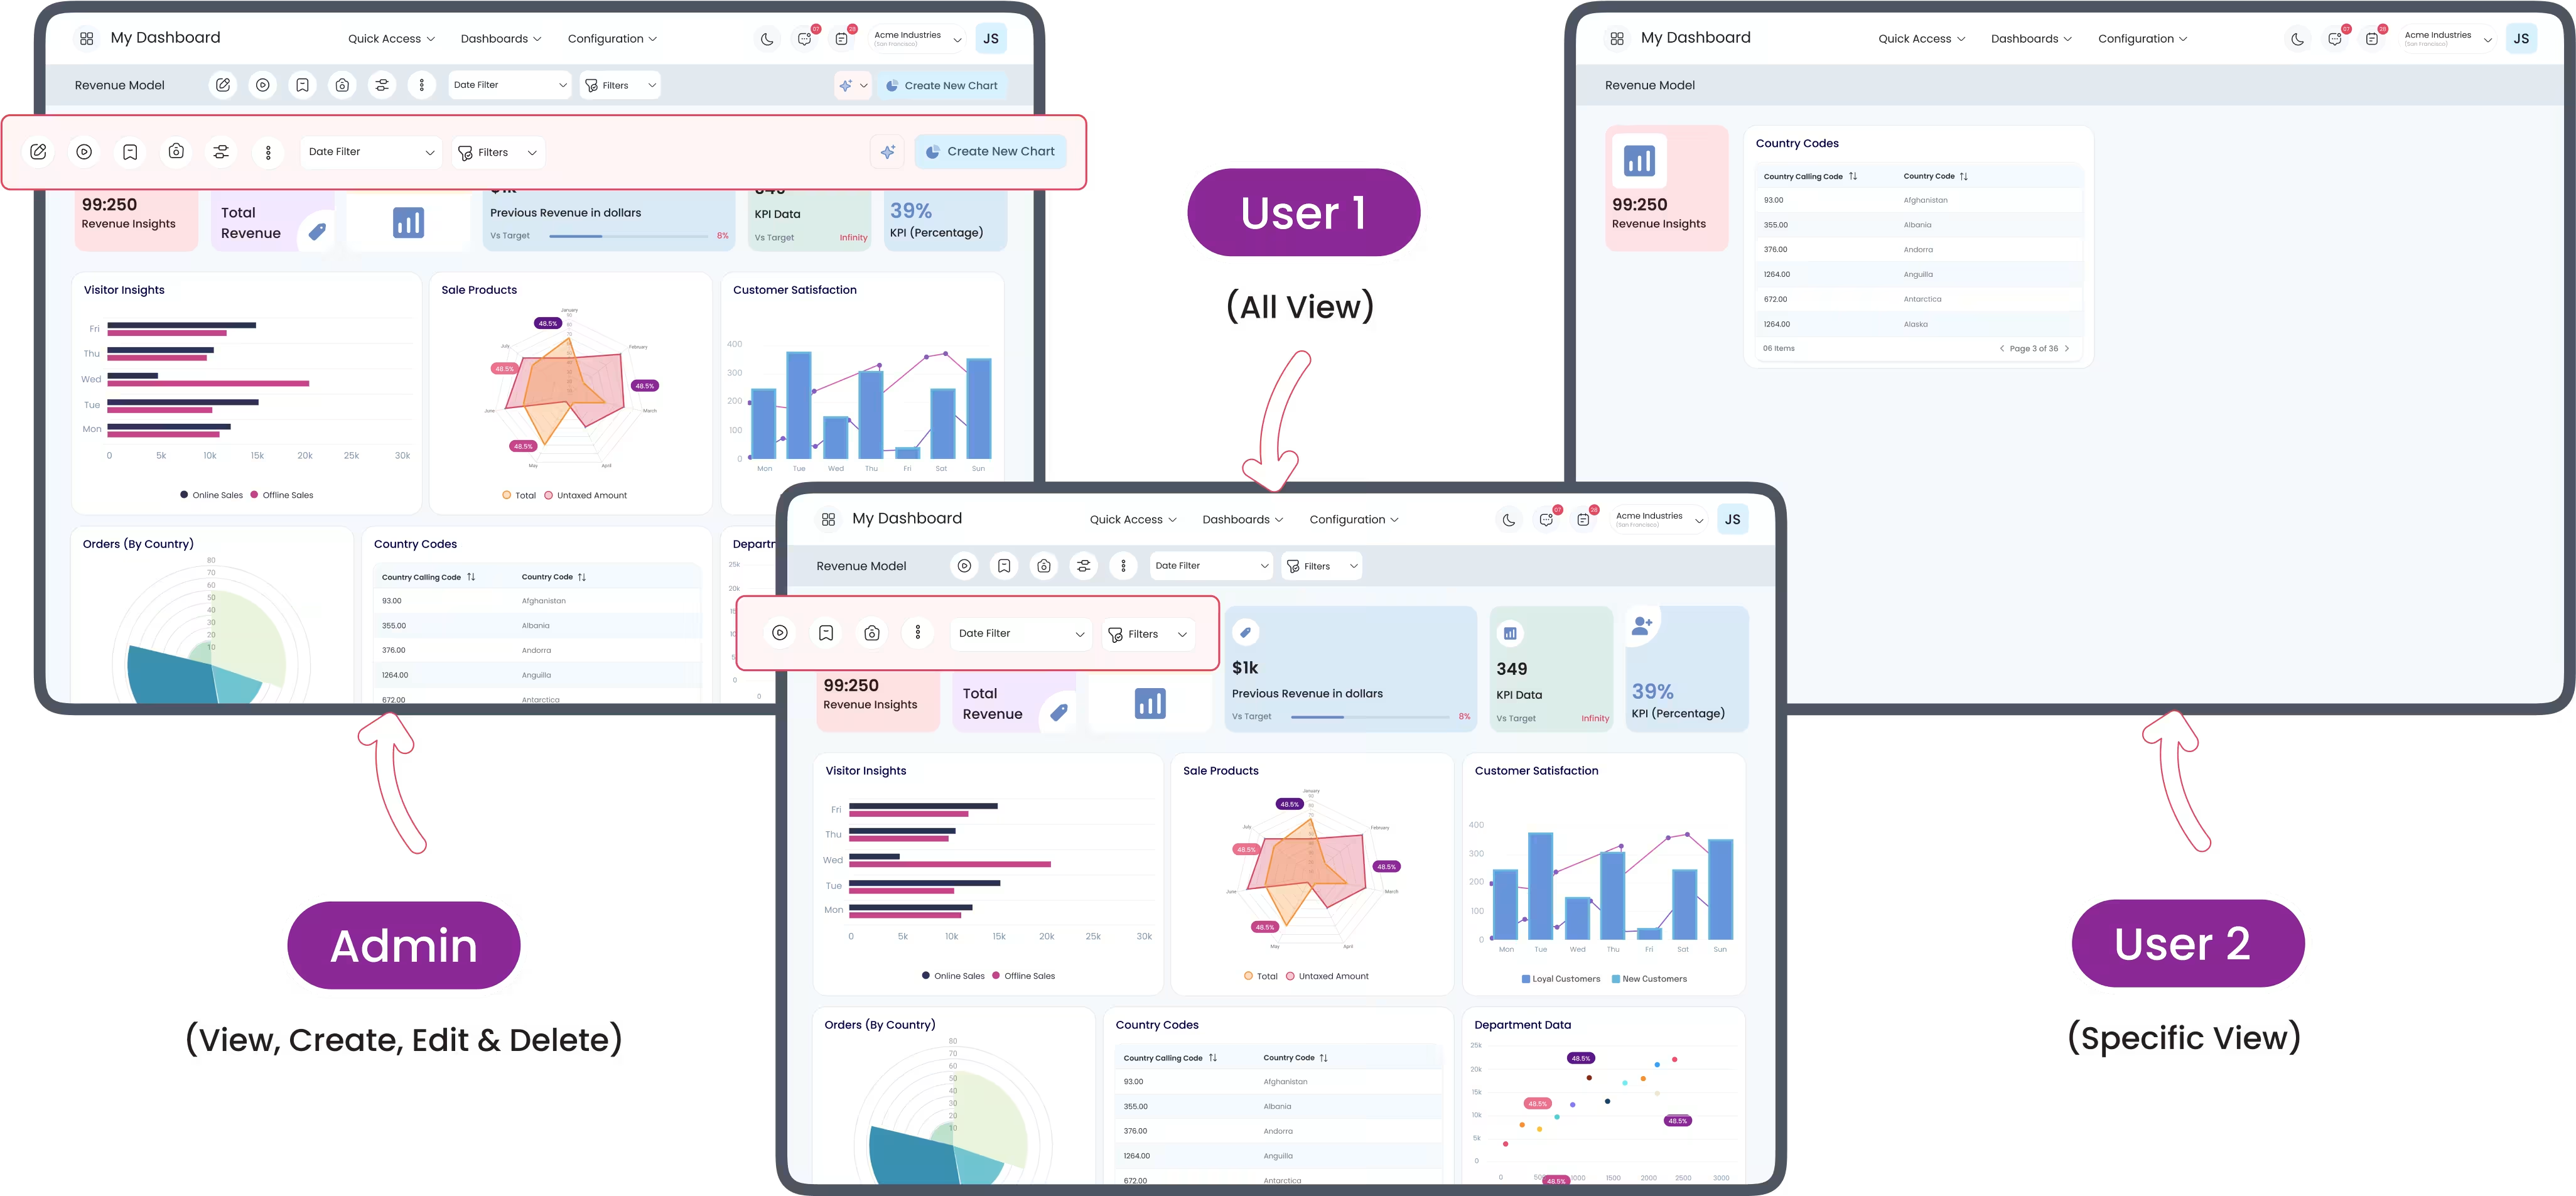
Access Control
Control who can access the Onvodo® dashboard with a single click for robust security.
Instant Edit Mode
A user can edit the basic information of any dashboard
items instantly with
Quick Edit Mode without going to the detailed edit screen.
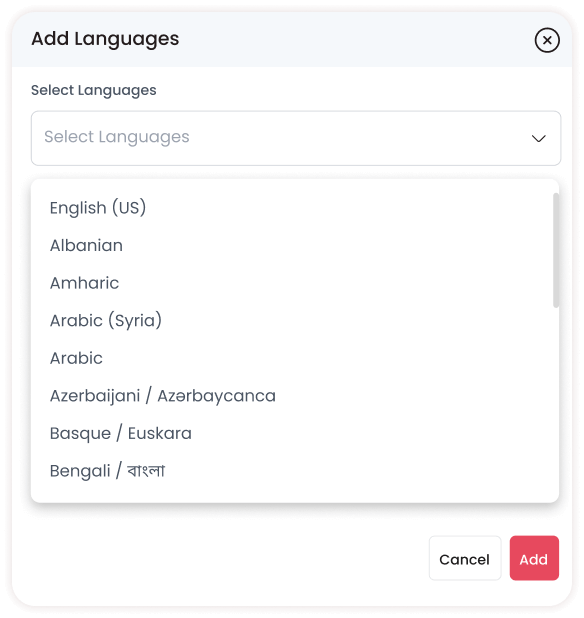
RTL Support
Onvodo® Dashboard Ninja Onvodo® gives you the freedom to work in
Right-to-Left
language-oriented interface for increasing productivity.
Frequently Asked Questions
Sometimes you need a quick answer to your
question. You can get it right away here.
General
Artificial Intelligence
Charts
Data Sources
Filters & Group By
Access Rights
- Yes. After you create a dashboard, an action is generated with the name: Menu Name + “Action”.
- For example, if you create a Project Dashboard, go to User Preferences → Home Action and select “Project Dashboard Action”.
- Easily assign Predefined Dashboards as the default landing view for users.
Dashboard Ninja Onvodo® Releases
Every update brings new capabilities. Keep track of the latest
features and
enhancements designed to visualize and analyze your data like
a pro.

Latest Release 3.0.0 (17th April, 2026)
- User can now apply custom colors to chart segments.
Release 2.0.0 (24th December, 2025)
- User can use multiple sources of data on one chart.
- User can define their own date filter.
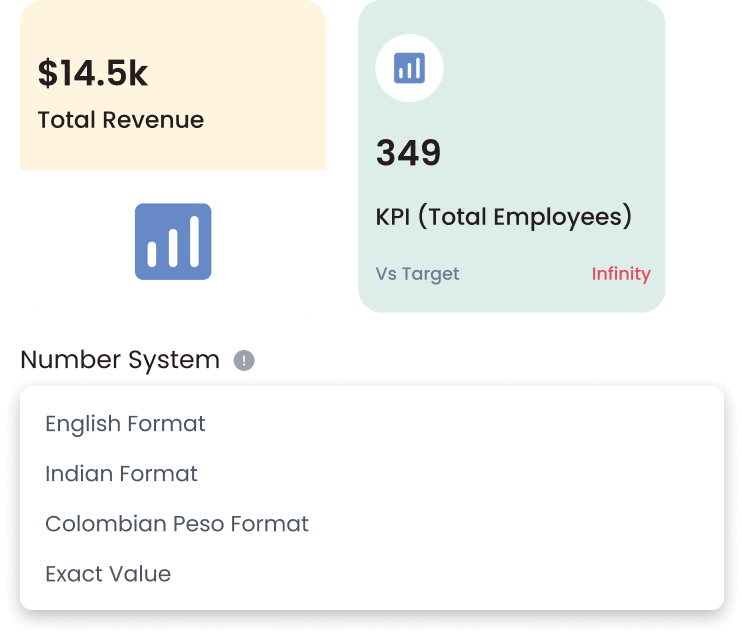
- User can define their own number system.
- User can define formula based on chart measures.
- Improved functionality of every sub-feature.
Release 1.0.3 (18th November, 2025)
- Add condition in base crud method to send bus notification.
Release 1.0.2 (17th October, 2025)
- AI issue was fixed.
Release 1.0.1 (23rd September, 2025)
- Bug Fixes.
Release 1.0.0 (12th September, 2025)
- Latest Version 19 Release of Dashboard Ninja Onvodo® With AI.