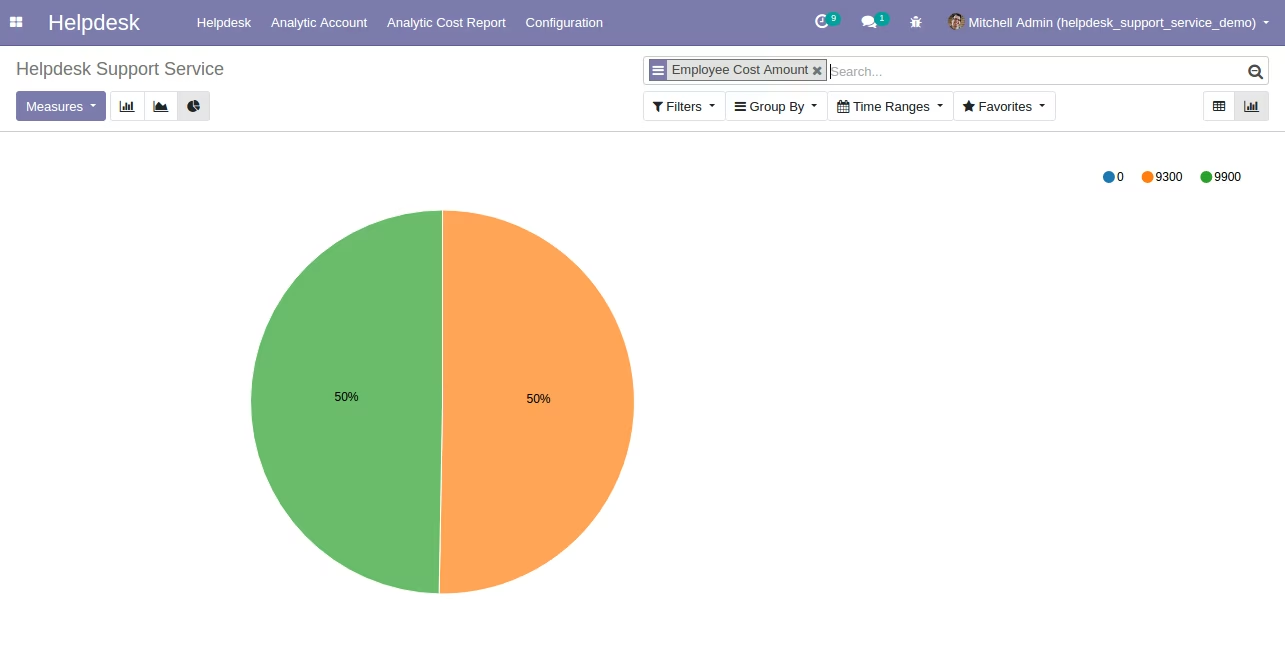
This module enriches helpdesk operations by enabling cost and revenue tracking per ticket using analytic accounts. Support teams can now gain a clear view of financial performance, with built-in pivot and graph reports for visual analysis. Ideal for organizations that want to better understand profitability and optimize service management, this module helps bridge financial tracking and helpdesk insights with precision and ease across.
Analyze helpdesk ticket cost and revenue using analytic account data
View financial insights through embedded pivot and graph reports
Seamless integration into Community Edition helpdesk workflows
Improves transparency by providing clear visibility into helpdesk financials
Enables data-driven decision-making through visual cost and revenue reports
Supports helpdesk performance monitoring with financial insights
Adds financial analytics capability without altering core functionality
This app allows helpdesk teams to do analysis of cost and revenue of tickets by analytic accounts.
Main Features:
- Allow you to do analysis on cost and revenue of your helpdesk by analytic account.
- Pivot and Graph Views of Analytic Cost Report as shown.
- For more details please see below screenshots and watch the video.
- App is only compatible with the community edition.
Menu Items Available:
- Analytic Cost Report
- Analytic Helpdesk
Analytic Account Form View [Standard] with Some Additional Fields.
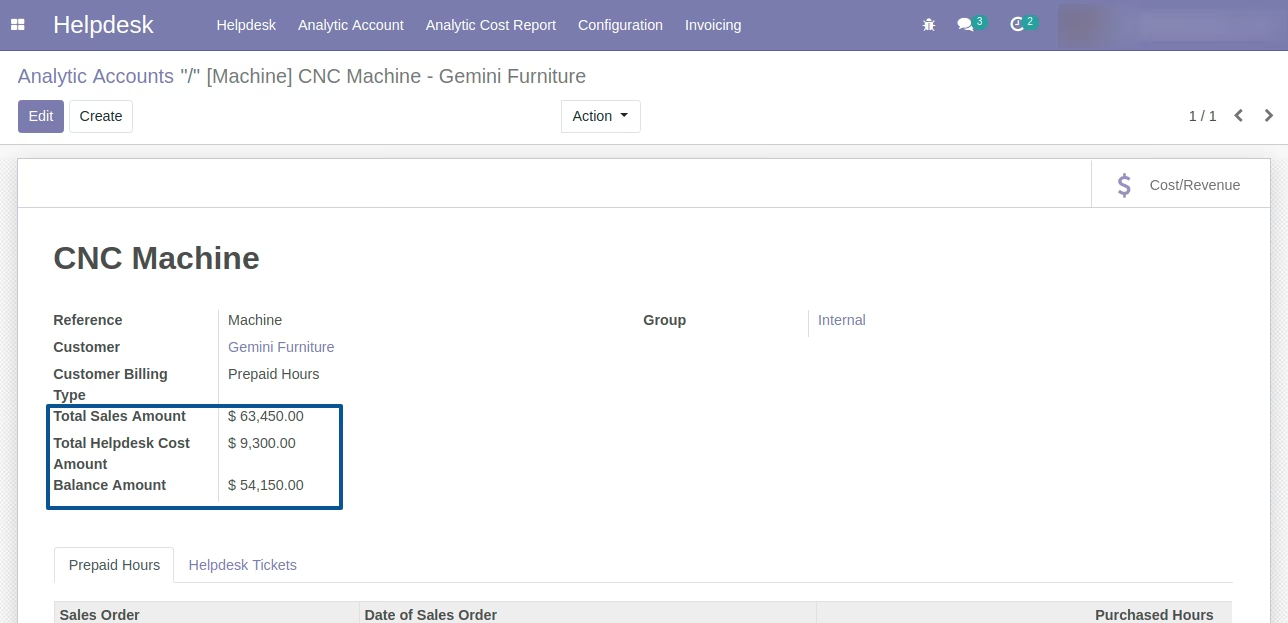
Analytic Account Form View [Standard] with Some Additional Fields.
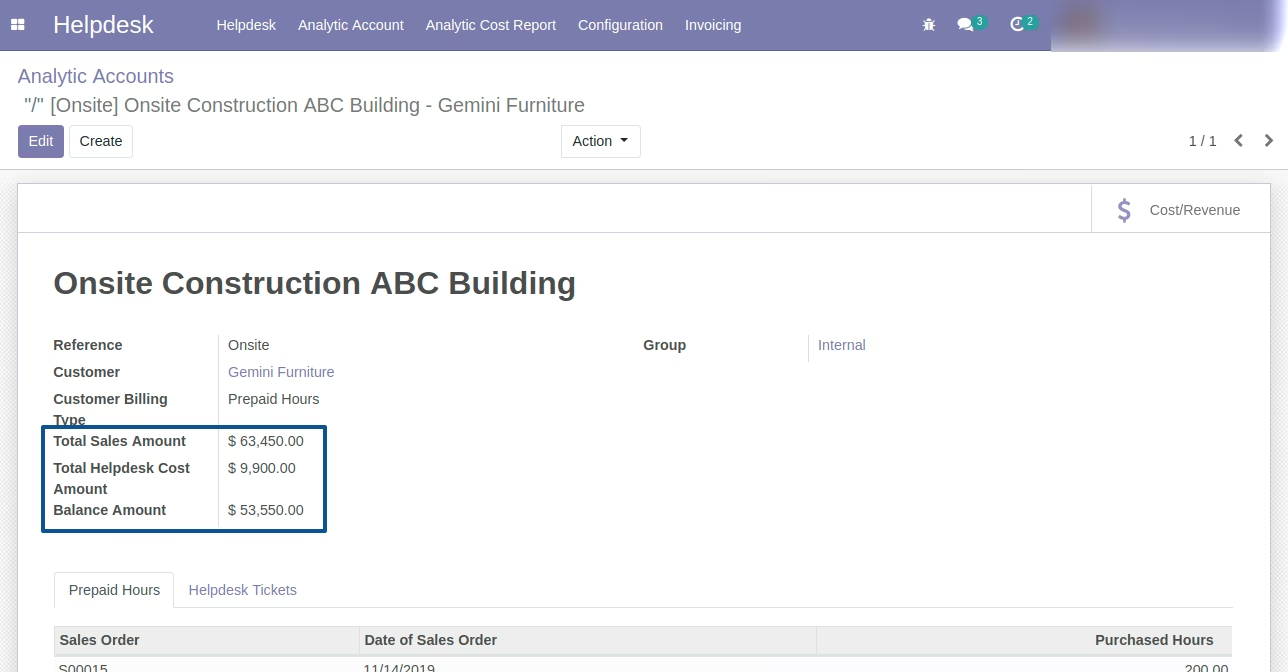
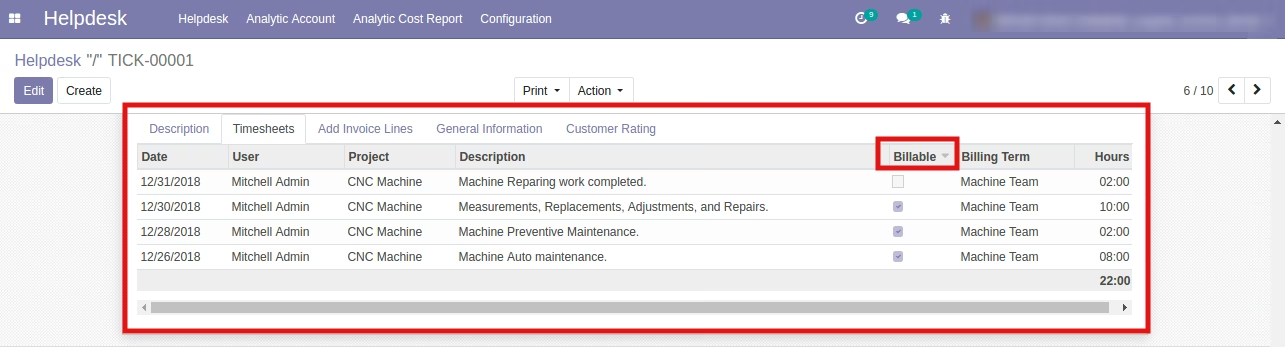
Helpdesk Ticket Form - Sample 1
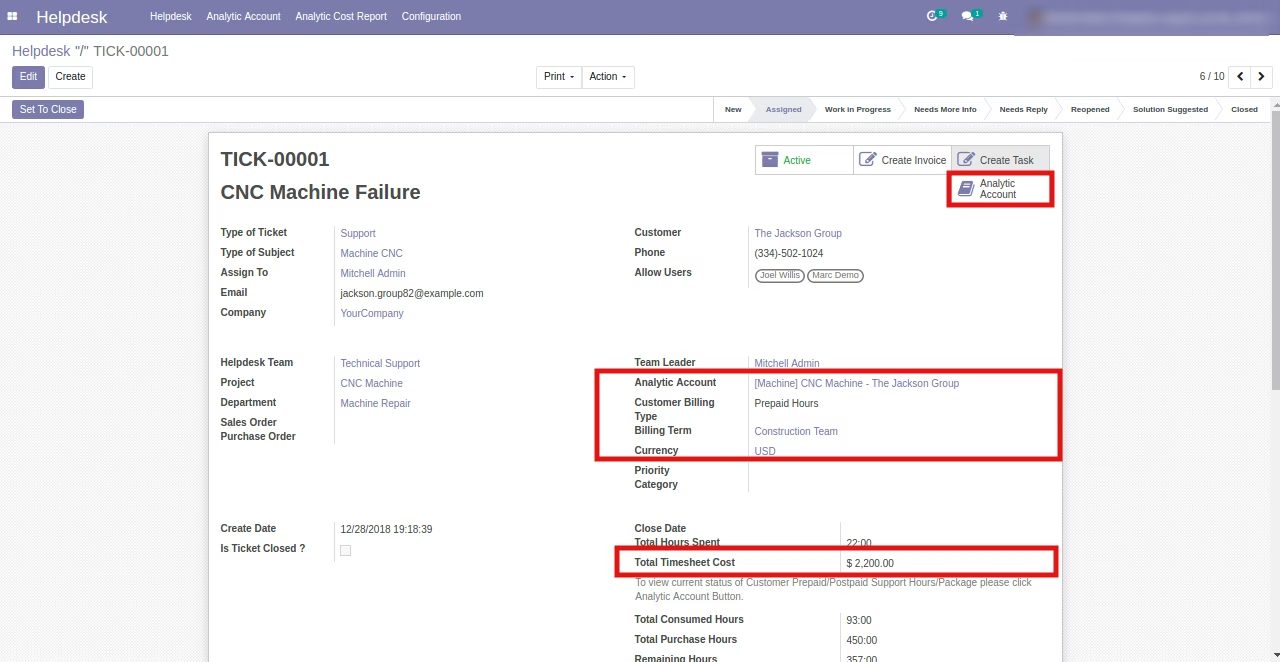
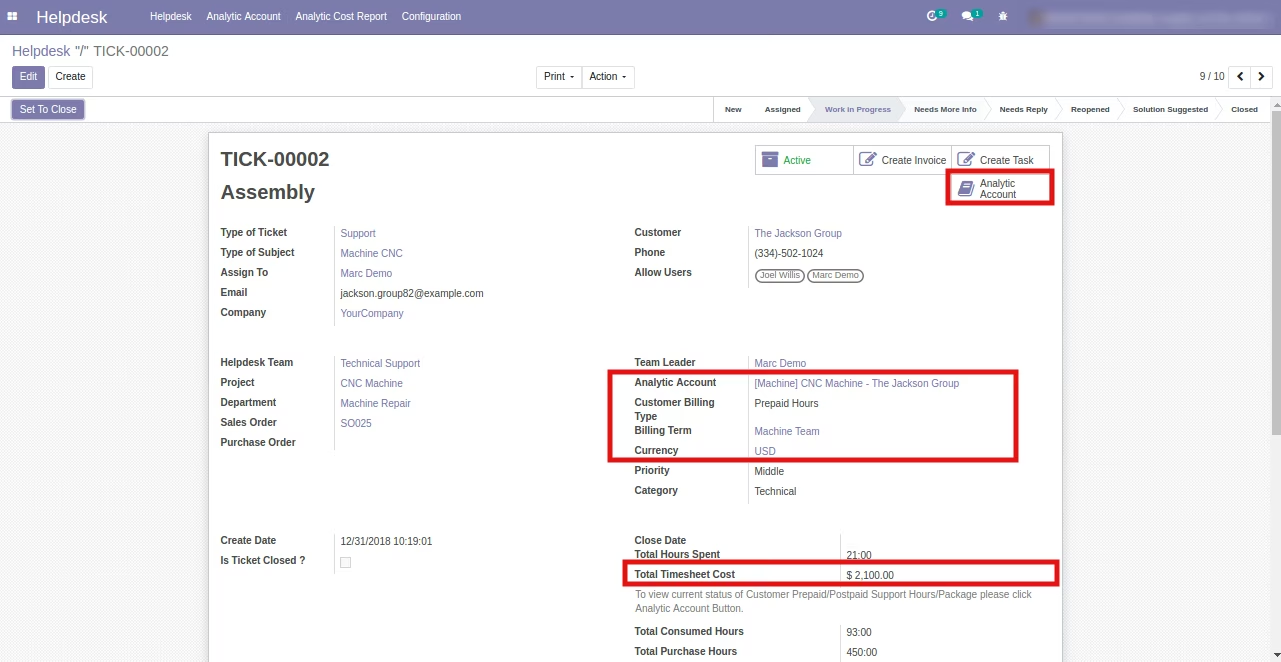
Helpdesk Ticket Form - Sample 2
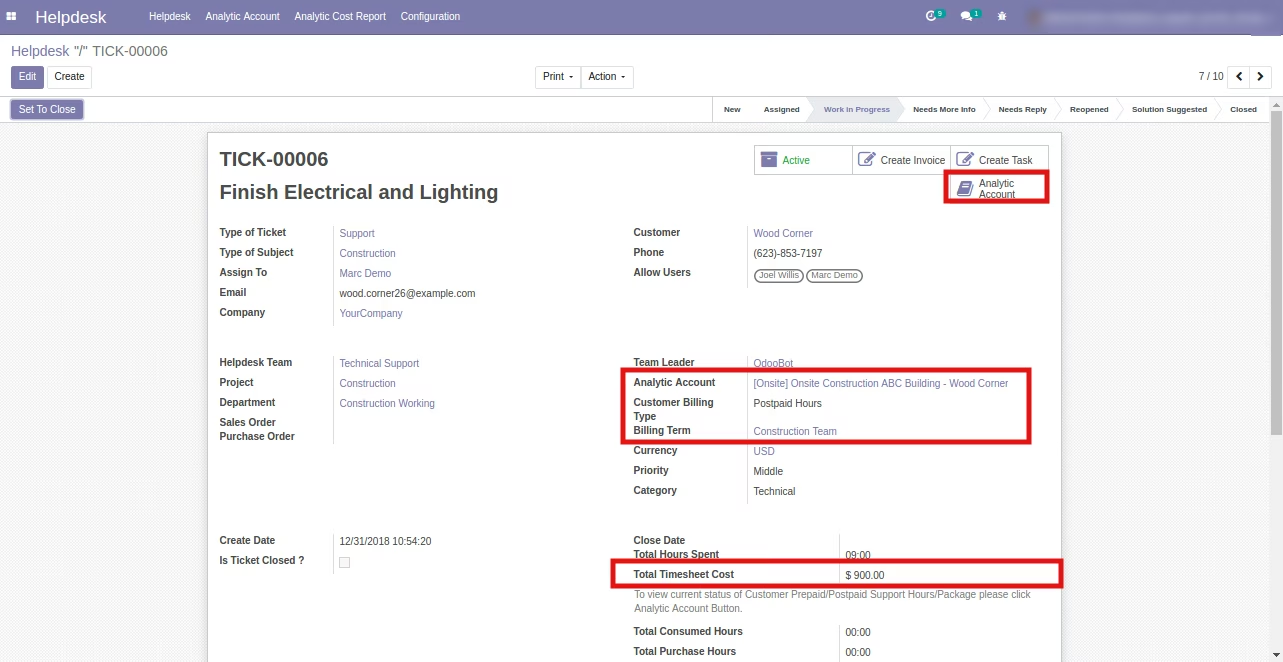
Helpdesk Ticket Form - Sample 3
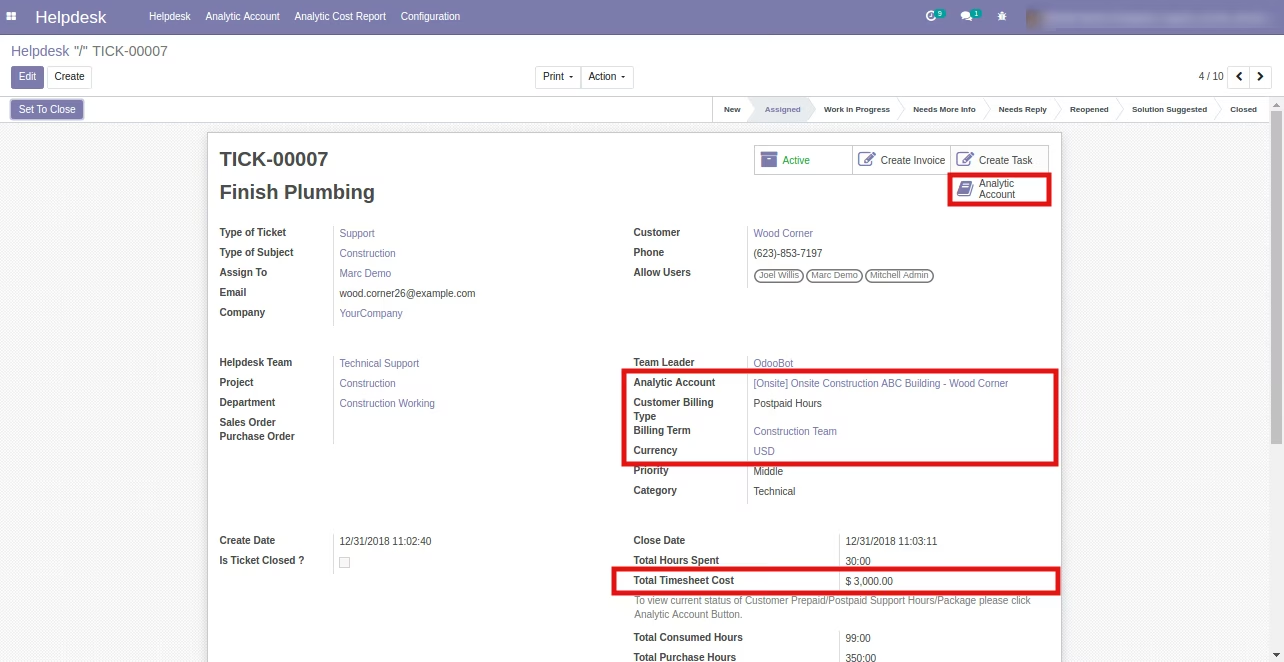
Helpdesk Ticket Form - Sample
Analytic Report Menu
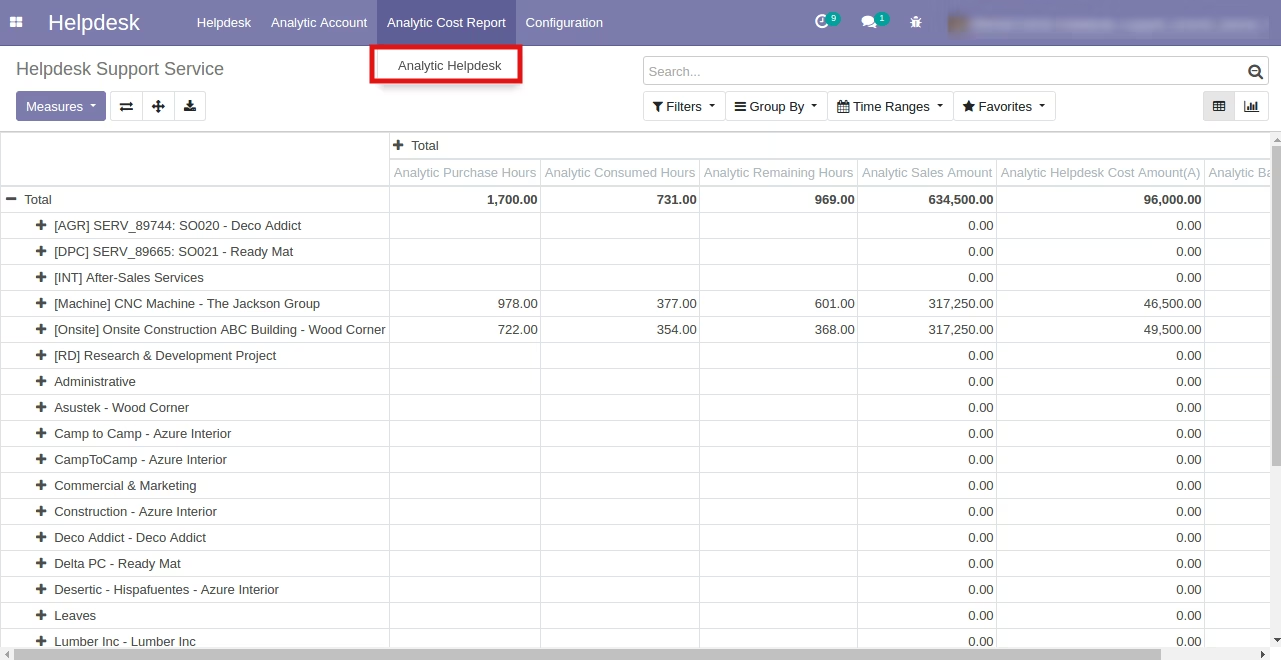
Helpdesk Analytic Cost and Revenue Analysis Report - by Analytic Account
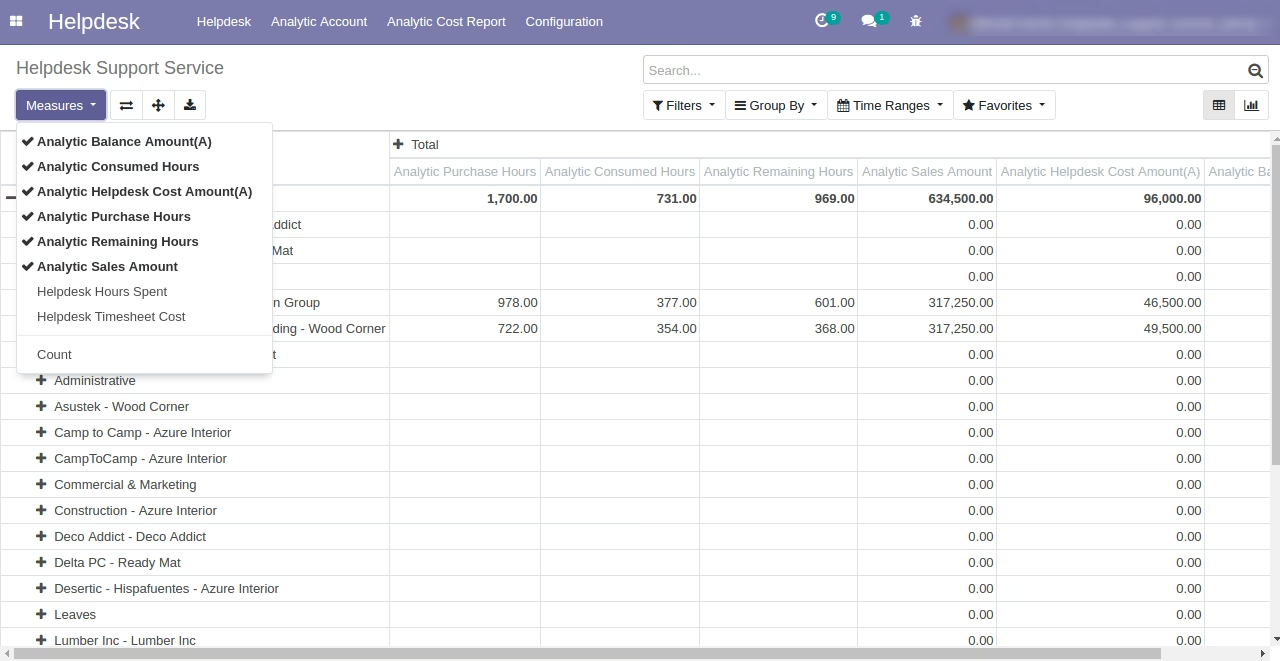
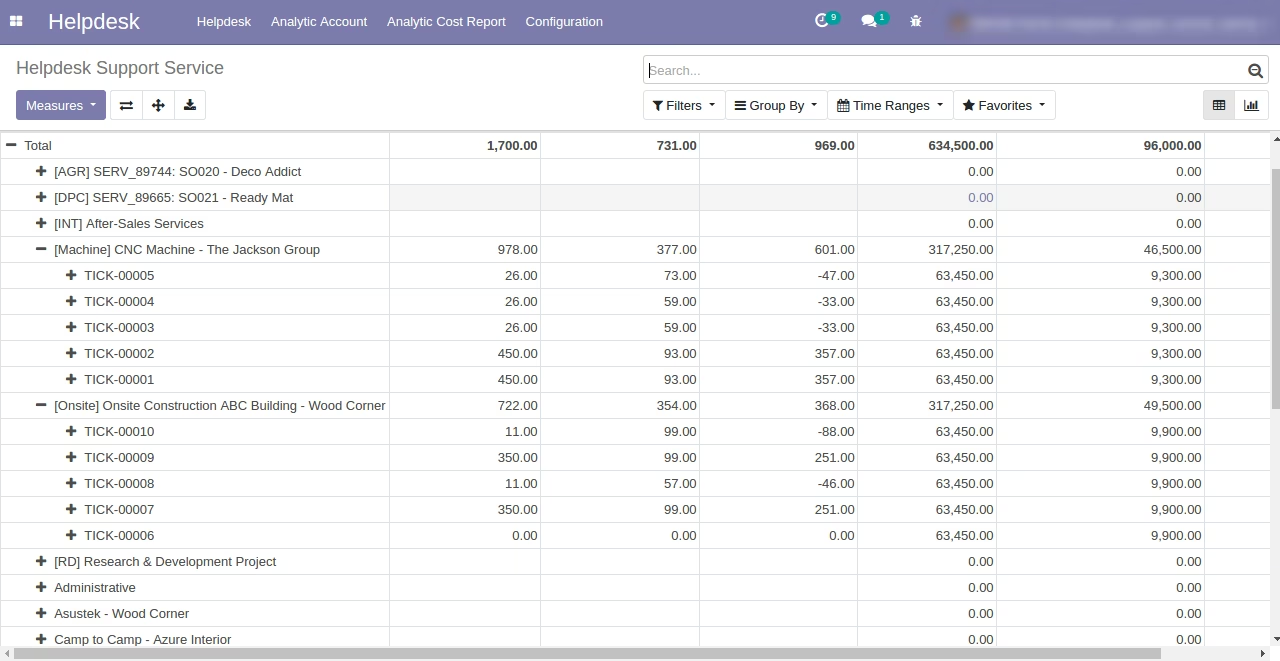
Helpdesk Analytic Cost and Revenue Analysis Report by Helpdesk Support Ticket
Helpdesk Analytic Cost and Revenue Analysis Graph View
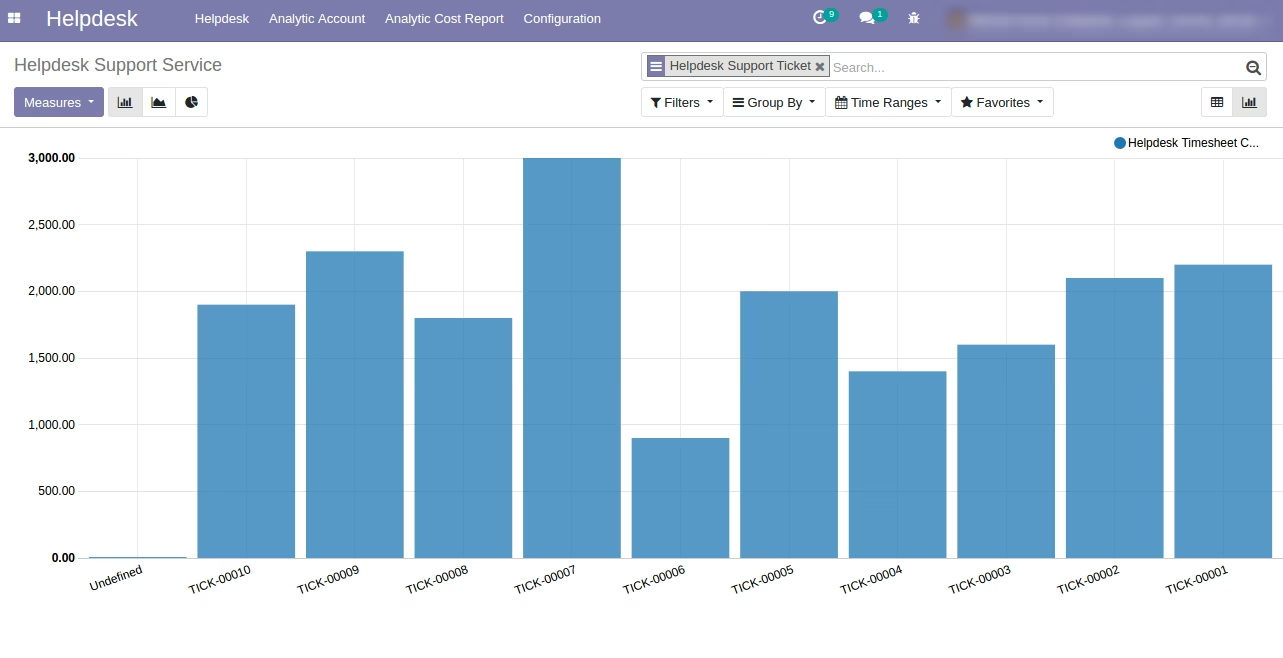
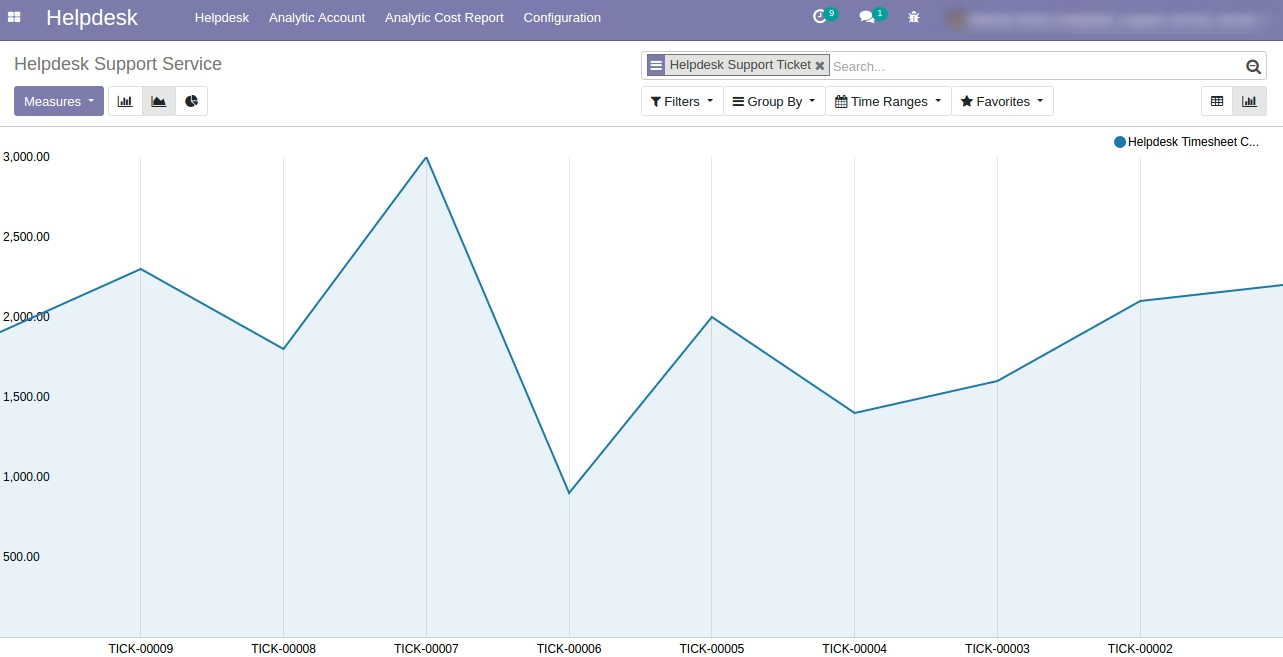
Helpdesk Timesheet Cost of line Chart in Graph view
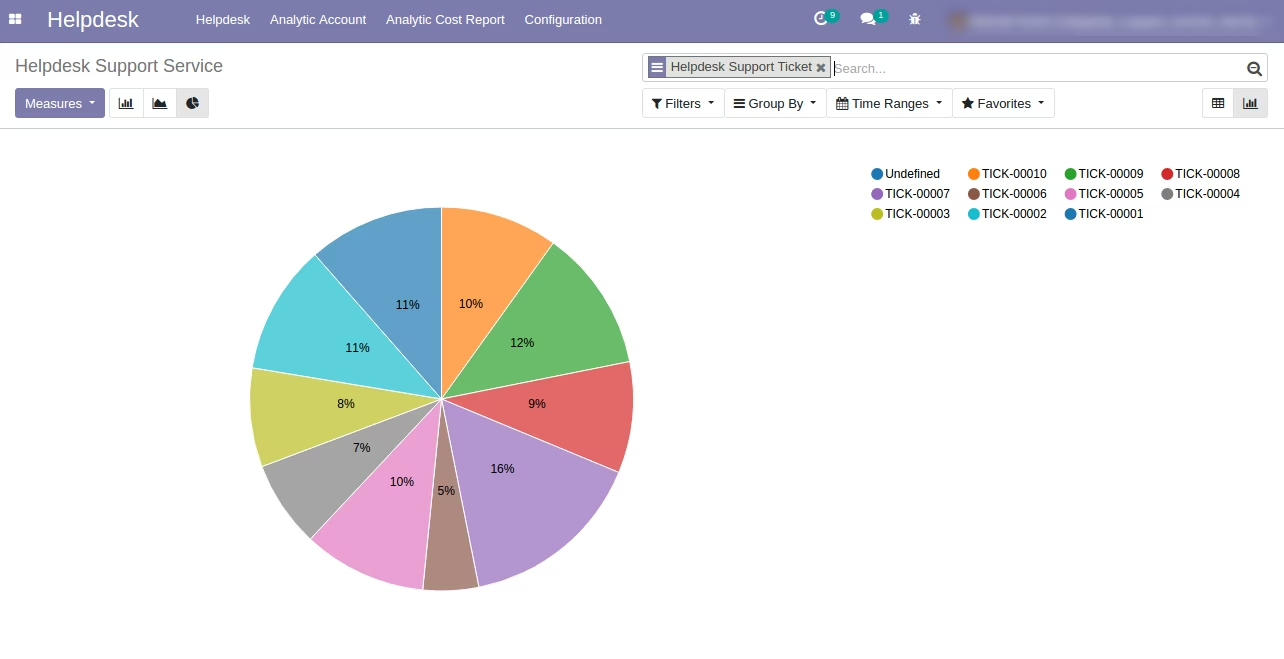
Helpdesk Timesheet Cost of Pie Chart in Graph view
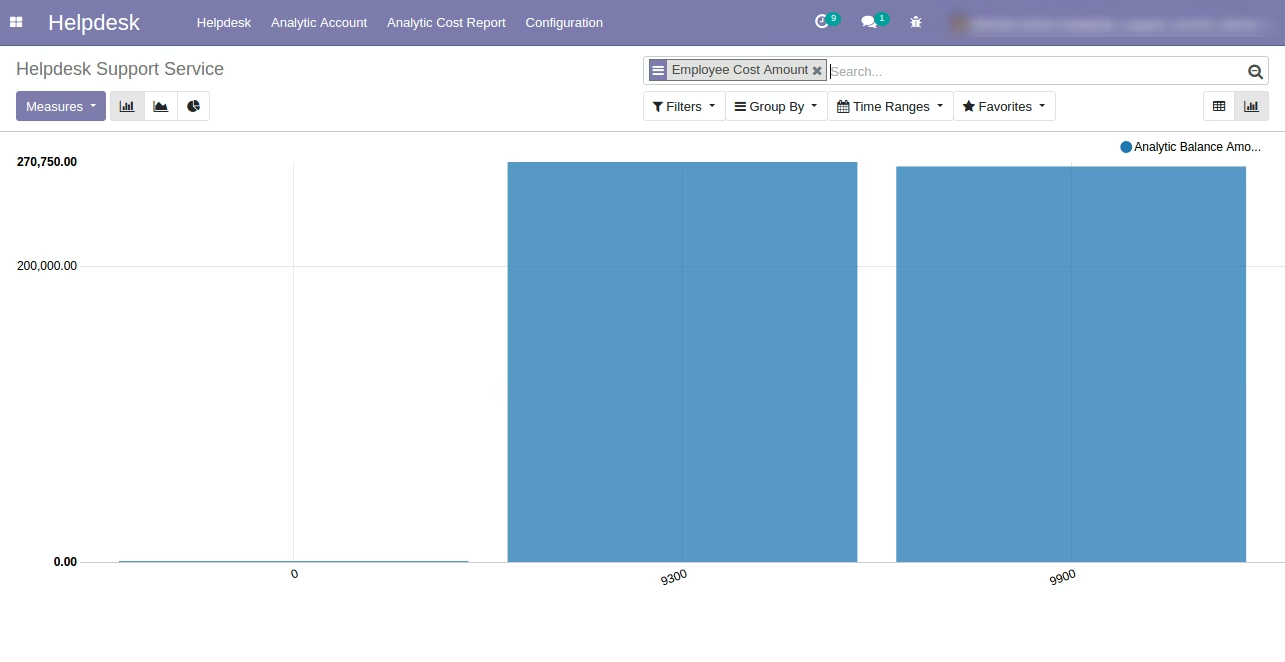
Analytic Balance Amount of Bar Chart in Graph view
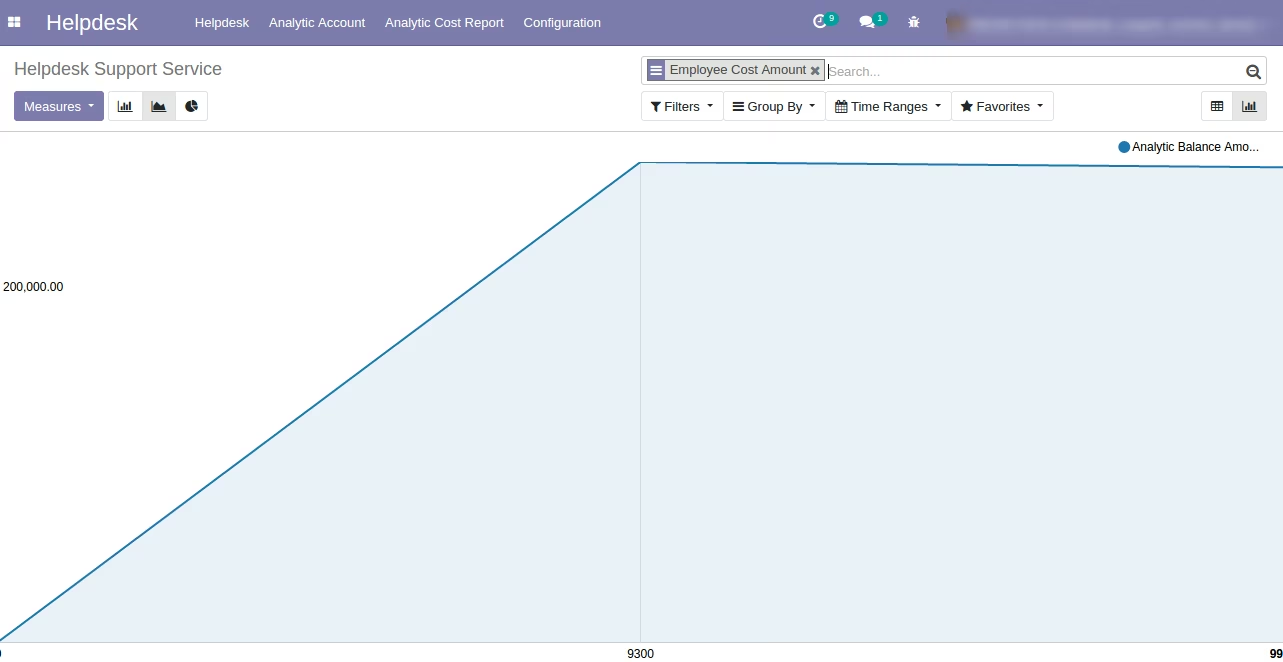
Analytic Balance Amount of Line Chart in Graph view
Helpdesk Timesheet Cost of Pie Chart in Graph view