The module enables the integration of interactive and customizable ECharts visualizations into forms and views. This module enhances data presentation by providing dynamic charts that can be embedded directly within the interface.
Interactive Charts: Display interactive charts that users can engage with to explore data.
Customizable Visualizations: Tailor the appearance and behavior of charts to meet specific requirements.
Seamless Integration: Embed ECharts visualizations within forms and views without extensive customization.
Dynamic Data Binding: Link chart data to model fields, ensuring real-time updates and accuracy.
User-Friendly Interface: Provides an intuitive interface for users to interact with and interpret data visualizations.
Enhanced Data Presentation: Transforms raw data into visually appealing and understandable charts.
Improved Decision-Making: Facilitates data-driven decisions by providing clear visual insights.
Increased User Engagement: Interactive charts encourage users to explore and analyze data more effectively.
Streamlined Workflow: Integrates seamlessly into existing workflows, minimizing disruption.
Customization Flexibility: Offers extensive customization options to tailor visualizations to specific needs.
User Guide
Step 1: Add a calculated field to the model and return the JSON format
# model.py _inherit = 'modelName' chart = fields.Char(string='Exchange rate chart', compute='_compute_chart') def _compute_chart(self): # You can query internal and external data sources through Odoo's ORM methods, SQL statements, etc., and then return data in JSON format option = { 'xAxis': { 'type': 'category', 'data': [ '2010-01-01', '2023-03-25', '2023-03-26', '2023-03-27', '2023-03-28', '2023-03-29', '2023-03-30', '2023-03-31', '2023-04-01', '2023-04-02', '2023-04-03', '2023-04-04', '2023-04-05', '2023-04-06', '2023-04-07', '2023-04-08', '2023-04-09', '2023-04-10', '2023-04-11', '2023-04-12', '2023-04-13', '2023-04-14', '2023-04-15', '2023-04-16', '2023-04-17', '2023-04-18', '2023-04-19', '2023-04-20', '2023-04-21', '2023-04-22', '2023-04-23', '2023-06-06' ] }, 'yAxis': {'type': 'value'}, 'series': [ { 'data': [ 1.2834, 1.5289, 1.2834, 1.4365, 1.3256, 1.4526, 1.6523, 1.5234, 1.2548, 1.5434, 1.3154, 1.4253, 1.3521, 1.5234, 1.5321, 1.1235, 1.3215, 1.3543, 1.5214, 1.4531, 1.3245, 1.4531, 1.3245, 1.1532, 1.5563, 1.3541, 1.5213, 1.3515, 1.5312, 1.5313, 1.2145, 1.5289 ], 'type': 'line', 'smooth': True } ] } options = json.dumps(option).replace('True', 'true').replace('False', 'false') self.chart = options
Step 2: Add calculated fields to the Form view, using the echarts widget
<script type="text/javascript" src="/module_name/static/src/js/chart.js"/> <field name="chart" widget="echarts" style="height:300px;"/>
eCharts chart function & callback
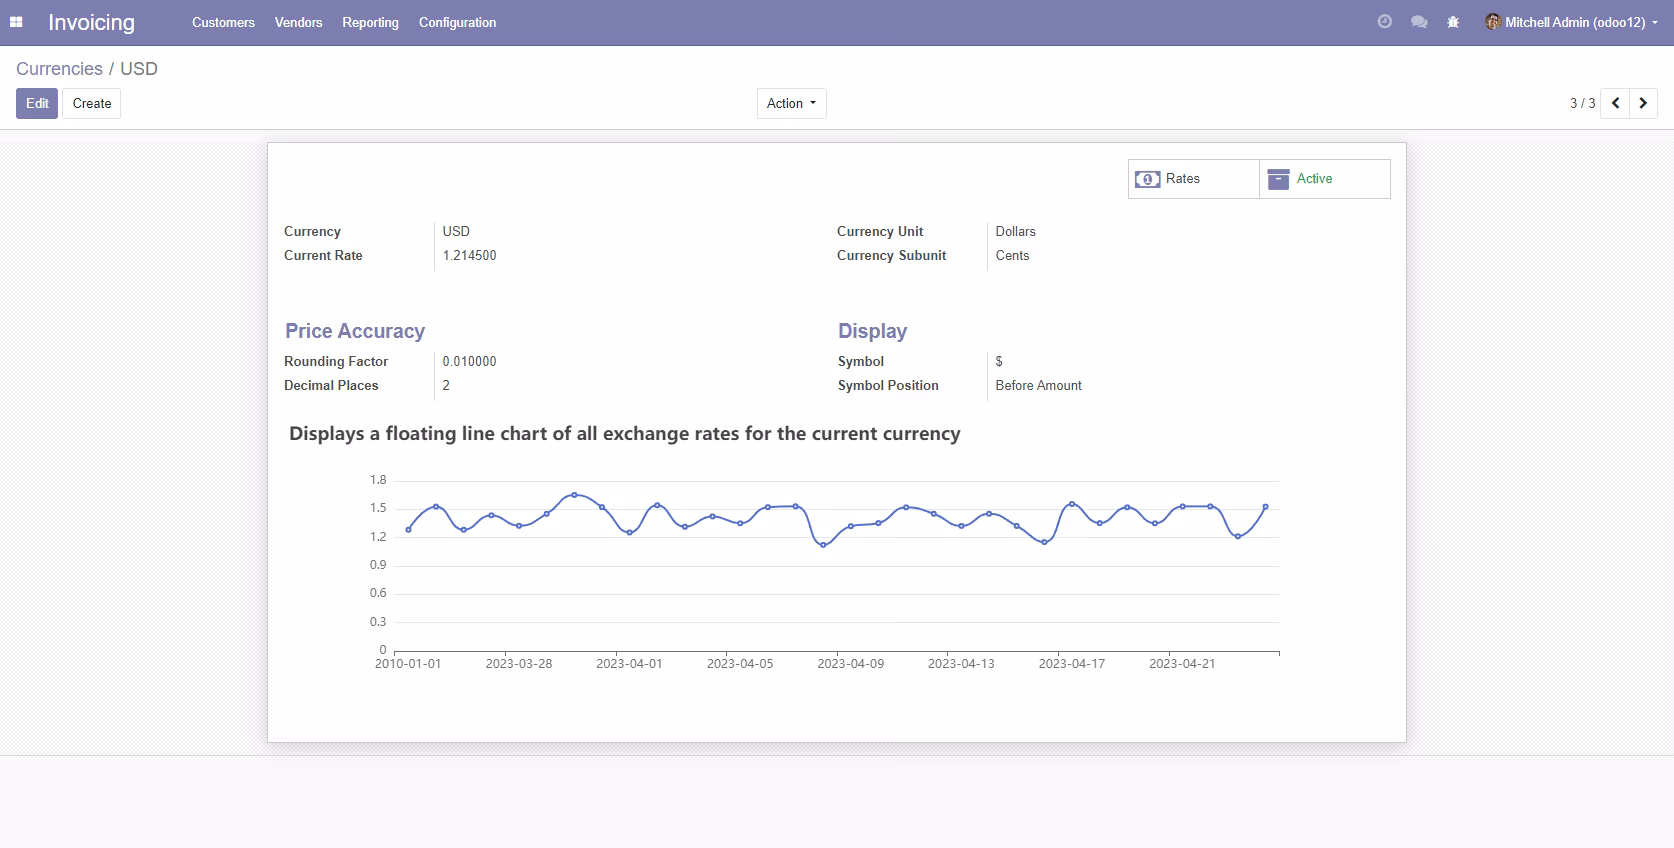
if ($('div[name="chart"]>div').length > 0) { let chart = echarts.getInstanceByDom($('div[name="chart"]>div')[0]) chart.setOption( { title: { text: 'Displays a floating line chart of all exchange rates for the current currency' }, tooltip: { trigger: 'axis' }, } ) }
All options of the chart after combining calculated fields with JavaScript are set as follows
{ title: { text: 'Displays a floating line chart of all exchange rates for the current currency' }, tooltip: { trigger: 'axis' }, xAxis: { type: 'category', data: [ '2010-01-01', '2023-03-25', '2023-03-26', '2023-03-27', '2023-03-28', '2023-03-29', '2023-03-30', '2023-03-31', '2023-04-01', '2023-04-02', '2023-04-03', '2023-04-04', '2023-04-05', '2023-04-06', '2023-04-07', '2023-04-08', '2023-04-09', '2023-04-10', '2023-04-11', '2023-04-12', '2023-04-13', '2023-04-14', '2023-04-15', '2023-04-16', '2023-04-17', '2023-04-18', '2023-04-19', '2023-04-20', '2023-04-21', '2023-04-22', '2023-04-23', '2023-06-06' ] }, yAxis: {type: 'value'}, series: [ { data: [ 1.2834, 1.5289, 1.2834, 1.4365, 1.3256, 1.4526, 1.6523, 1.5234,1.2548, 1.5434, 1.3154, 1.4253, 1.3521, 1.5234, 1.5321, 1.1235, 1.3215, 1.3543, 1.5214, 1.4531, 1.3245, 1.4531, 1.3245, 1.1532, 1.5563, 1.3541, 1.5213, 1.3515, 1.5312, 1.5313, 1.2145, 1.5289], type: 'line', smooth: true } ] }