The module for enables seamless integration between and external PostgreSQL databases. This allows businesses to extract, analyze, and visualize data from external sources directly, enhancing data-driven decision-making processes.
External Database Integration: Connect to external PostgreSQL databases to import and analyze external data.
Data Extraction: Retrieve data from external PostgreSQL databases using SQL queries for customized data access.
Data Analysis: Analyze extracted data within using reporting and dashboard tools.
Data Visualization: Visualize external data alongside data to gain comprehensive insights.
Scheduled Data Import: Automate data imports at scheduled intervals to maintain up-to-date information.
Enhanced Data Insights: Gain deeper insights by integrating and analyzing external data within.
Improved Decision-Making: Make informed decisions based on comprehensive data analysis.
Operational Efficiency: Centralize data sources within to streamline data management processes.
Customizable Data Retrieval: Tailor data extraction to specific business needs using SQL queries.
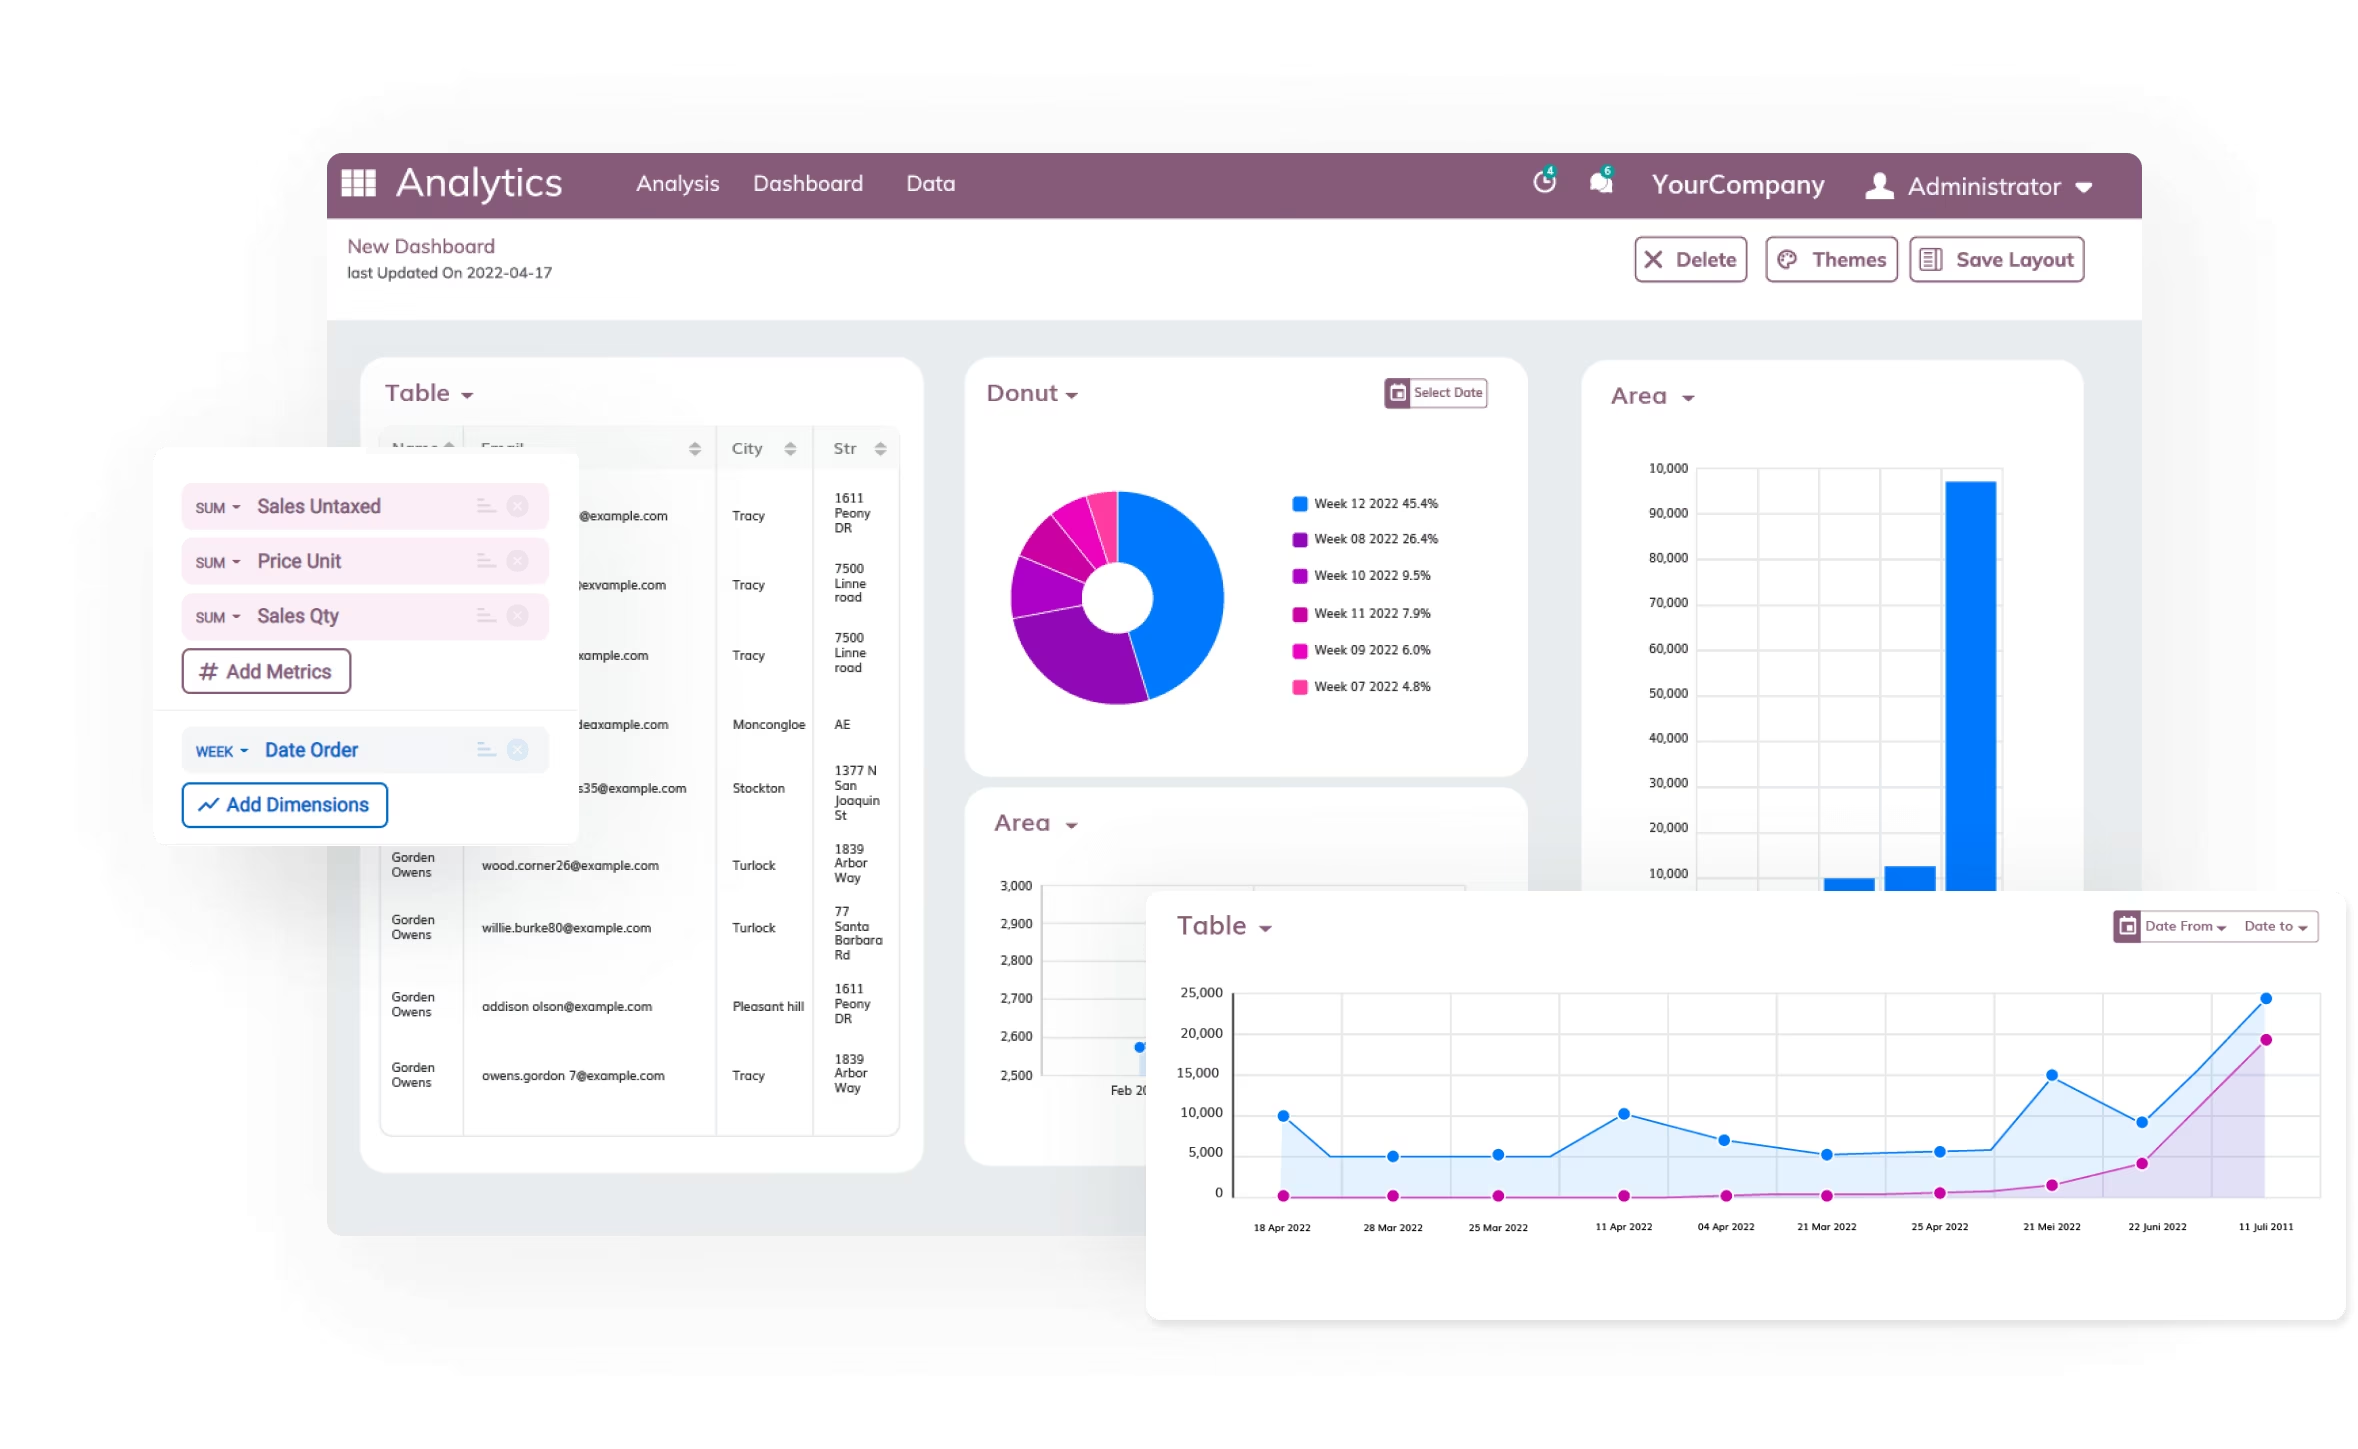
Analytics Dashboard
Ways to Accelerate
Your Business Insights
Upgrade your to the next level with Analytics Dashboard.Make analysis accessible with interactive and customizable data visualizations.
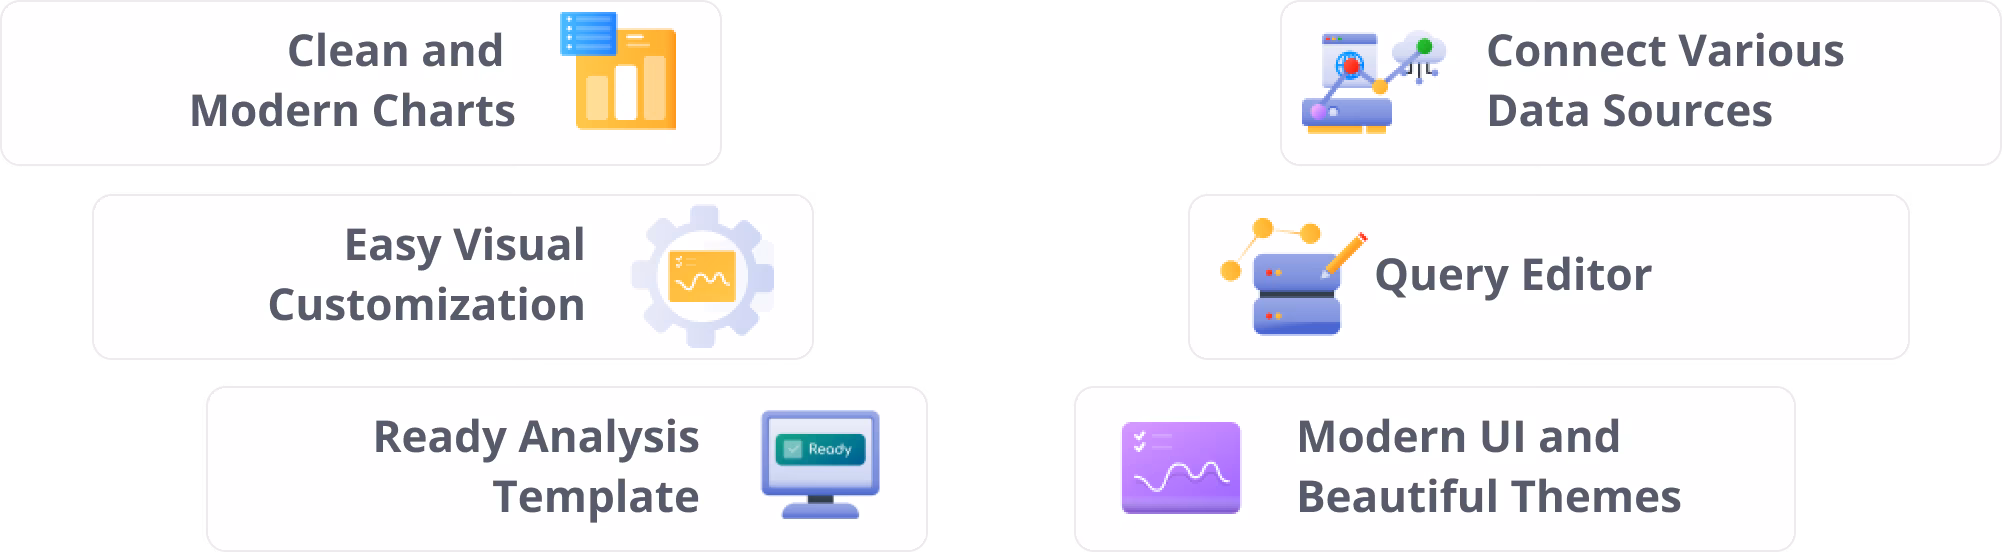
Clean & Modern Charts
for Your Business
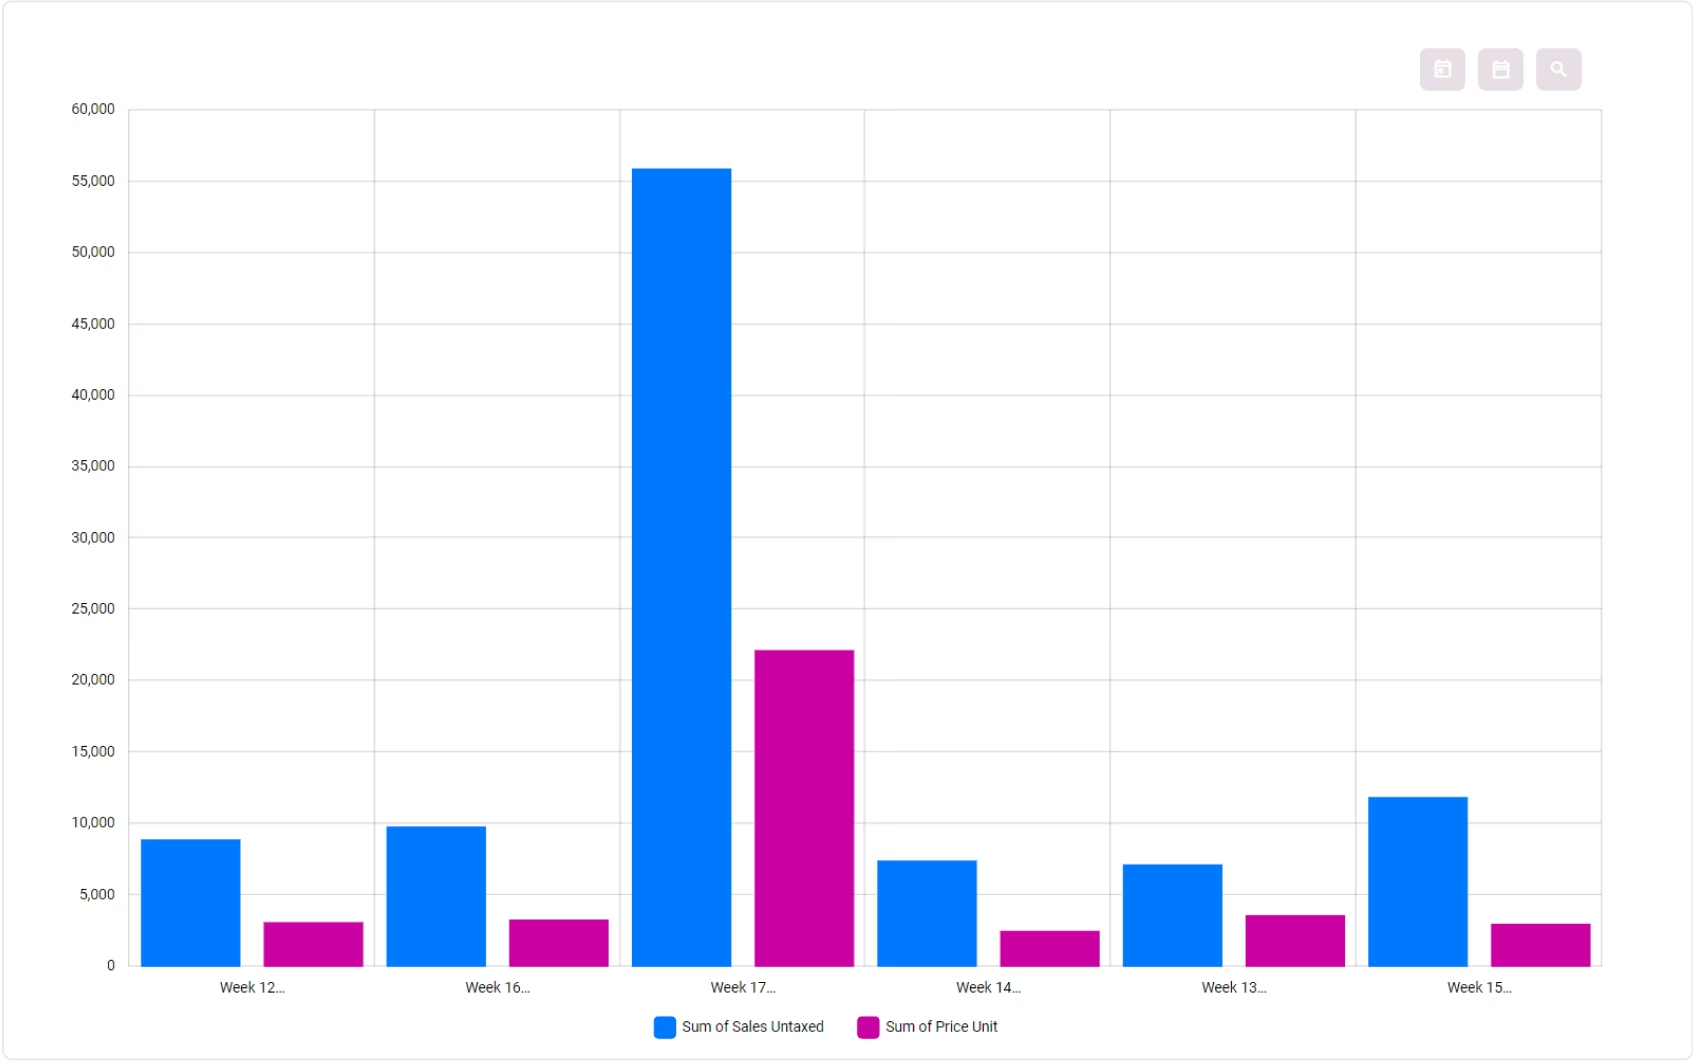
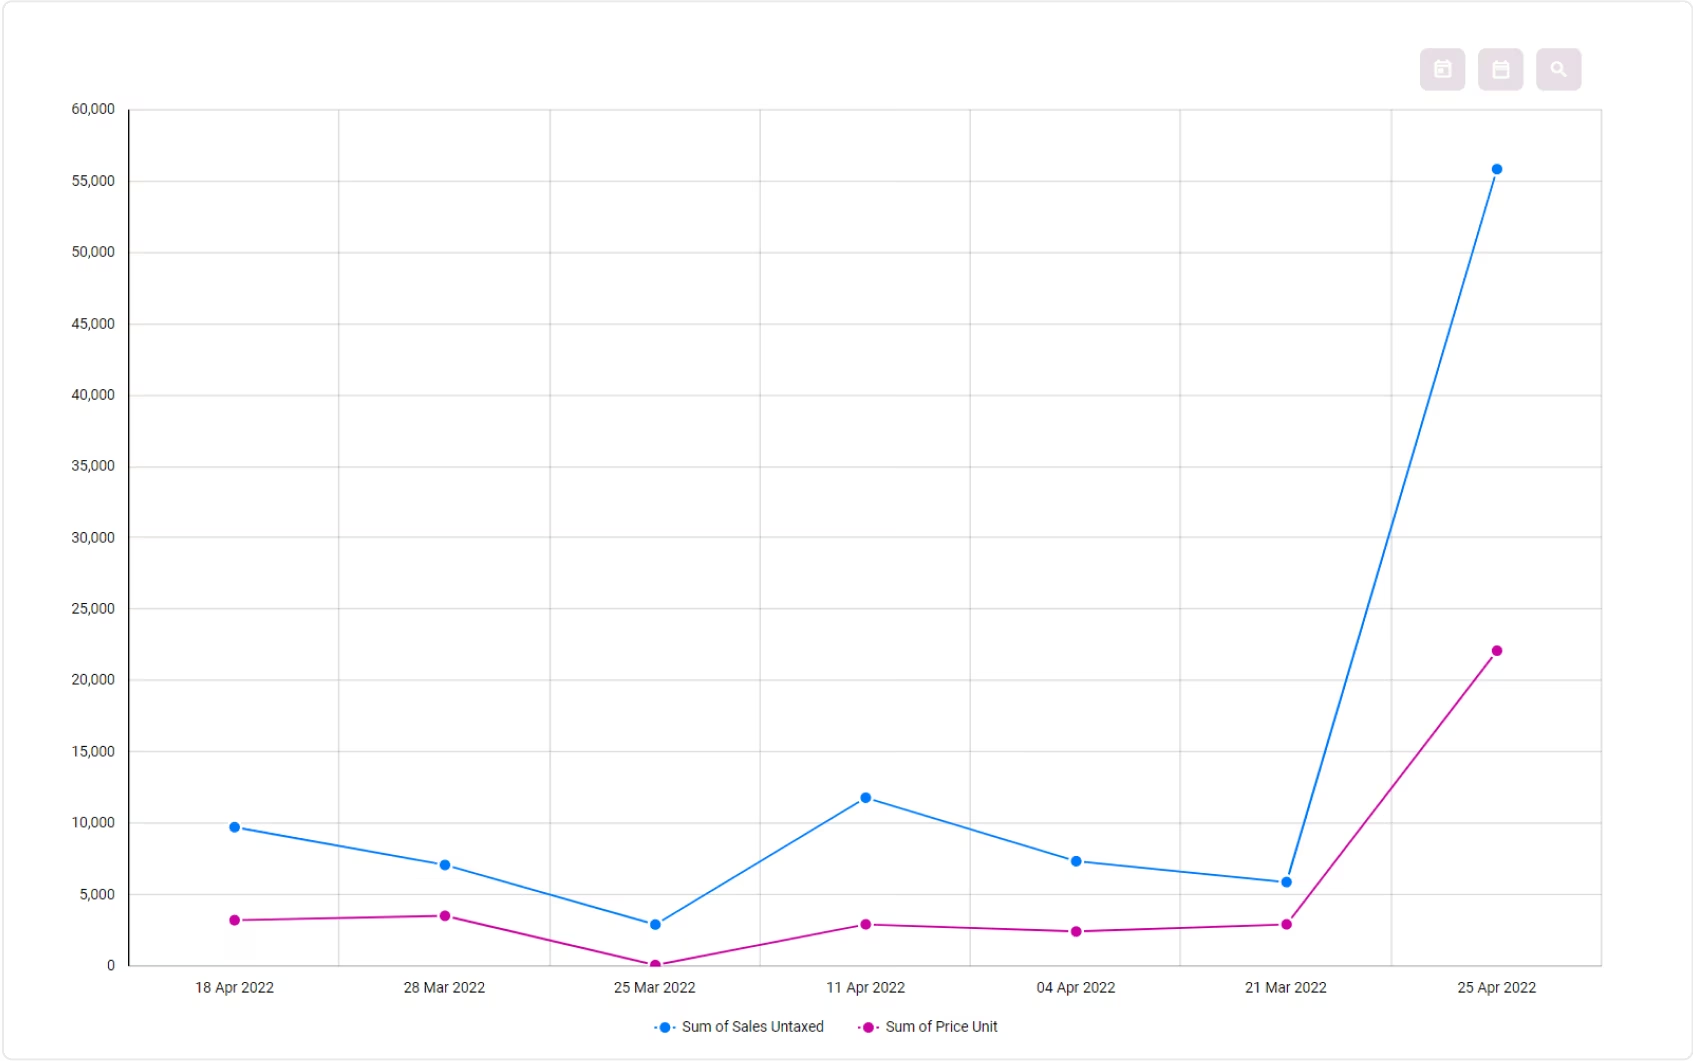
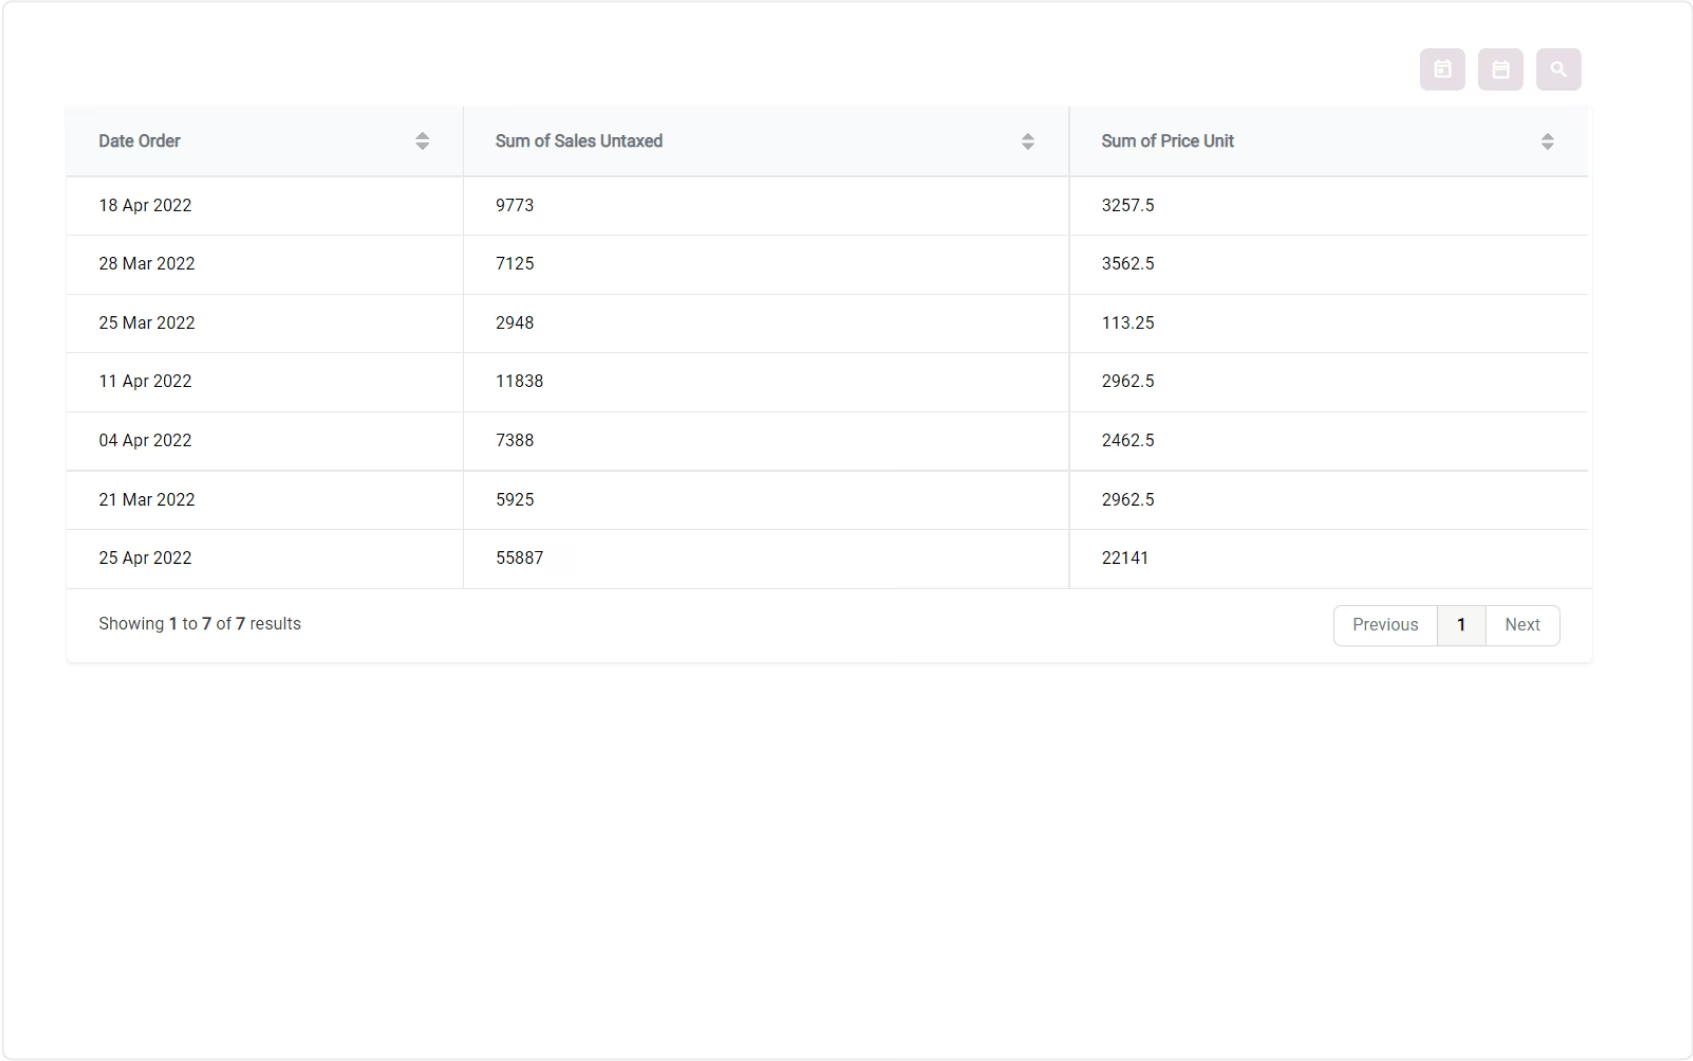
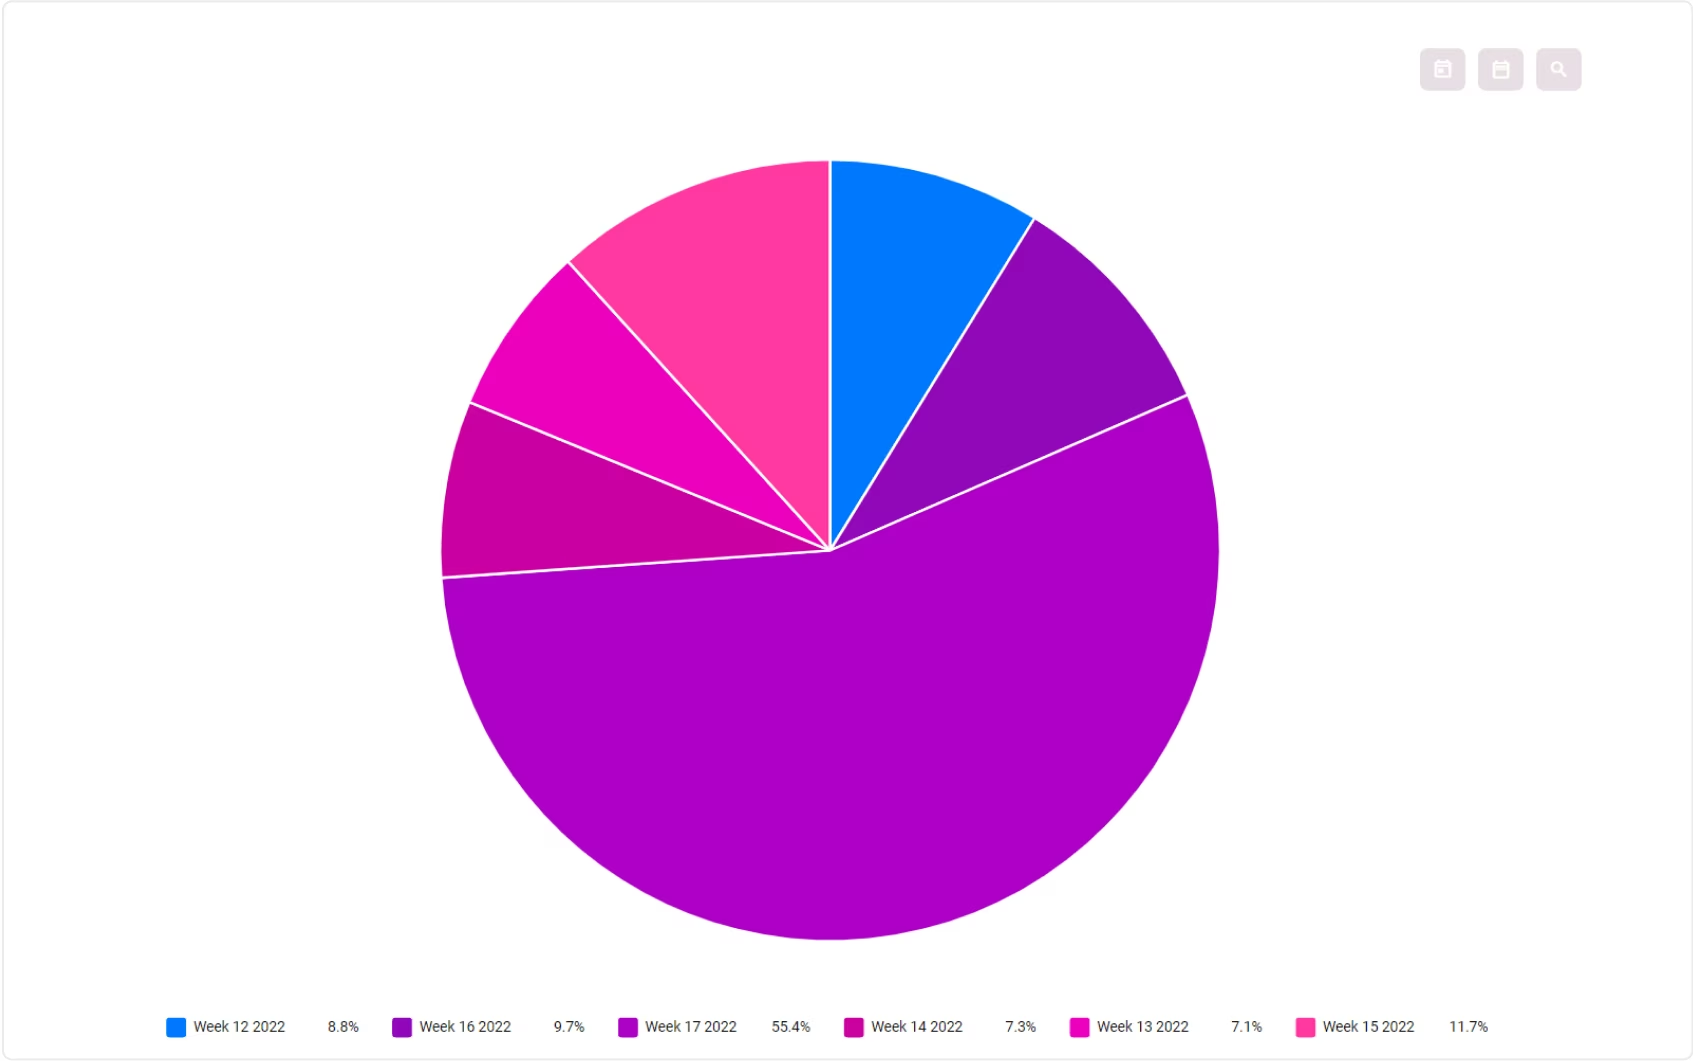
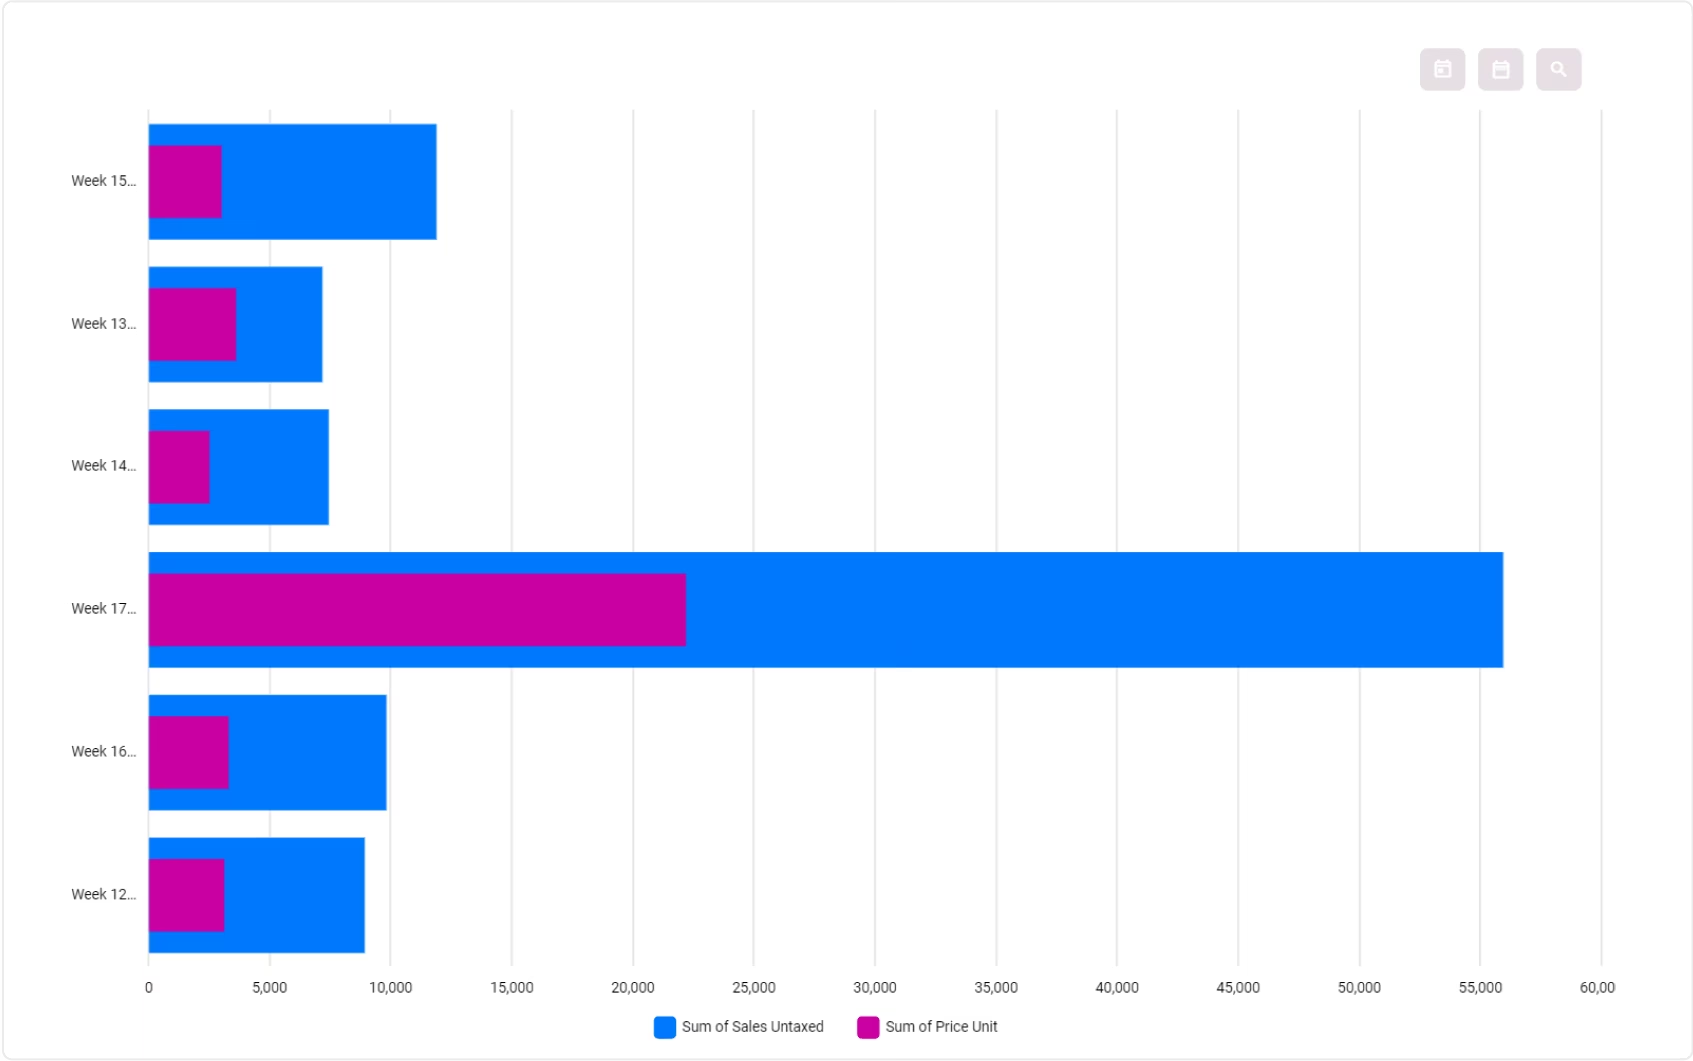
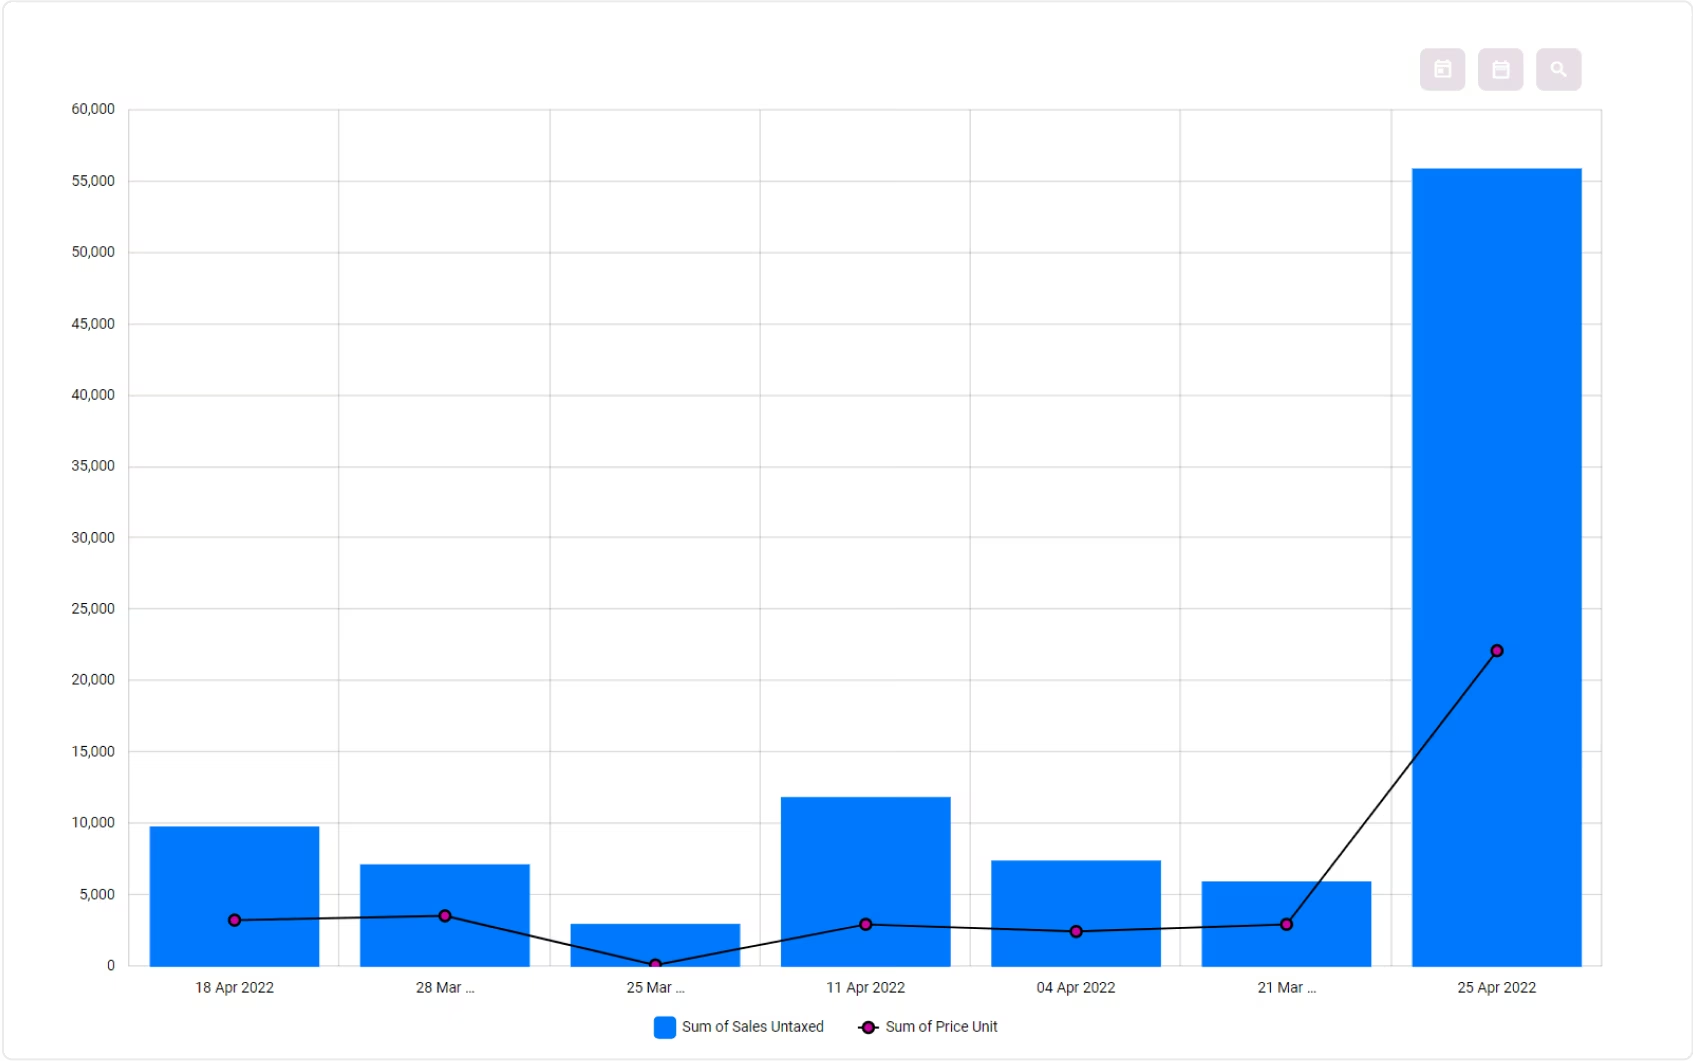
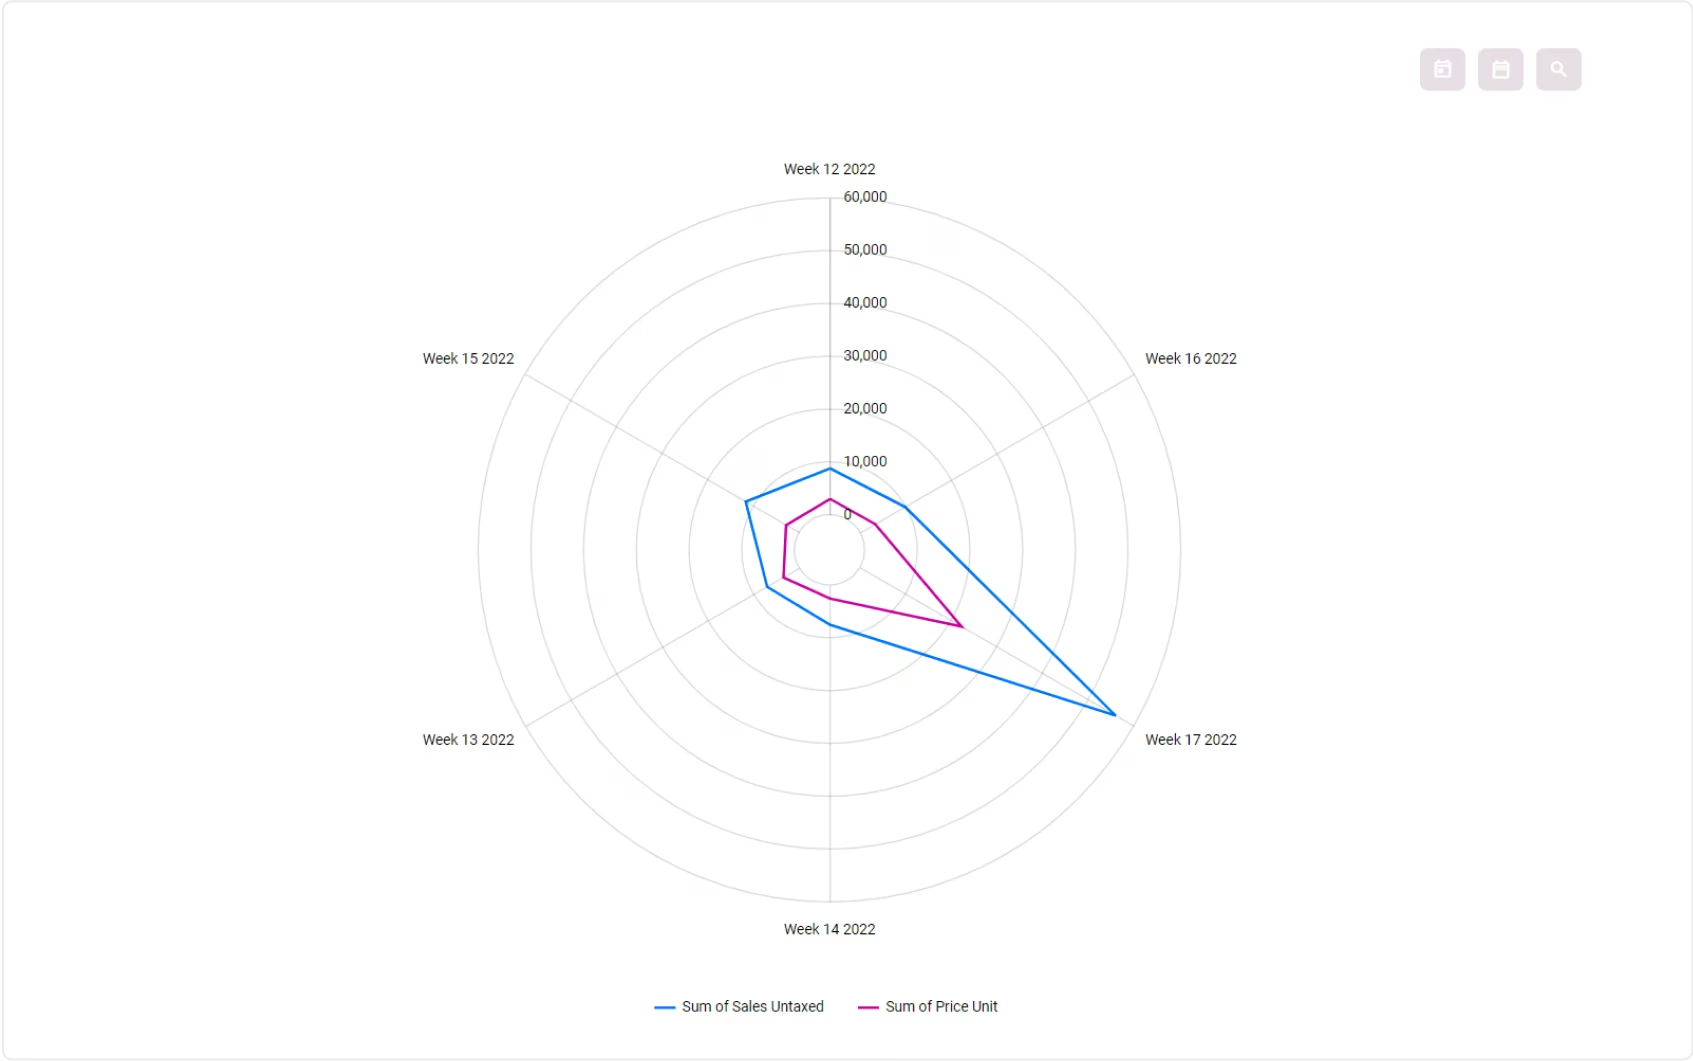
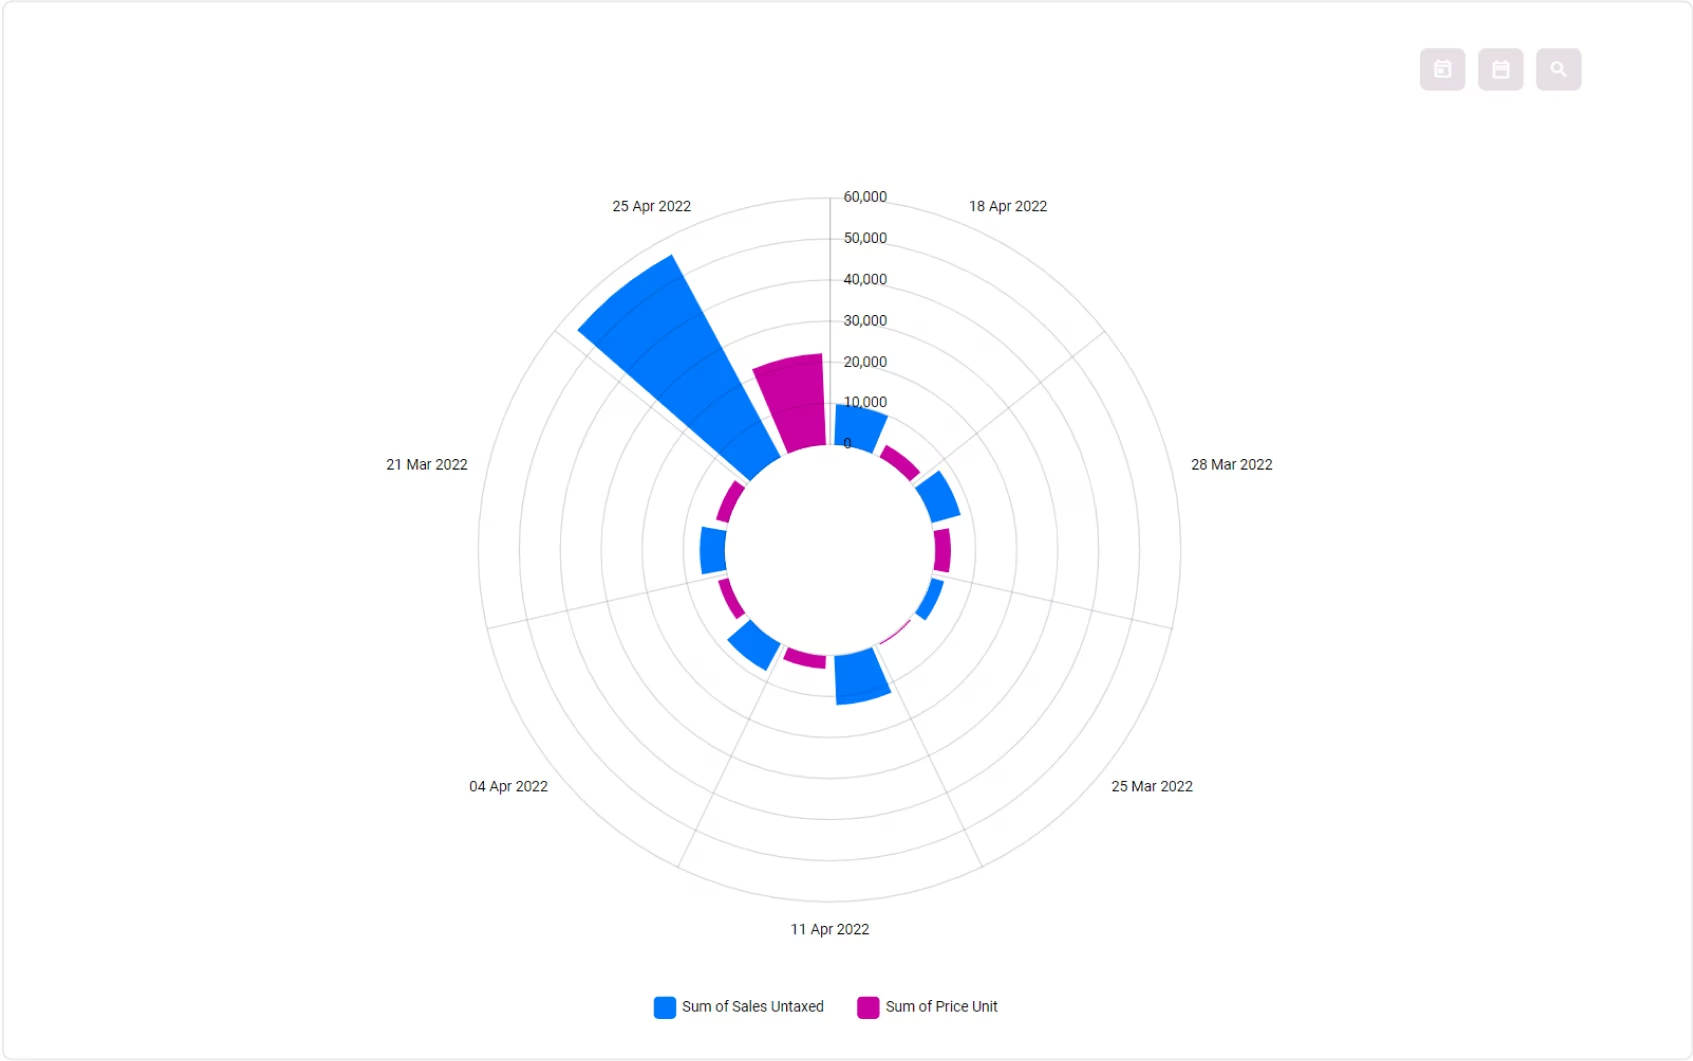
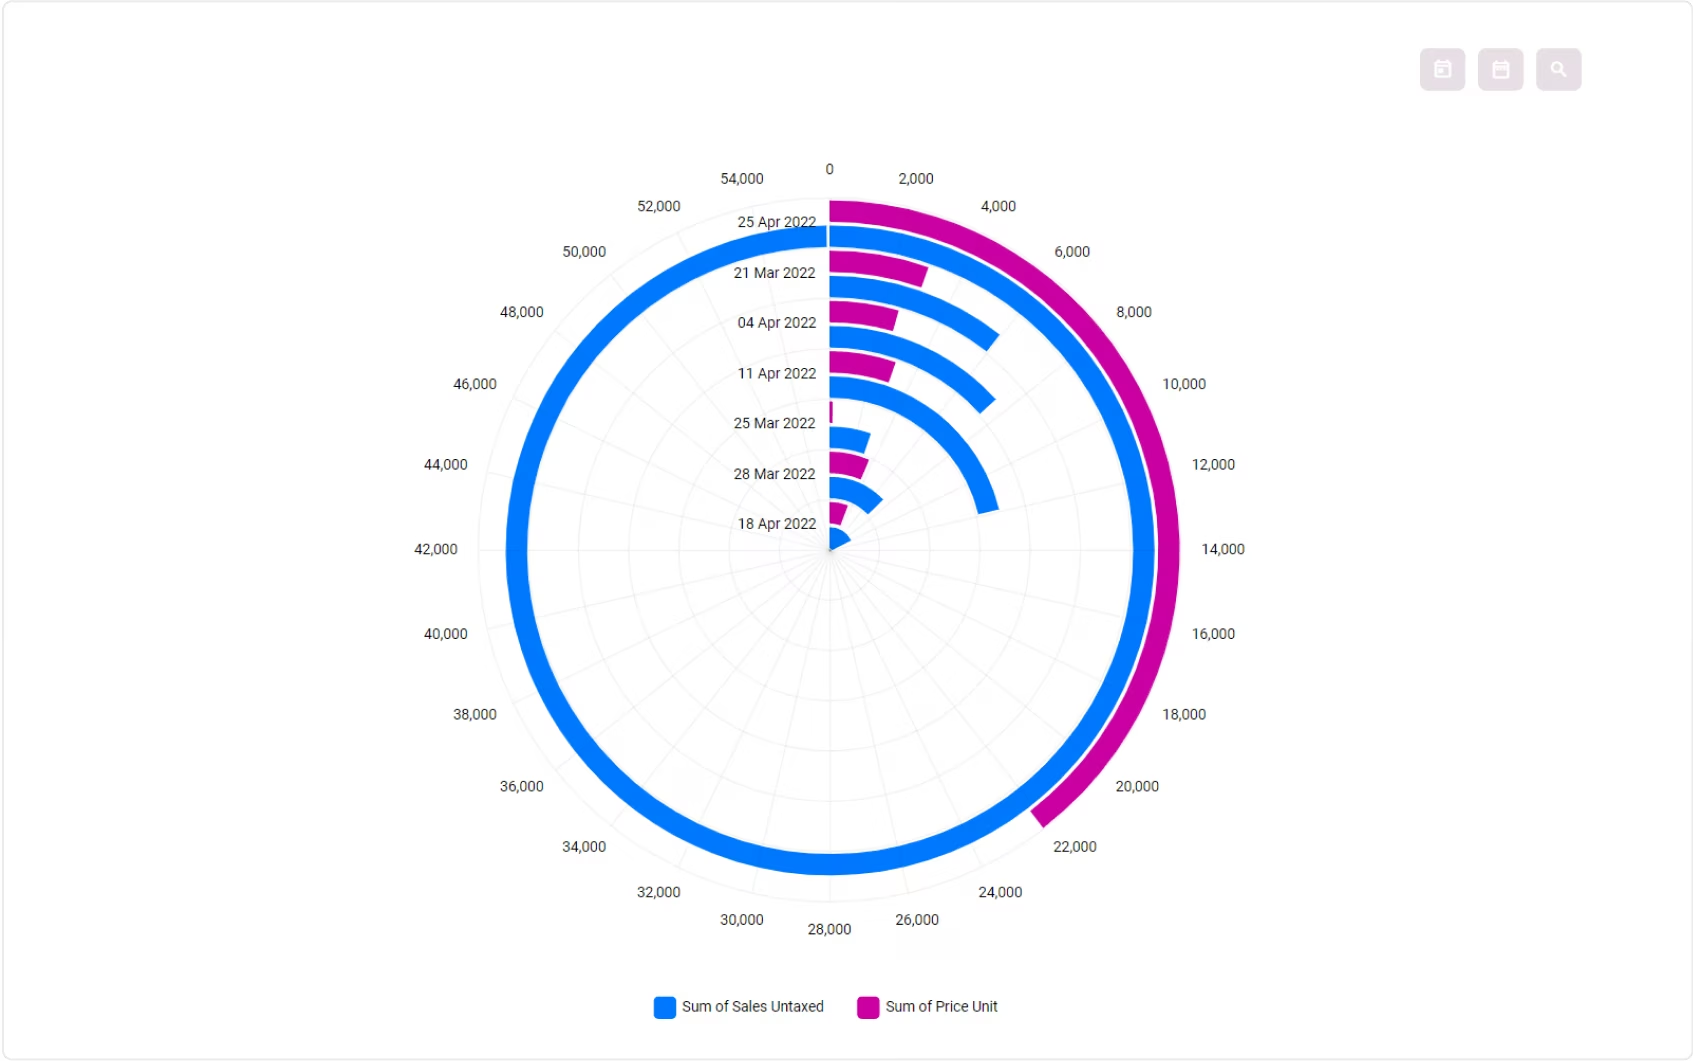
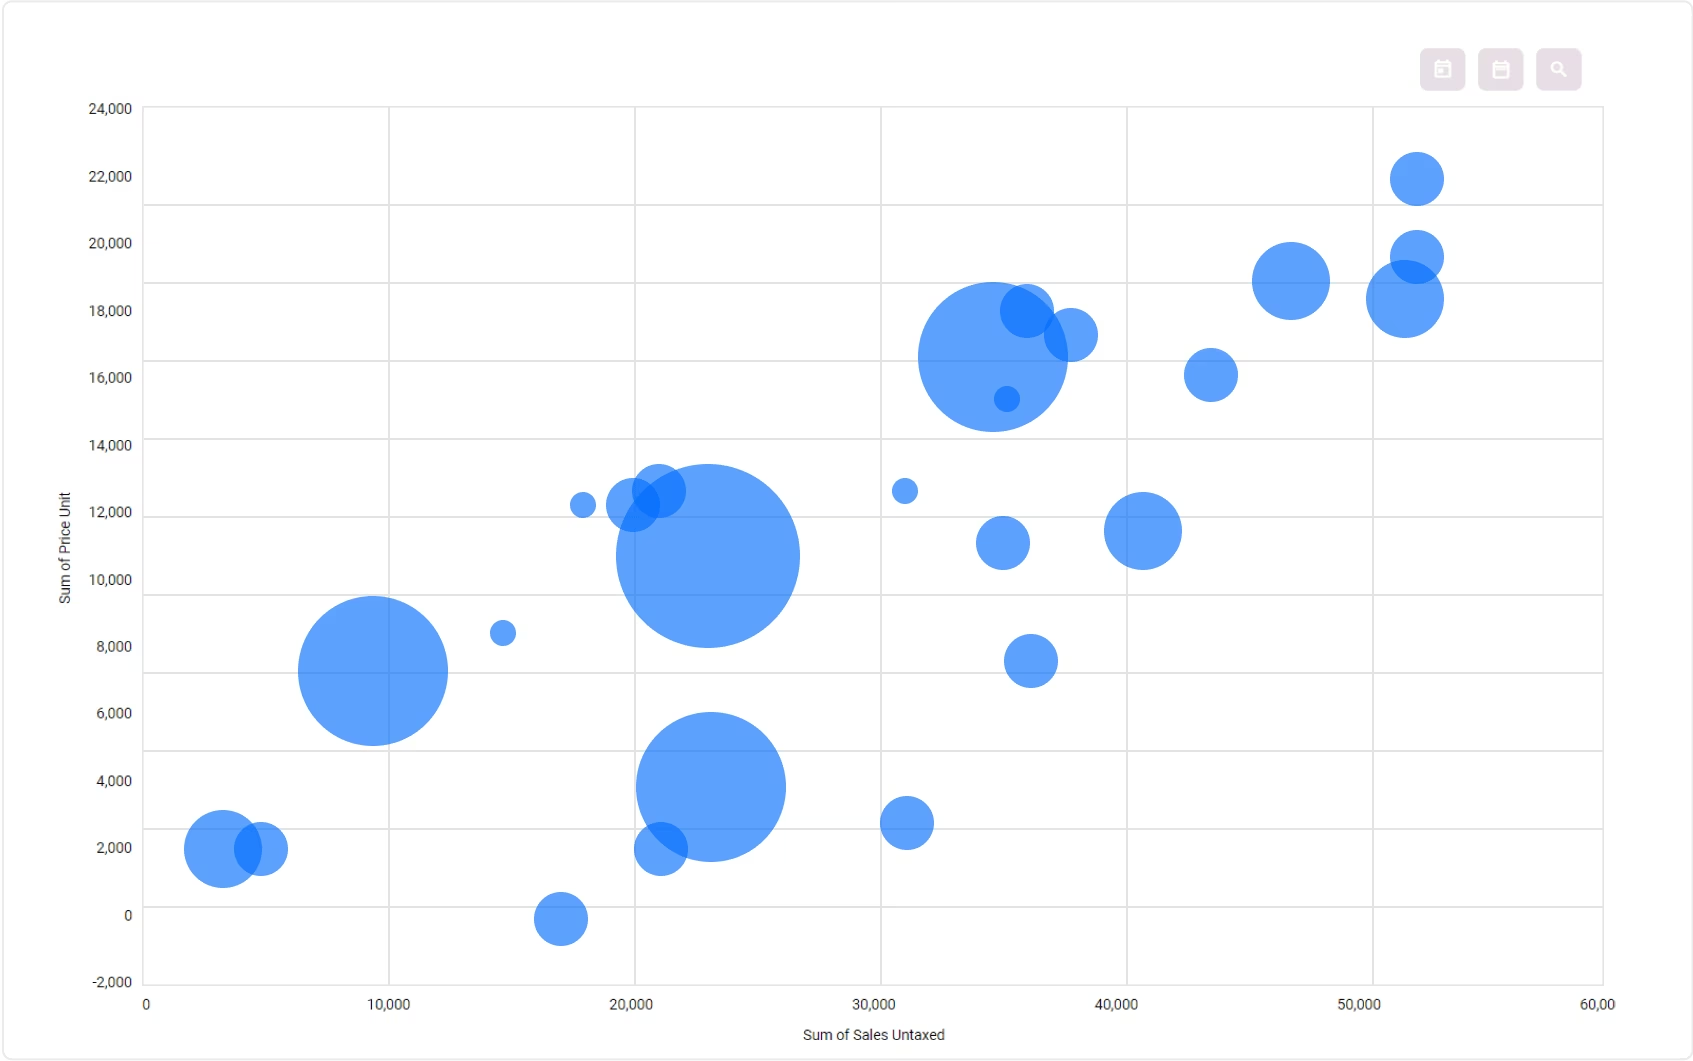
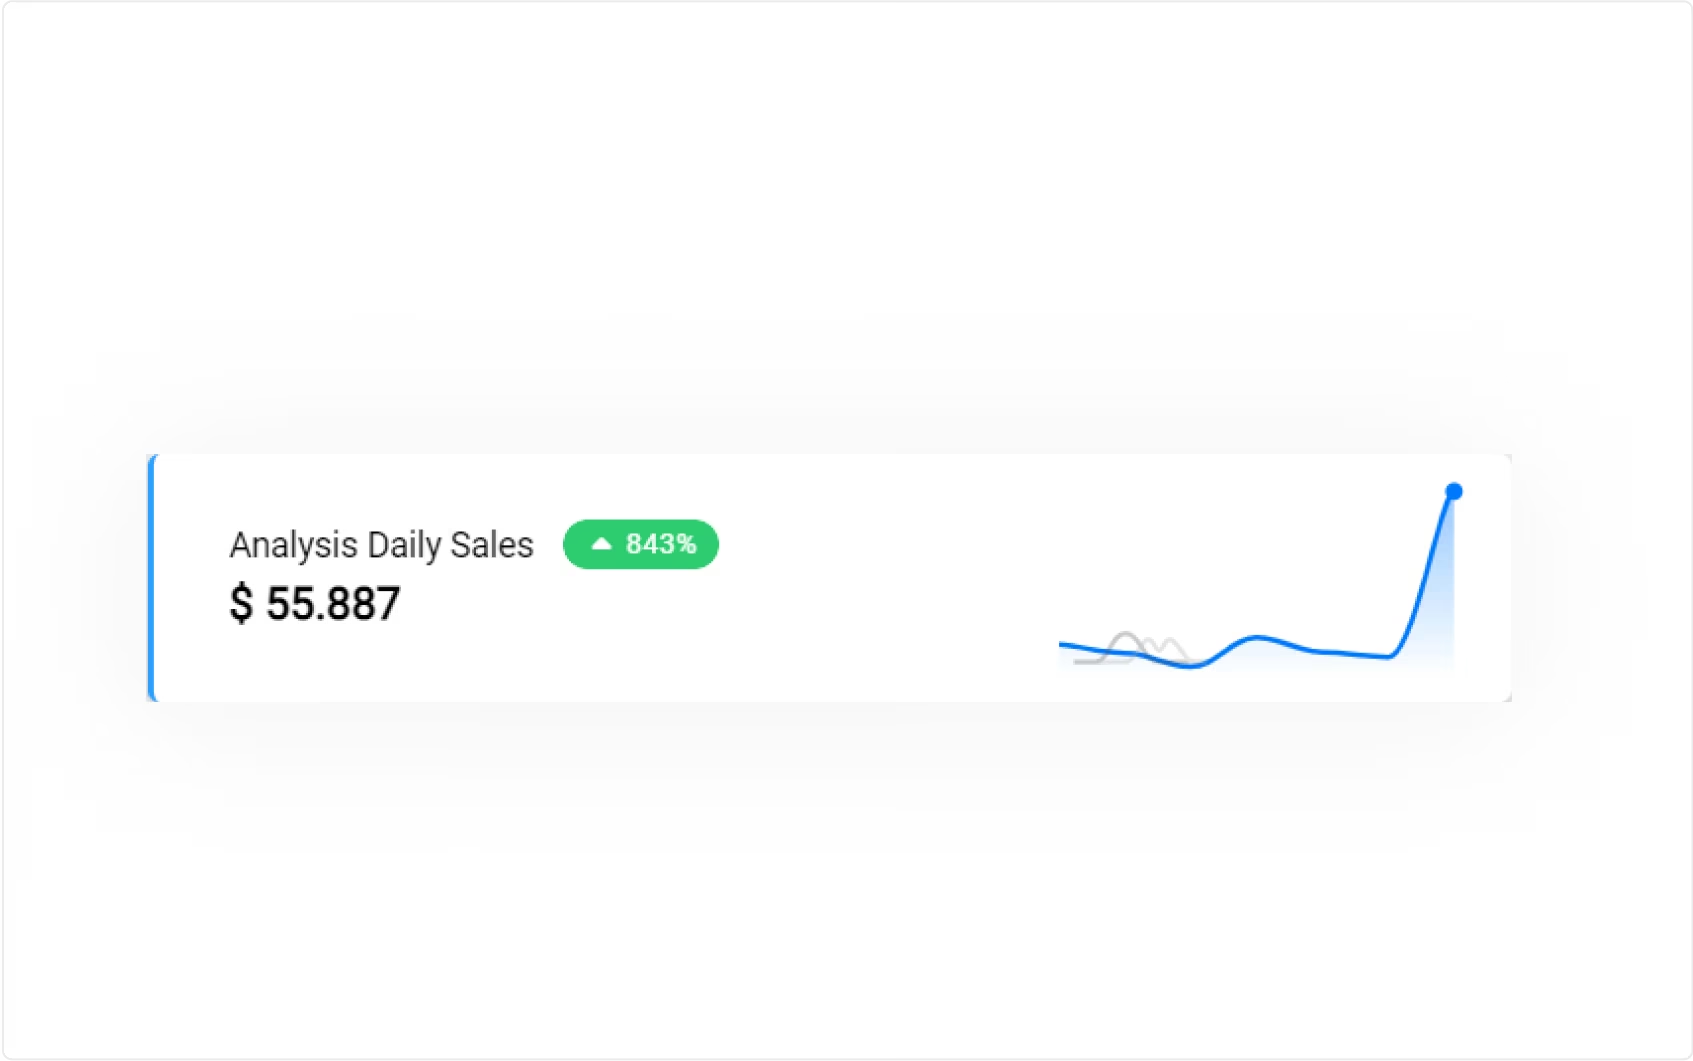
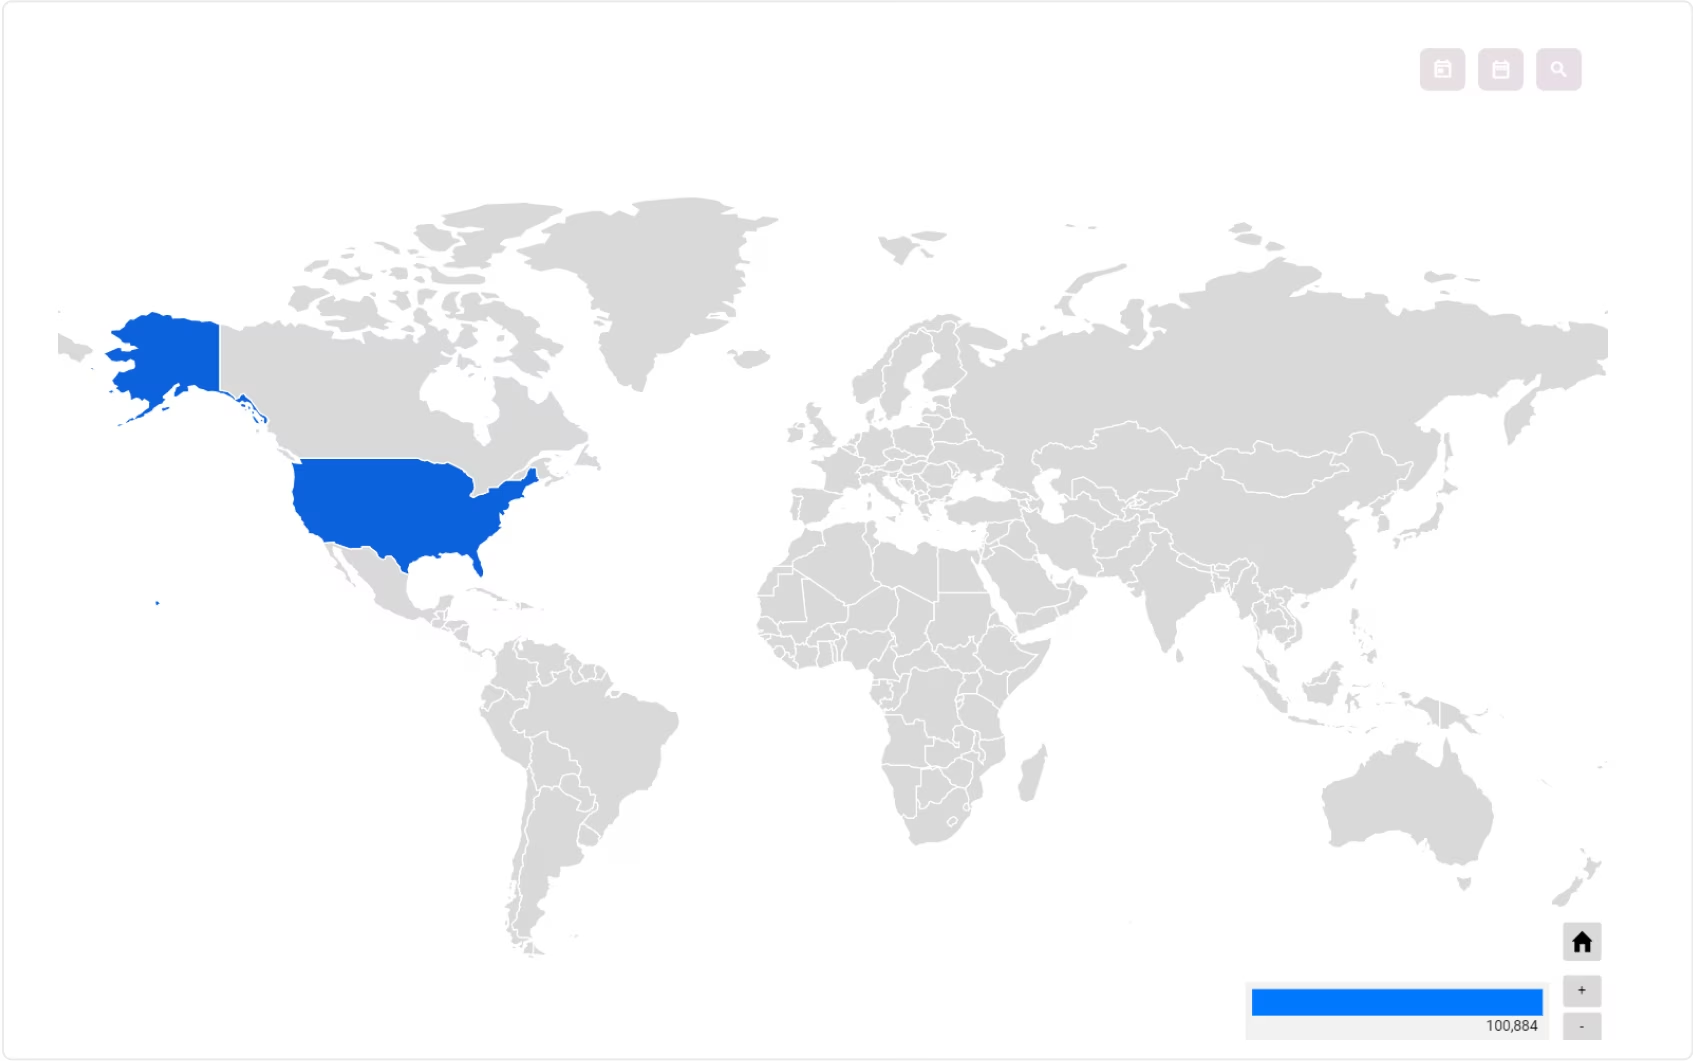
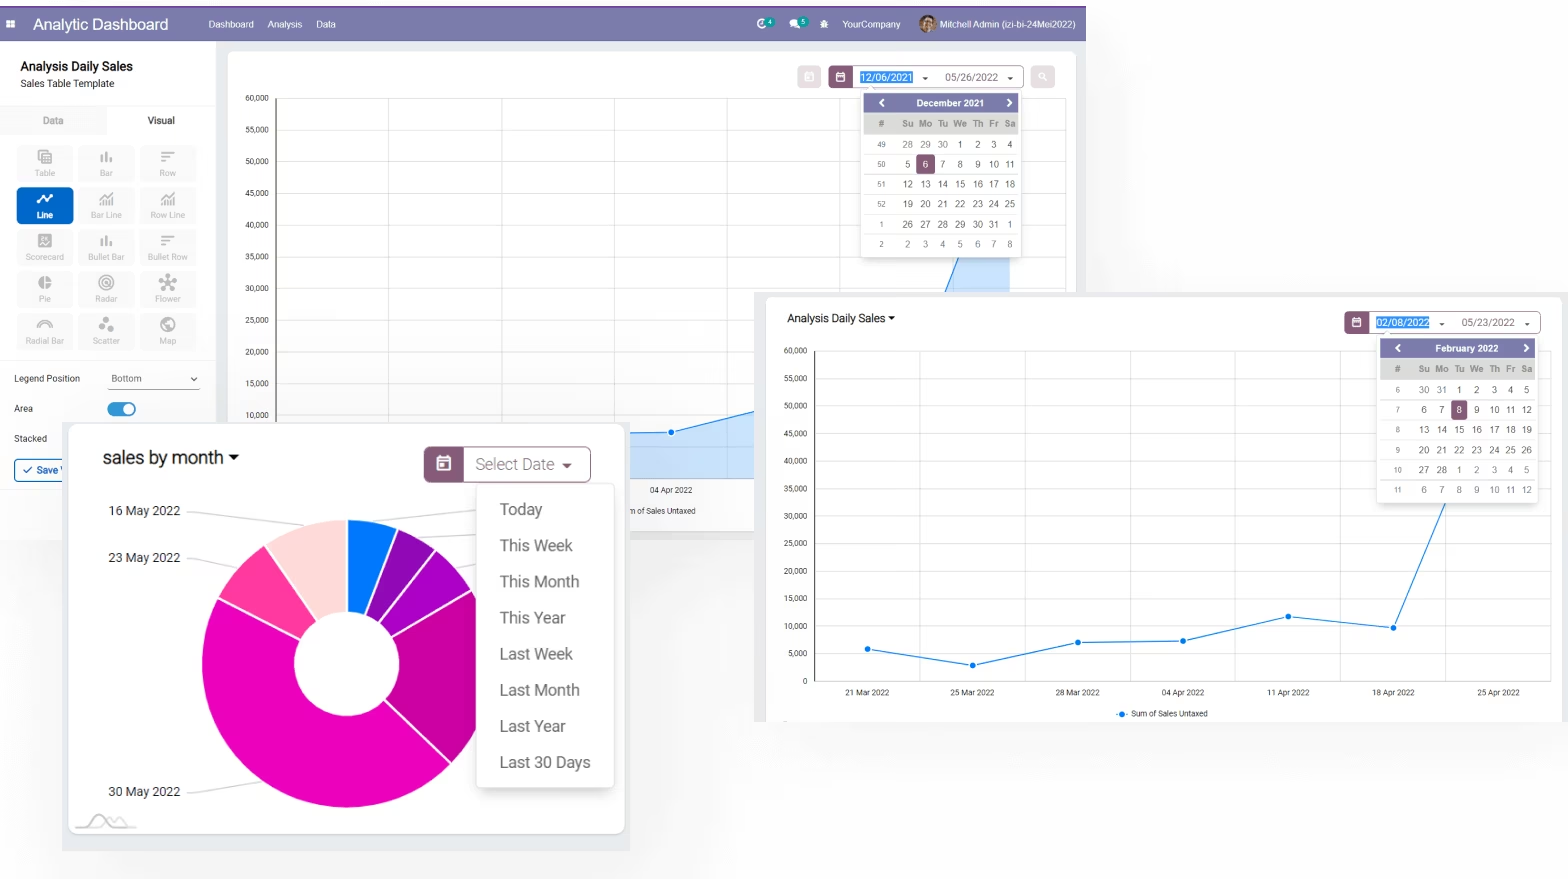
Many choices of visualization types. Table, Bar, row, line scatter, bullet, Bar Line chart, scorecard, etc.
Choose what visual you want and boom.. The chart will appear and your exploration begin !


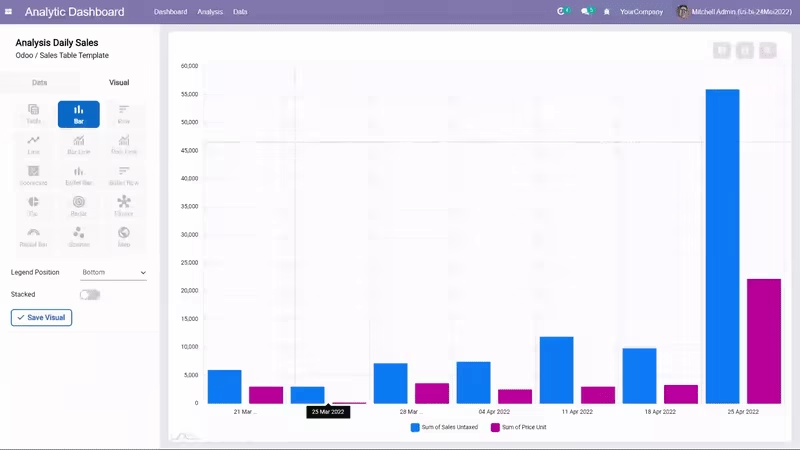
Easy Visual Customization
You can change the visual setting of an analysis by clicking the Visual tab.
There are several visual types available and more will be added later.
Every visual can also be configured in more detail such as changing the radius of a pie chart, the position of the legends, etc. with the visual settings
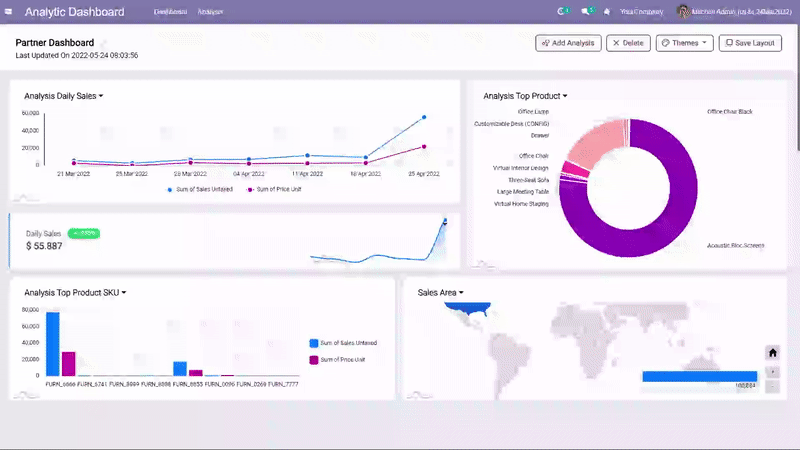
Make a Beautiful Dashboard
Chart position is dynamic. You can move, resize, edit and zoom in on the visual charts to see spesific data in detail.
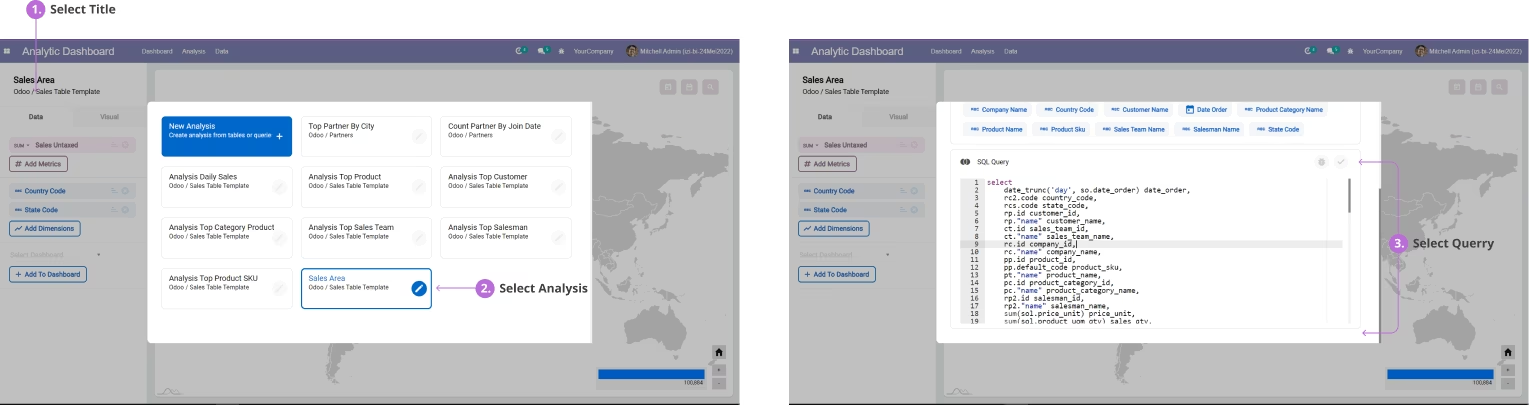
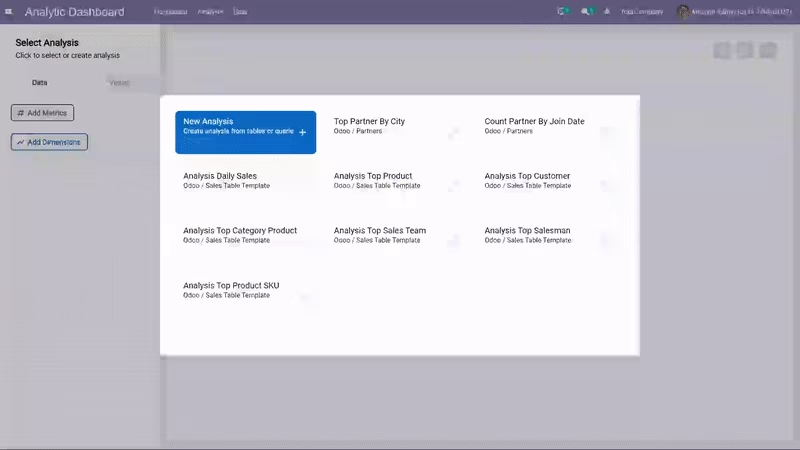
Ready Analysis Template
Even if you aren't an analyst, IZI Analytic Dashboard can make you feel like one.We provide some analysis business templates for you.
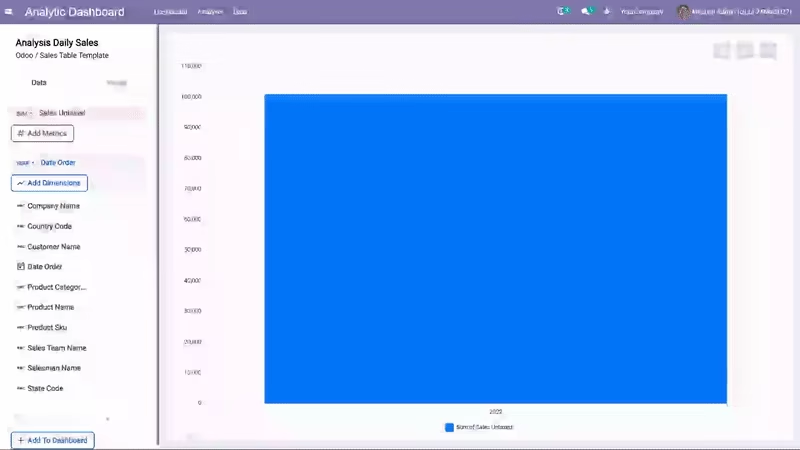
Easily Set the Metrics and Dimensions of an Analysis
All the fields from the analysis table will appear on the left panel. You can easily setup your metrics and dimensions by clicking on them.
You can also set the order (ascending or descending), the calculation applied for the metrics, and the format for each dimensions.
Dynamic Filters
Filters can be dynamically added in the analysis to make data exploration easier.You can still play with the filter in the dashboard view, on the top right of the chart.
Unlock The Power of Queries
Working with something really complex ?No problem, there's a full editor for those who prefer to write their own SQL.
If you want to modify the data query, you can edit the analysis and input the new query there.