This module serves as a robust data connector that allows to retrieve data directly from external MySQL databases. Mainly designed for reporting and analytics use cases, it enables MySQL tables to function as valid data sources. Licensed and secure, the connector extends capability to integrate with disparate data systems and support advanced business intelligence workflows.
Establishes direct, secure connections from to external MySQL databases
Makes external MySQL data available within reporting and analytics framework
Fully licensed and compatible with data handling policies
Supports both Online, .sh, and on-premise environments
Expands reporting horizons by leveraging external MySQL data
Enables advanced analytics without duplicating data
Enhances data integration flexibility while maintaining system architecture integrity
Reduces overhead in data consolidation by consuming live external data sources
Analytics Dashboard
Ways to Accelerate
Your Business Insights
Upgrade your to the next level with Analytics Dashboard.Make analysis accessible with interactive and customizable data visualizations.
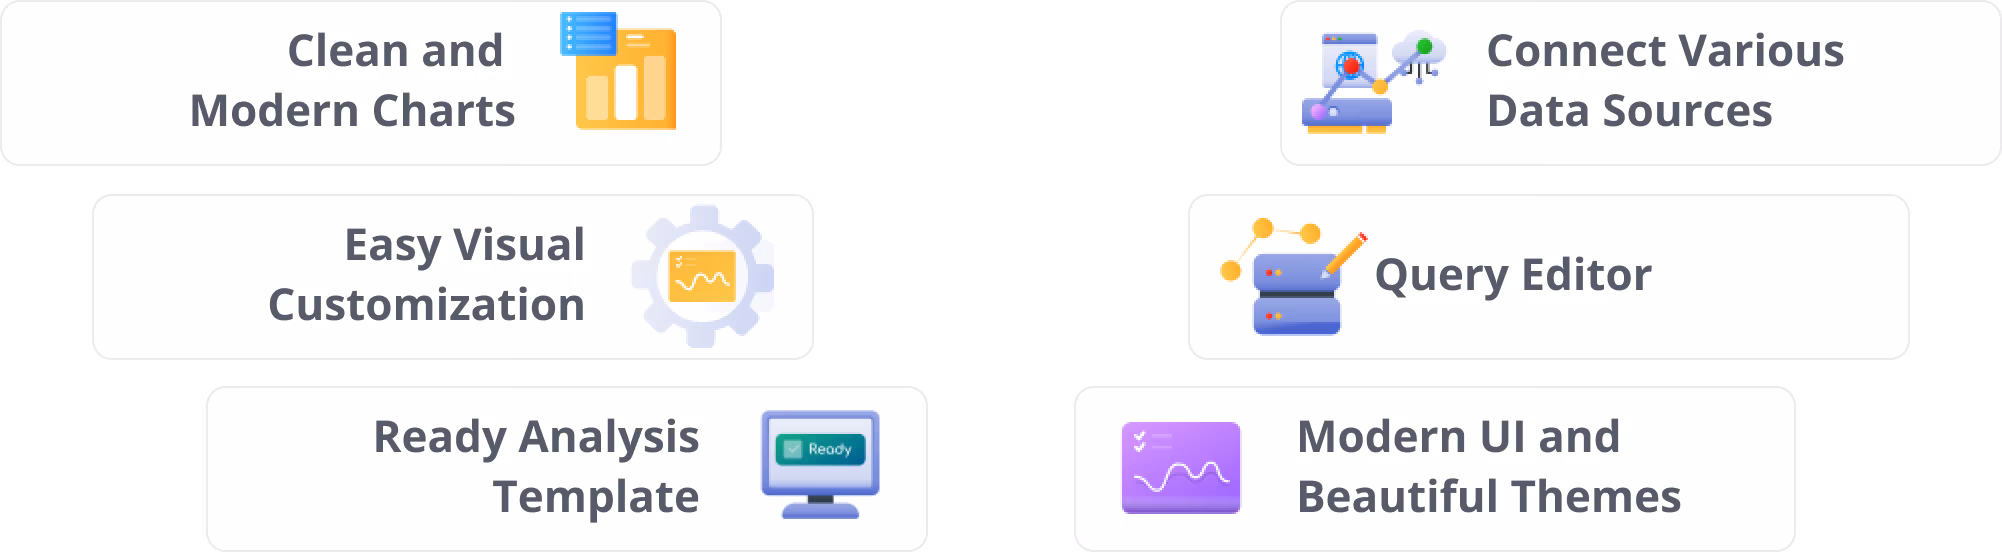
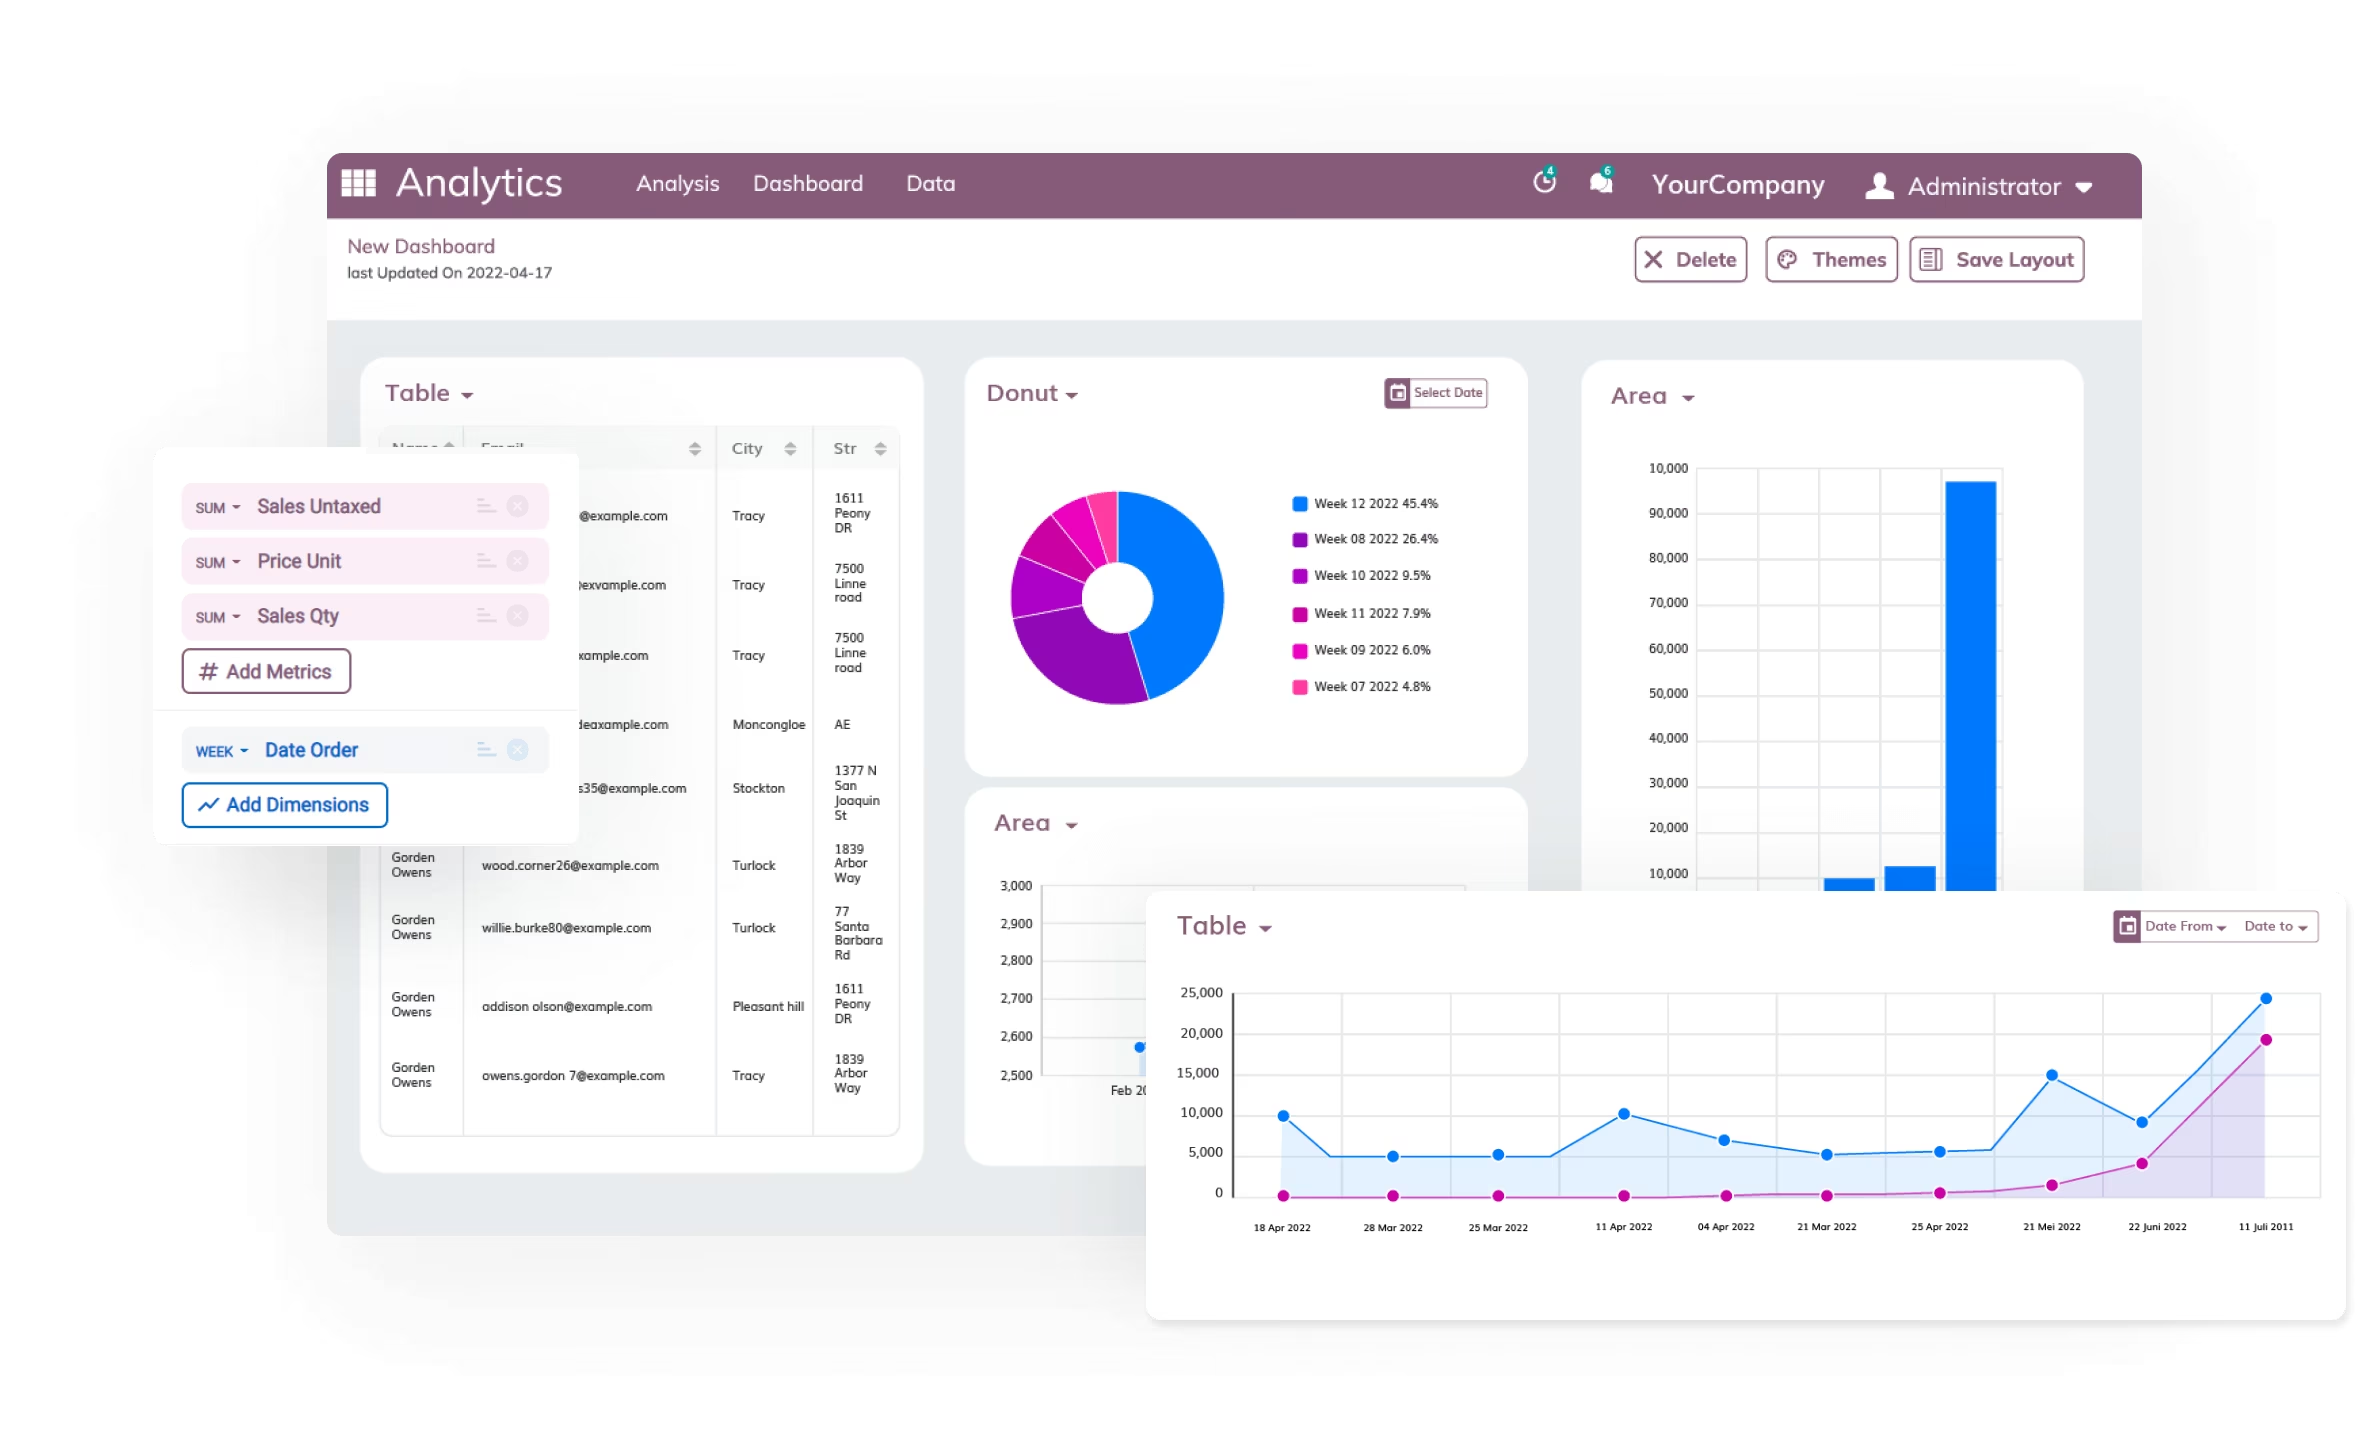
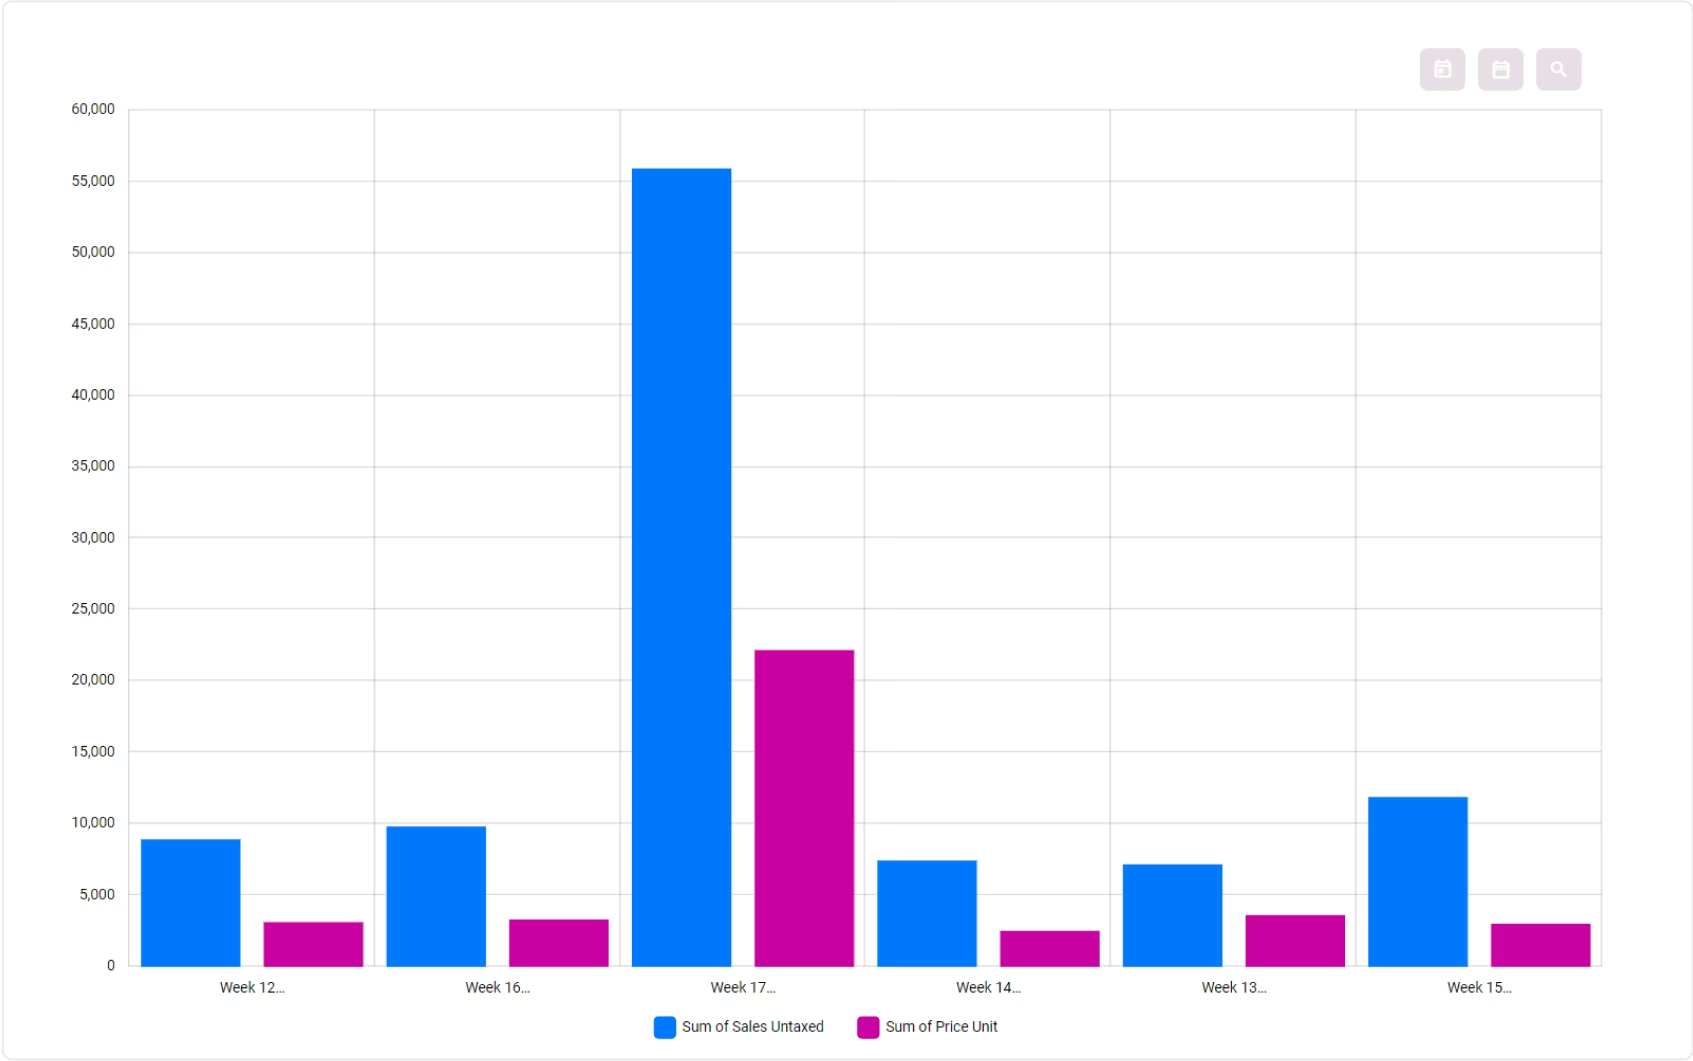
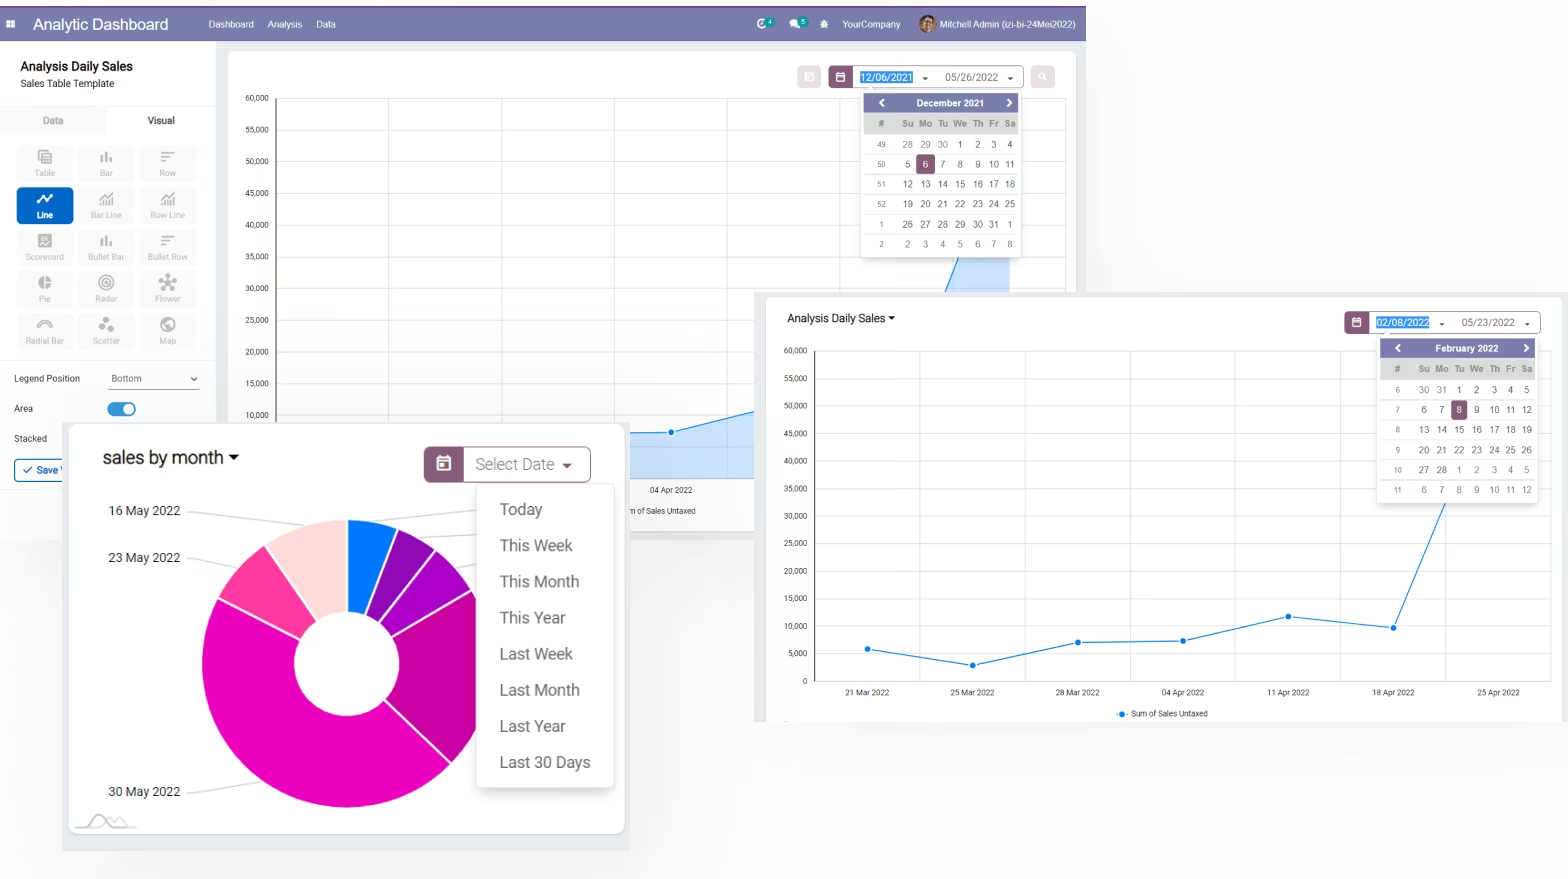
Clean & Modern Charts
for Your Business
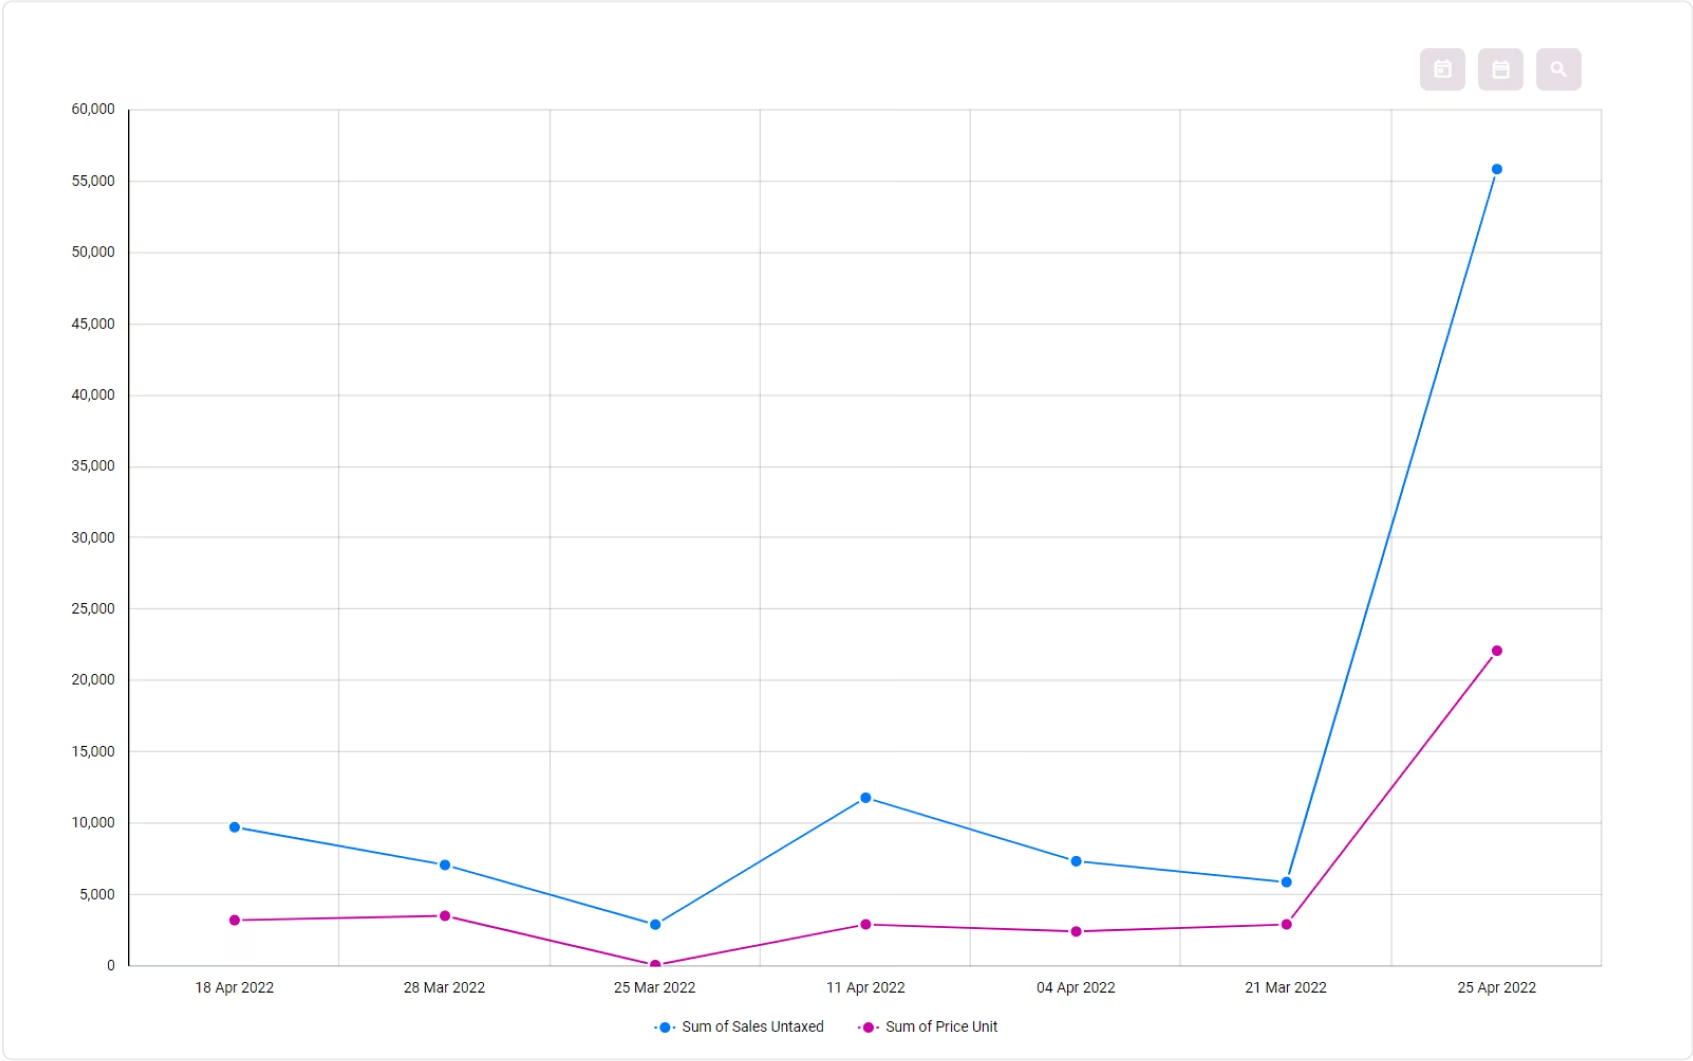
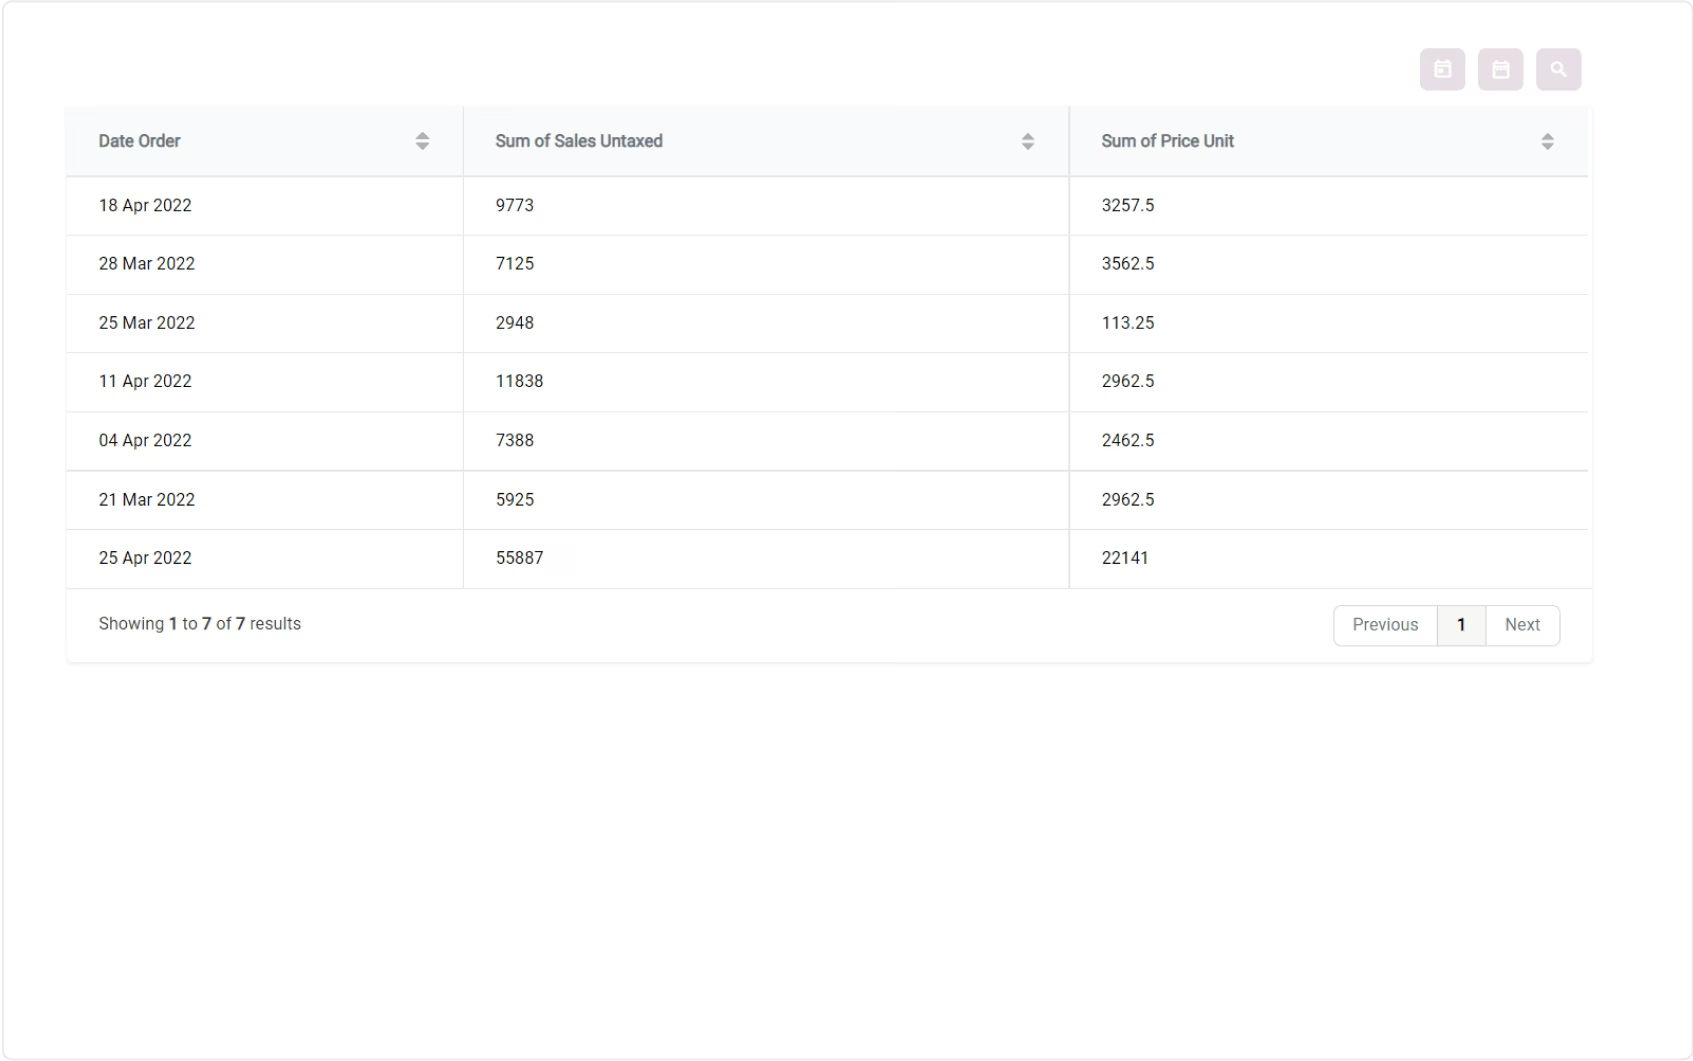
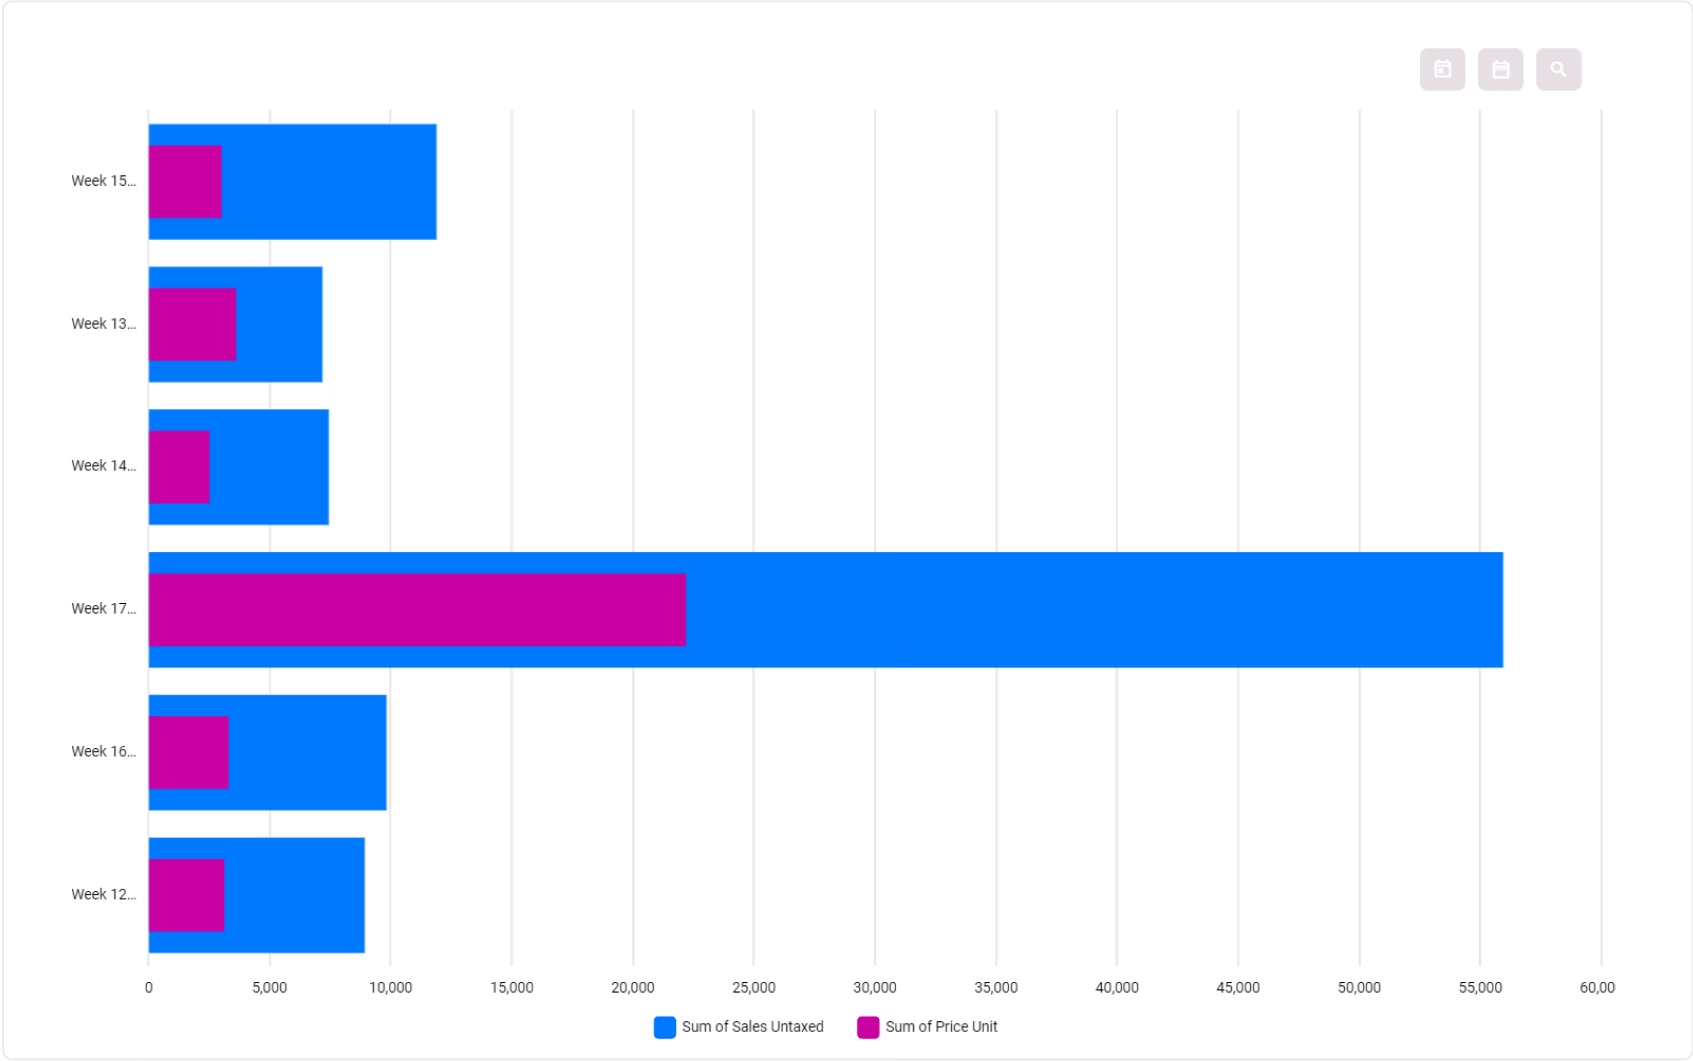
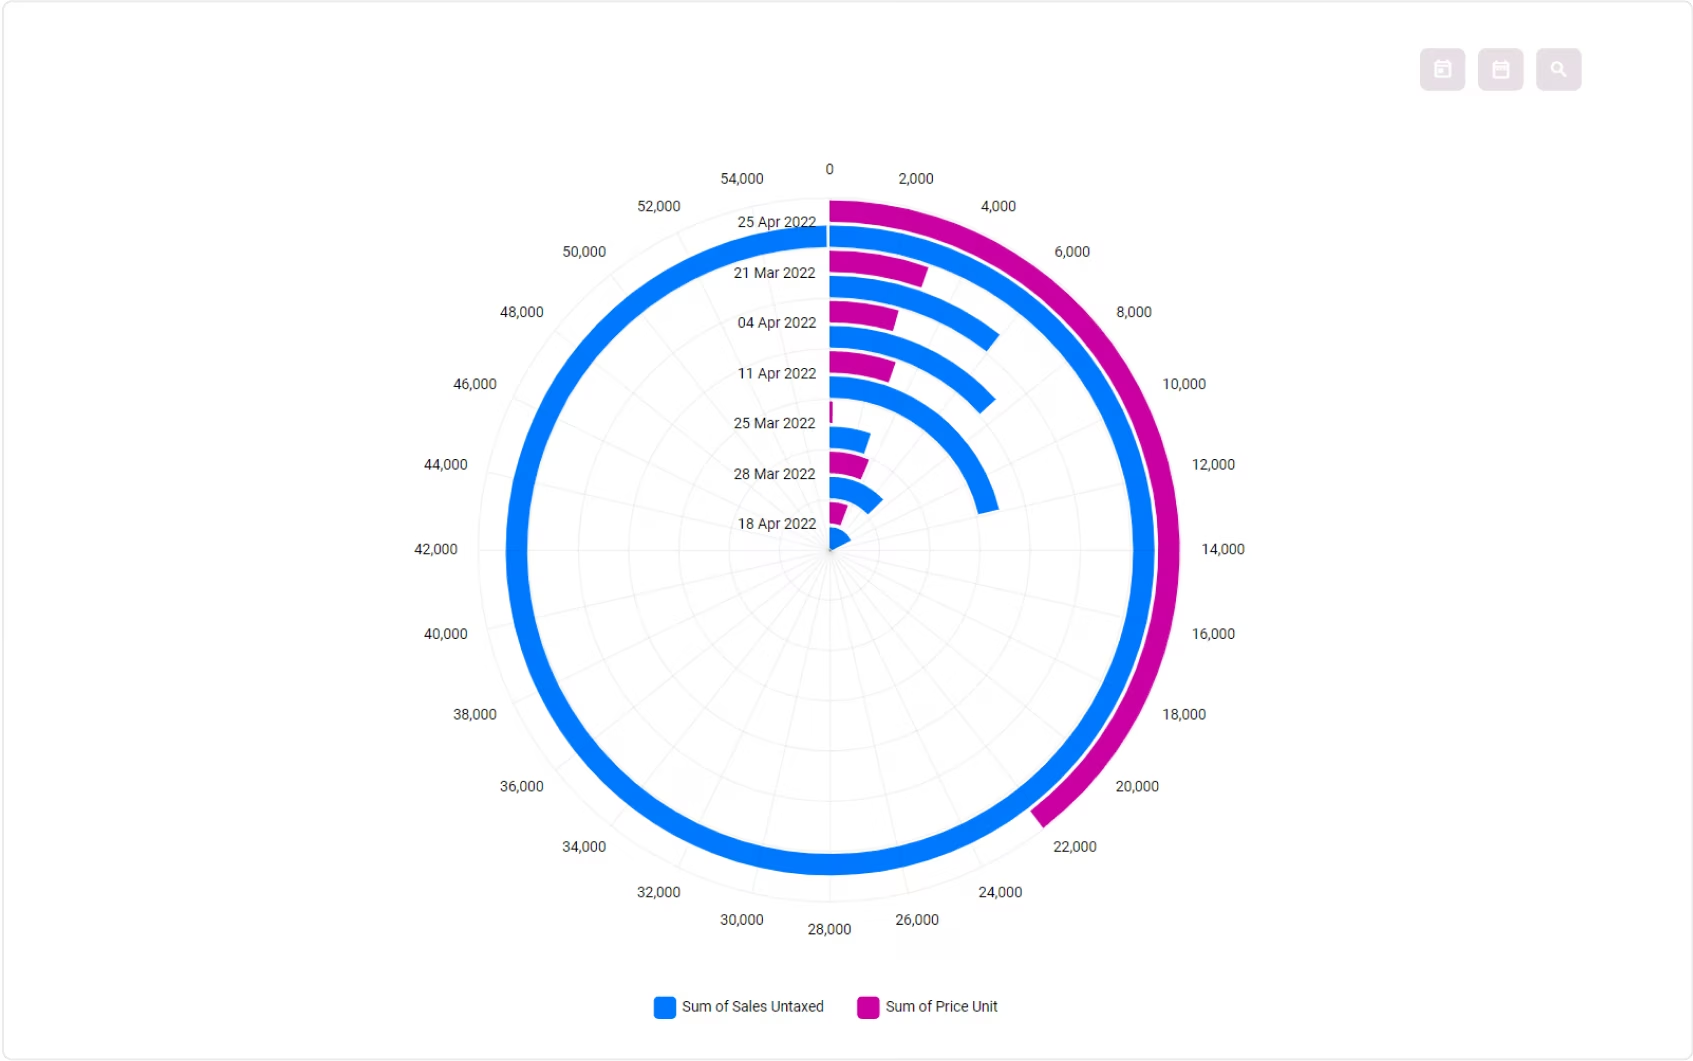
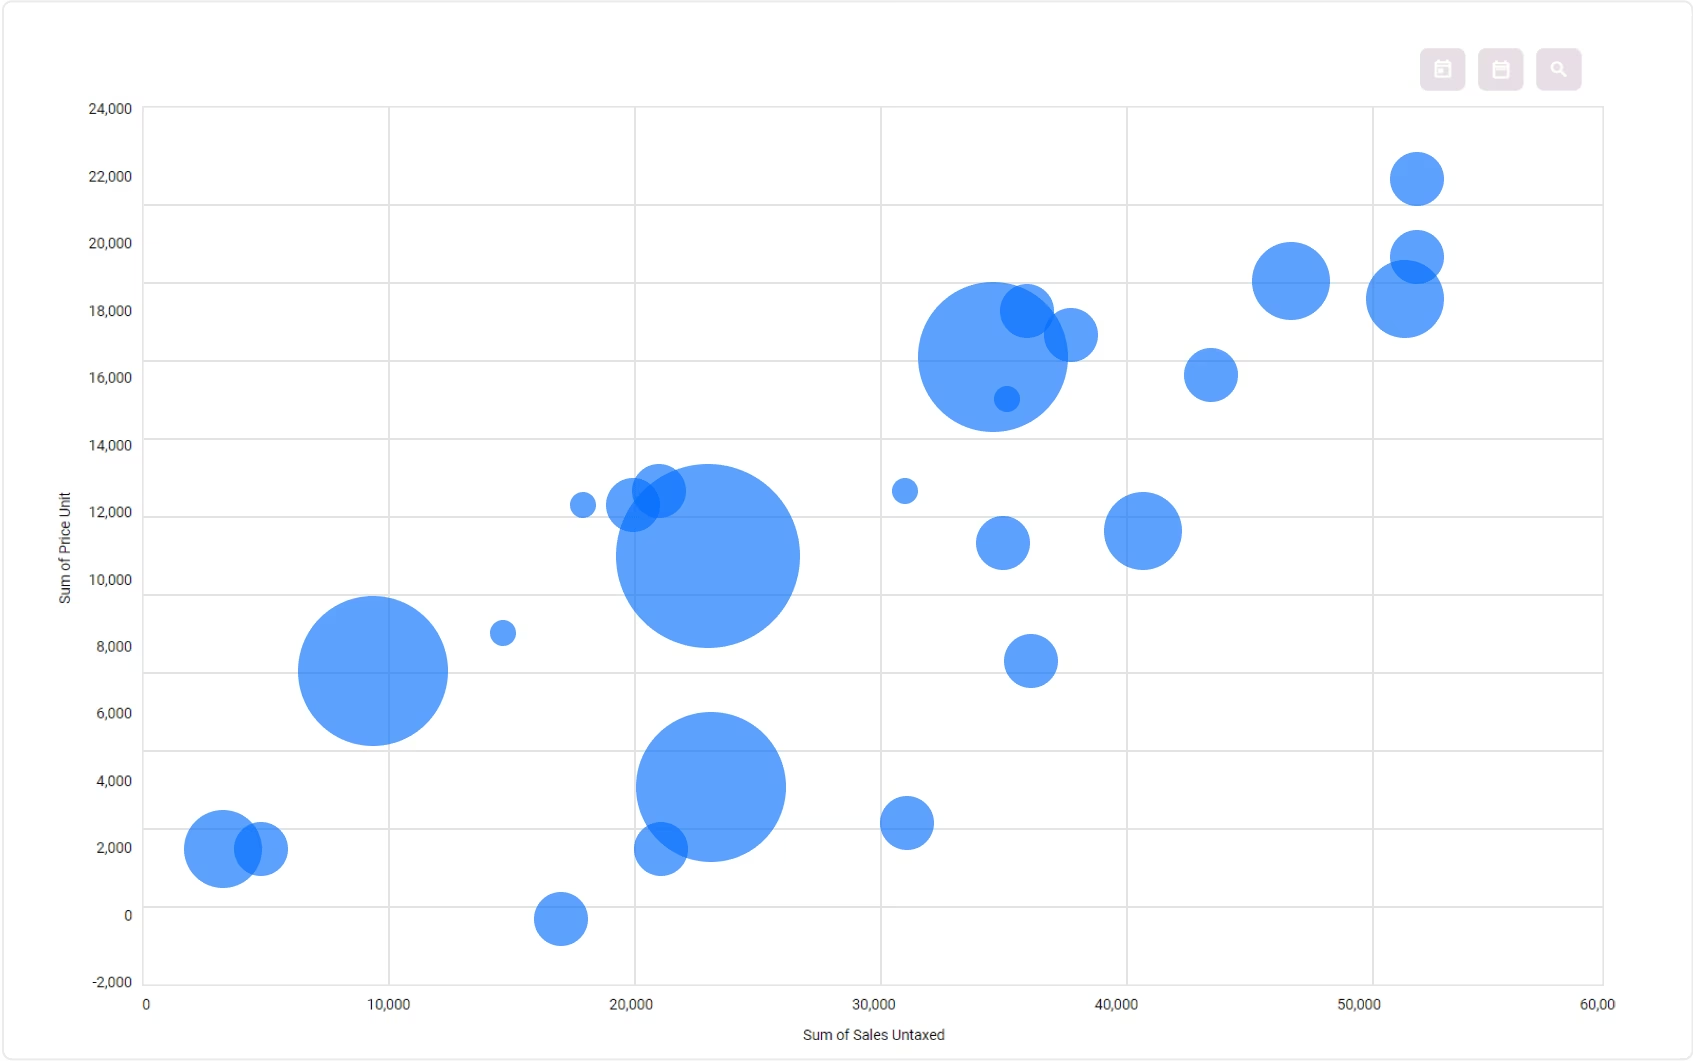
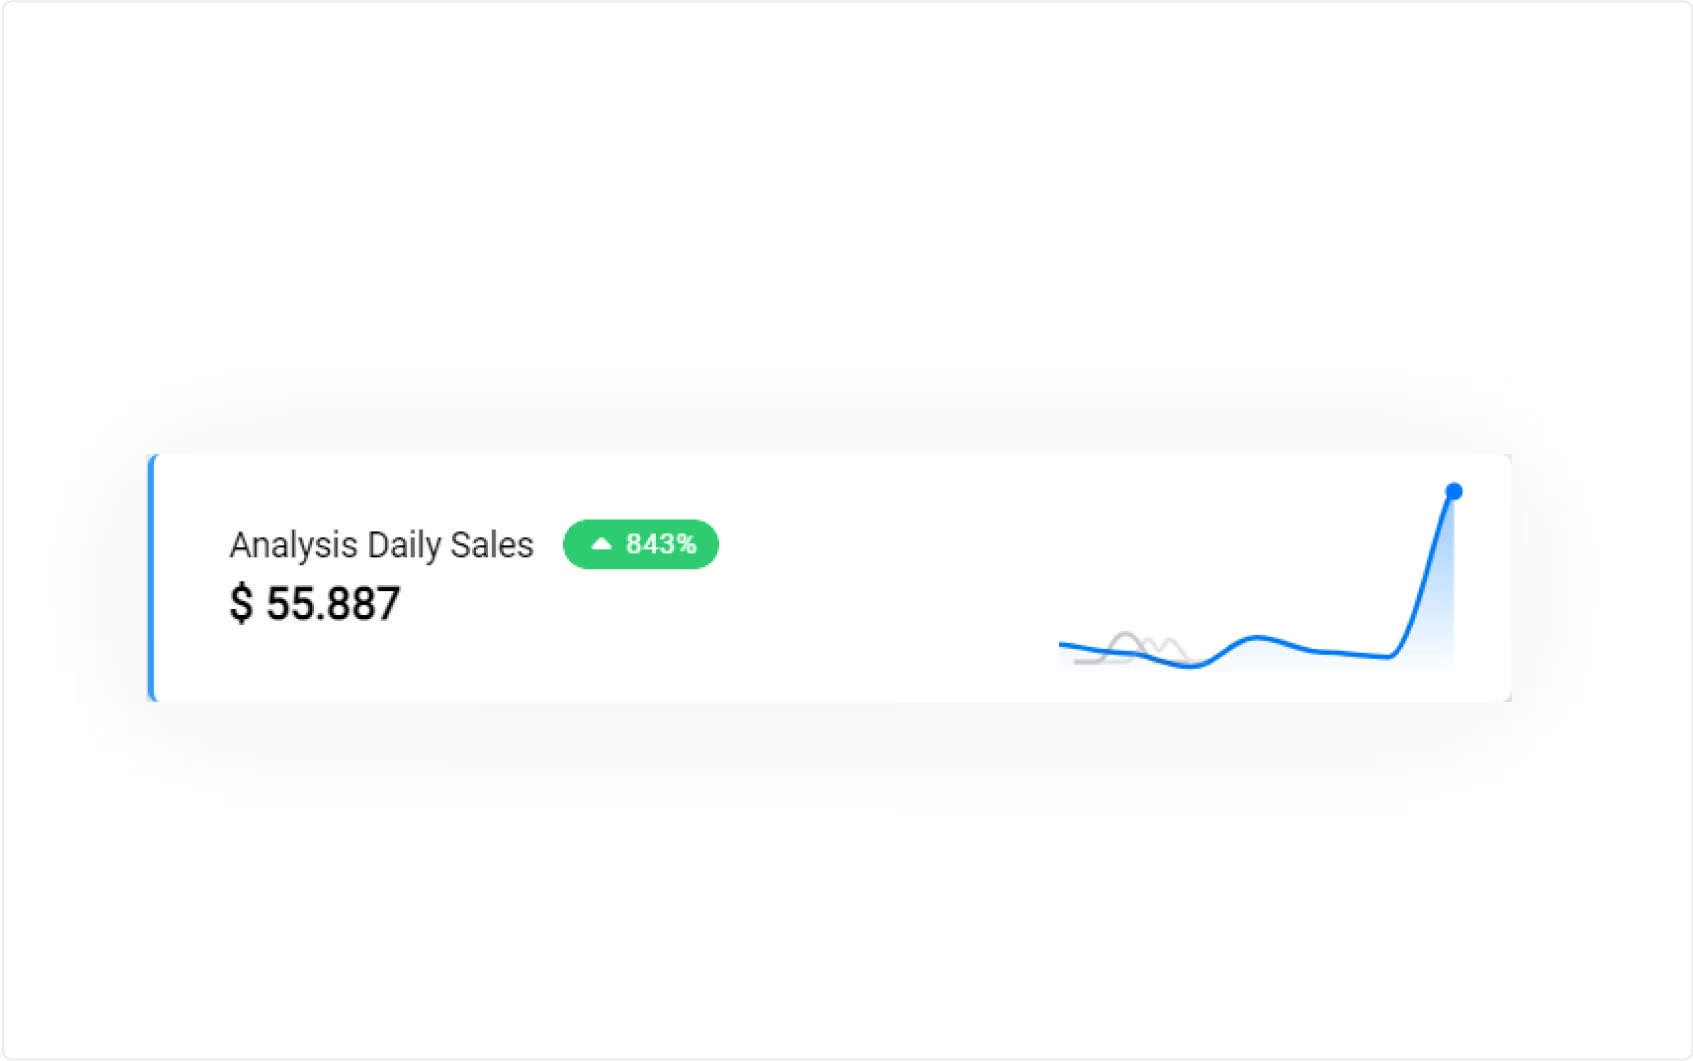
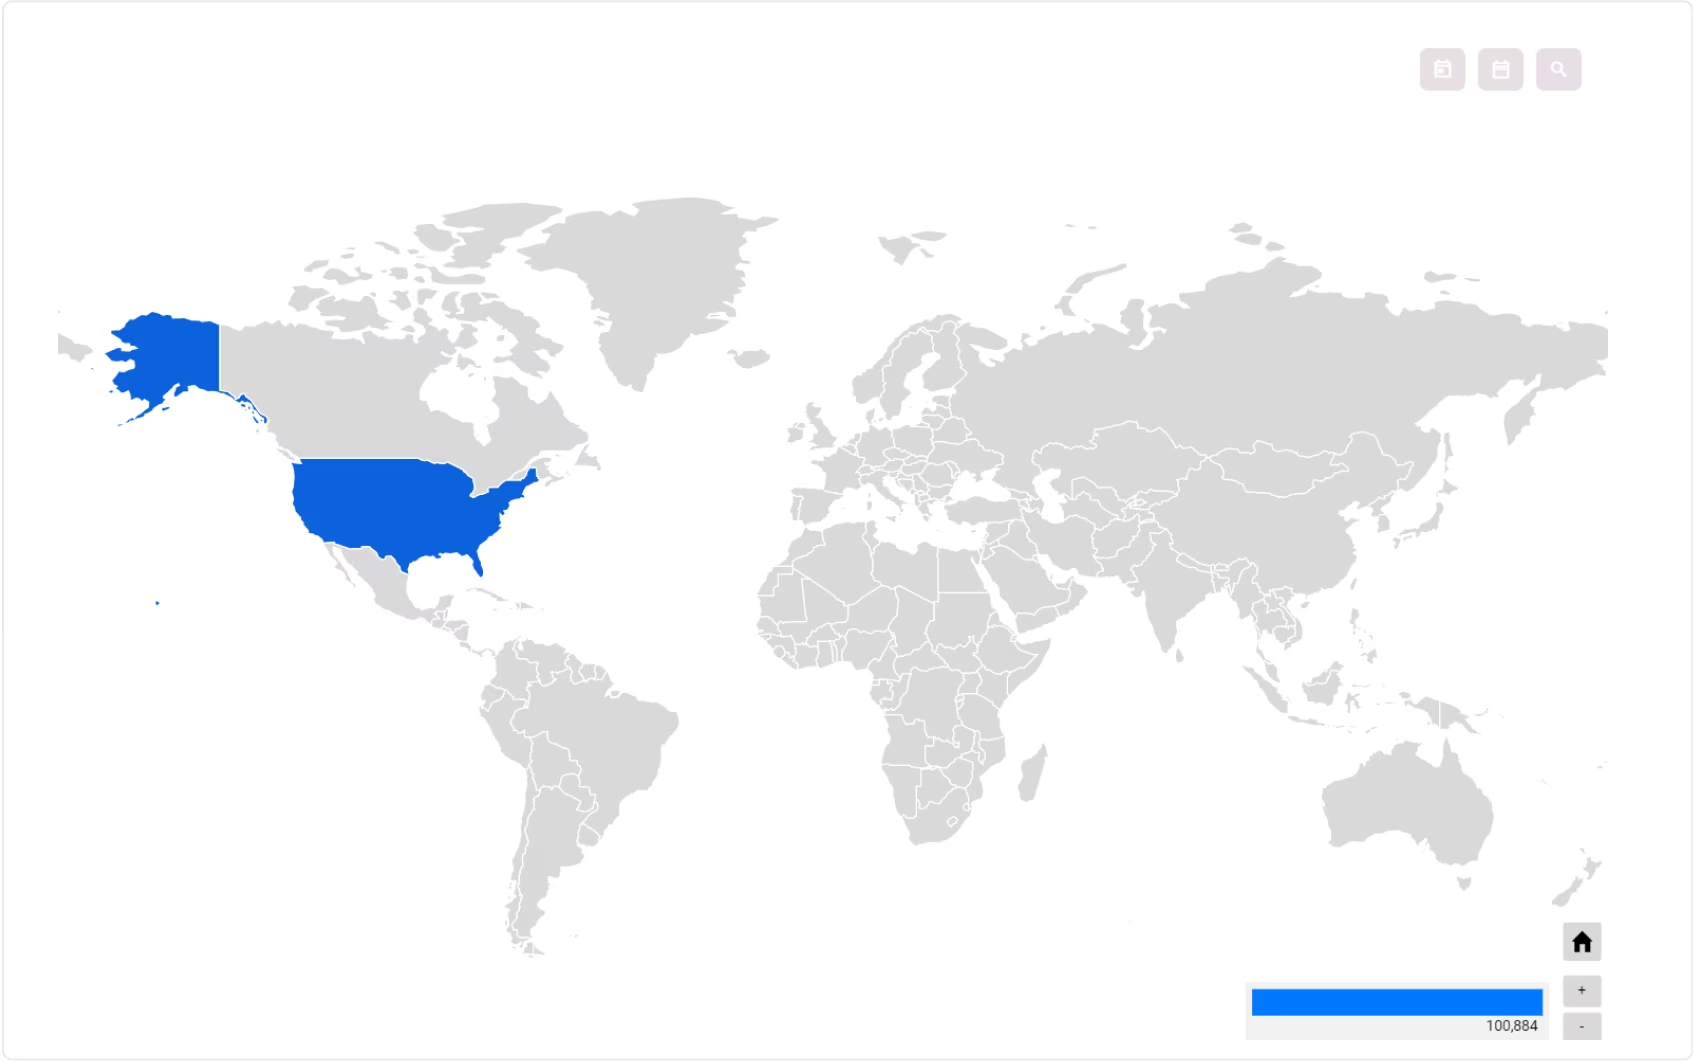
Many choices of visualization types. Table, Bar, row, line scatter, bullet, Bar Line chart, scorecard, etc.
Choose what visual you want and boom.. The chart will appear and your exploration begin !


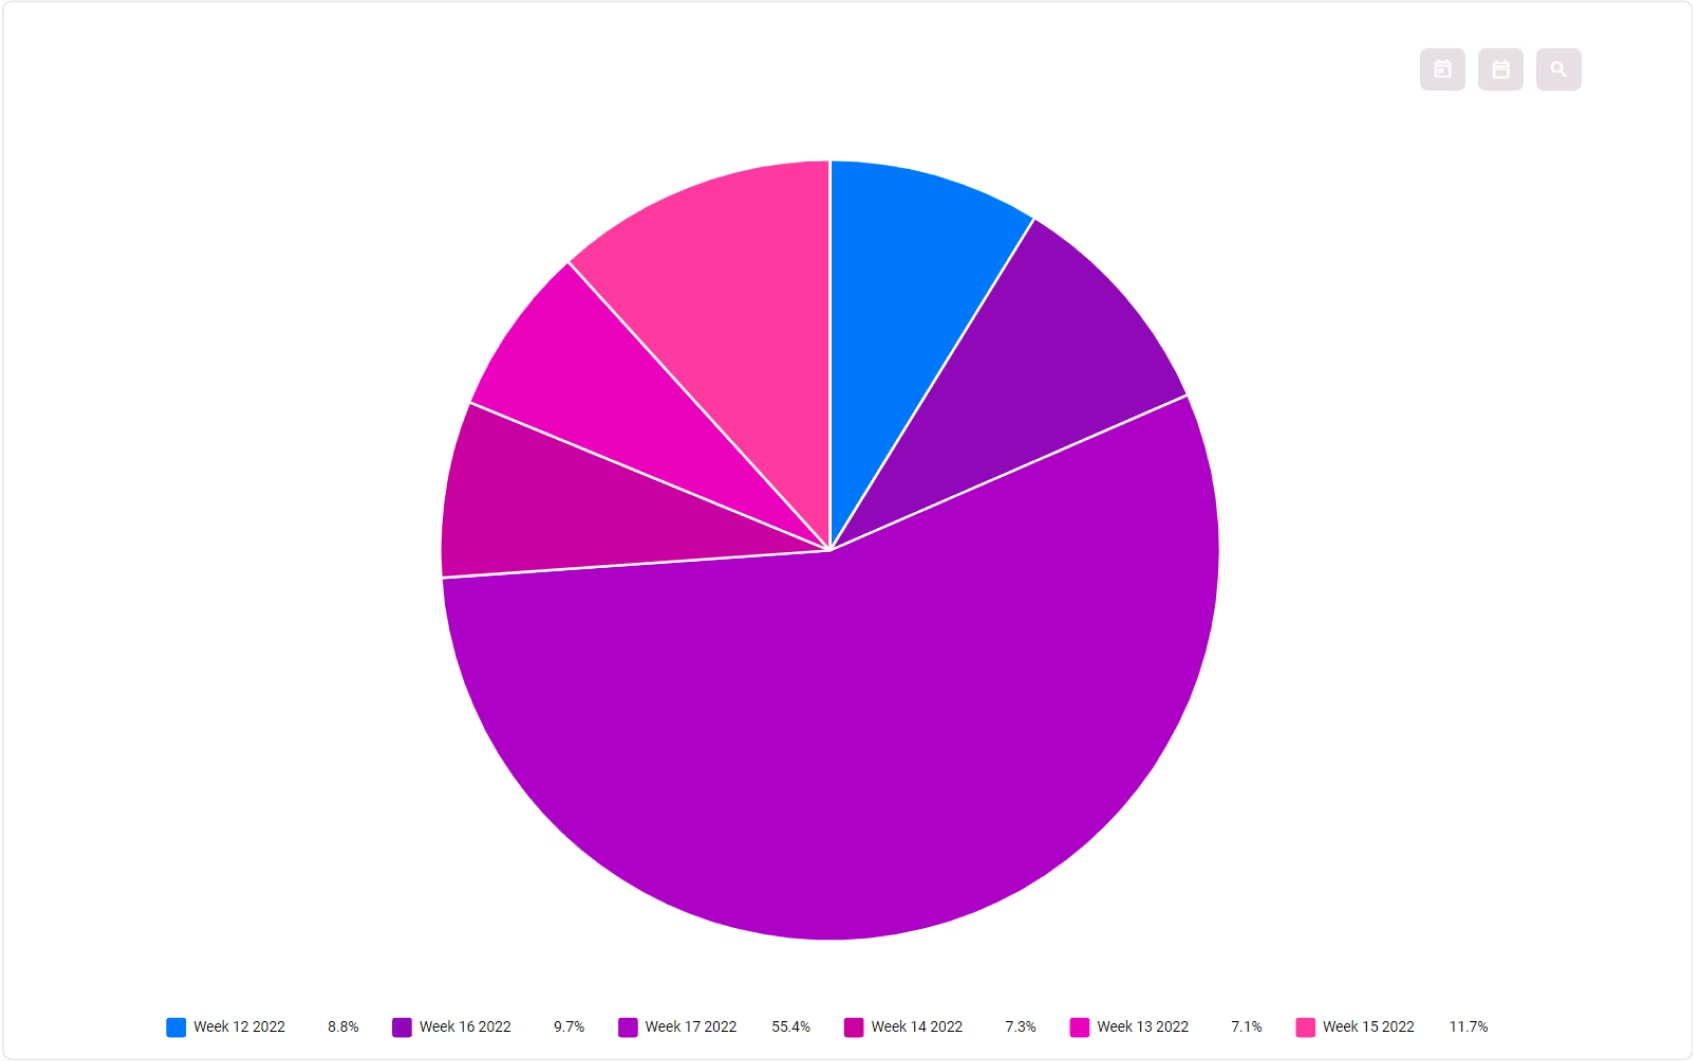
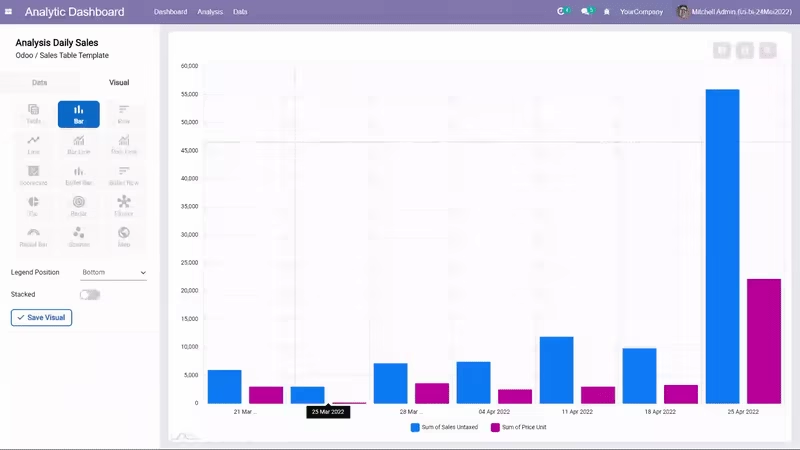
Easy Visual Customization
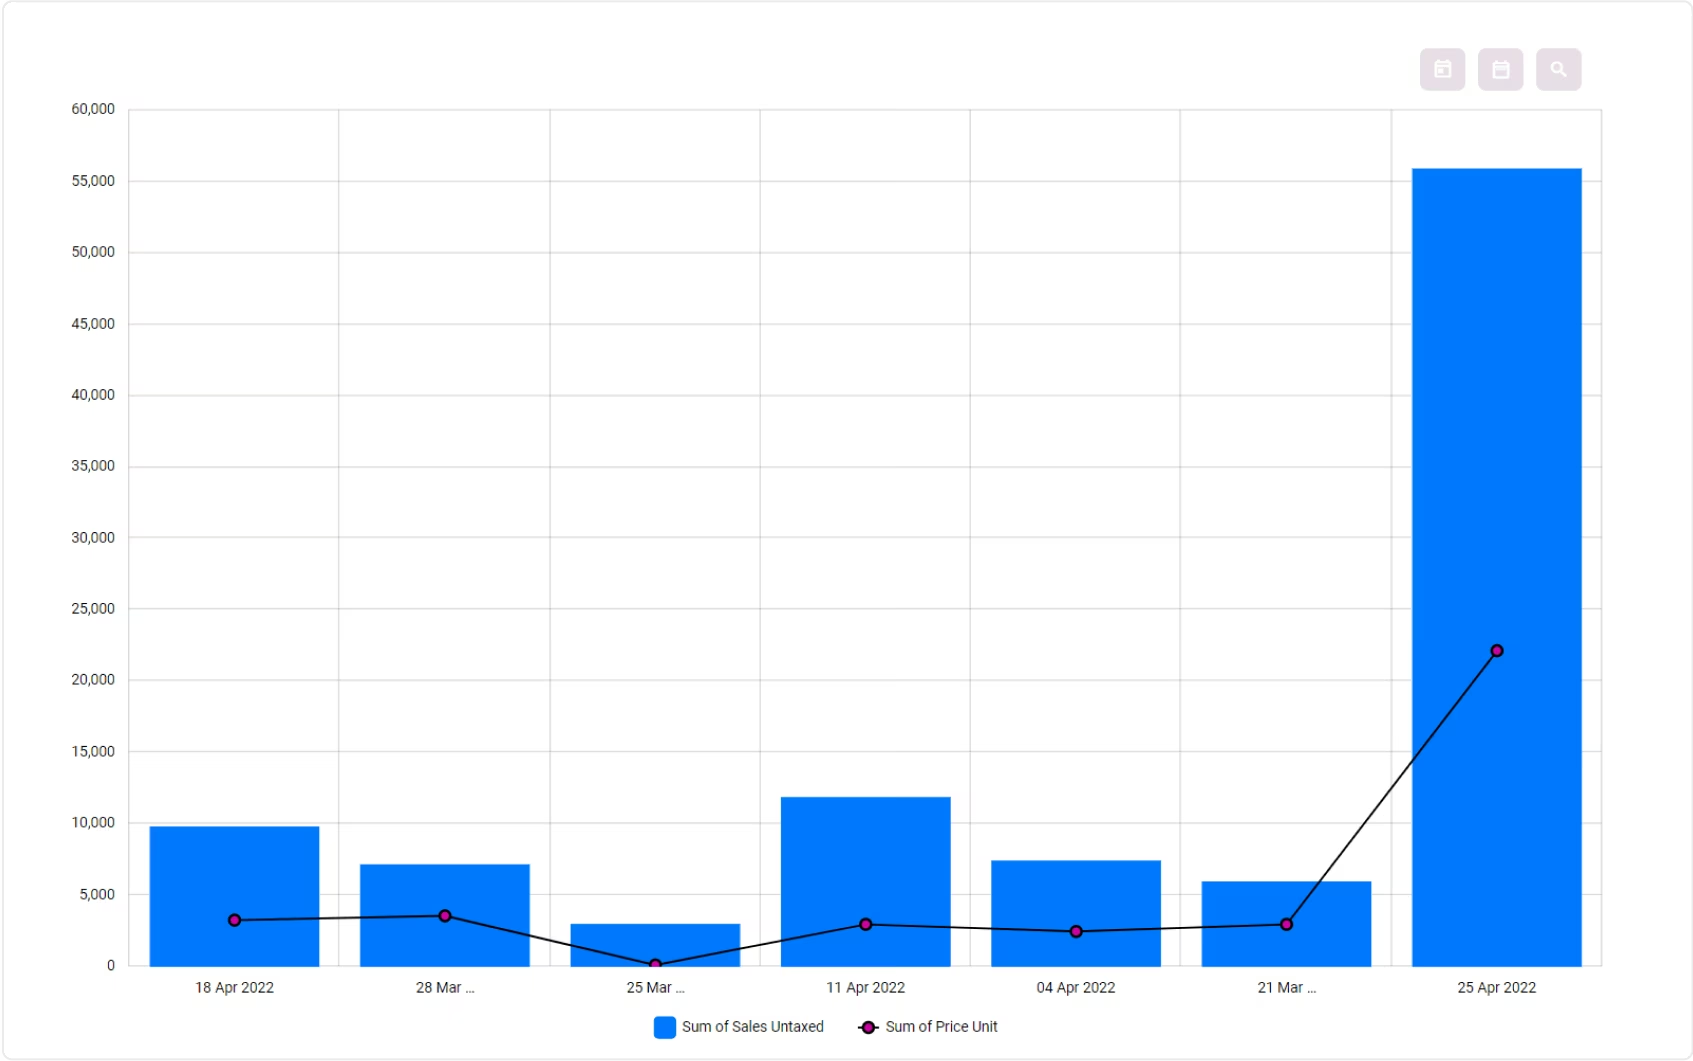
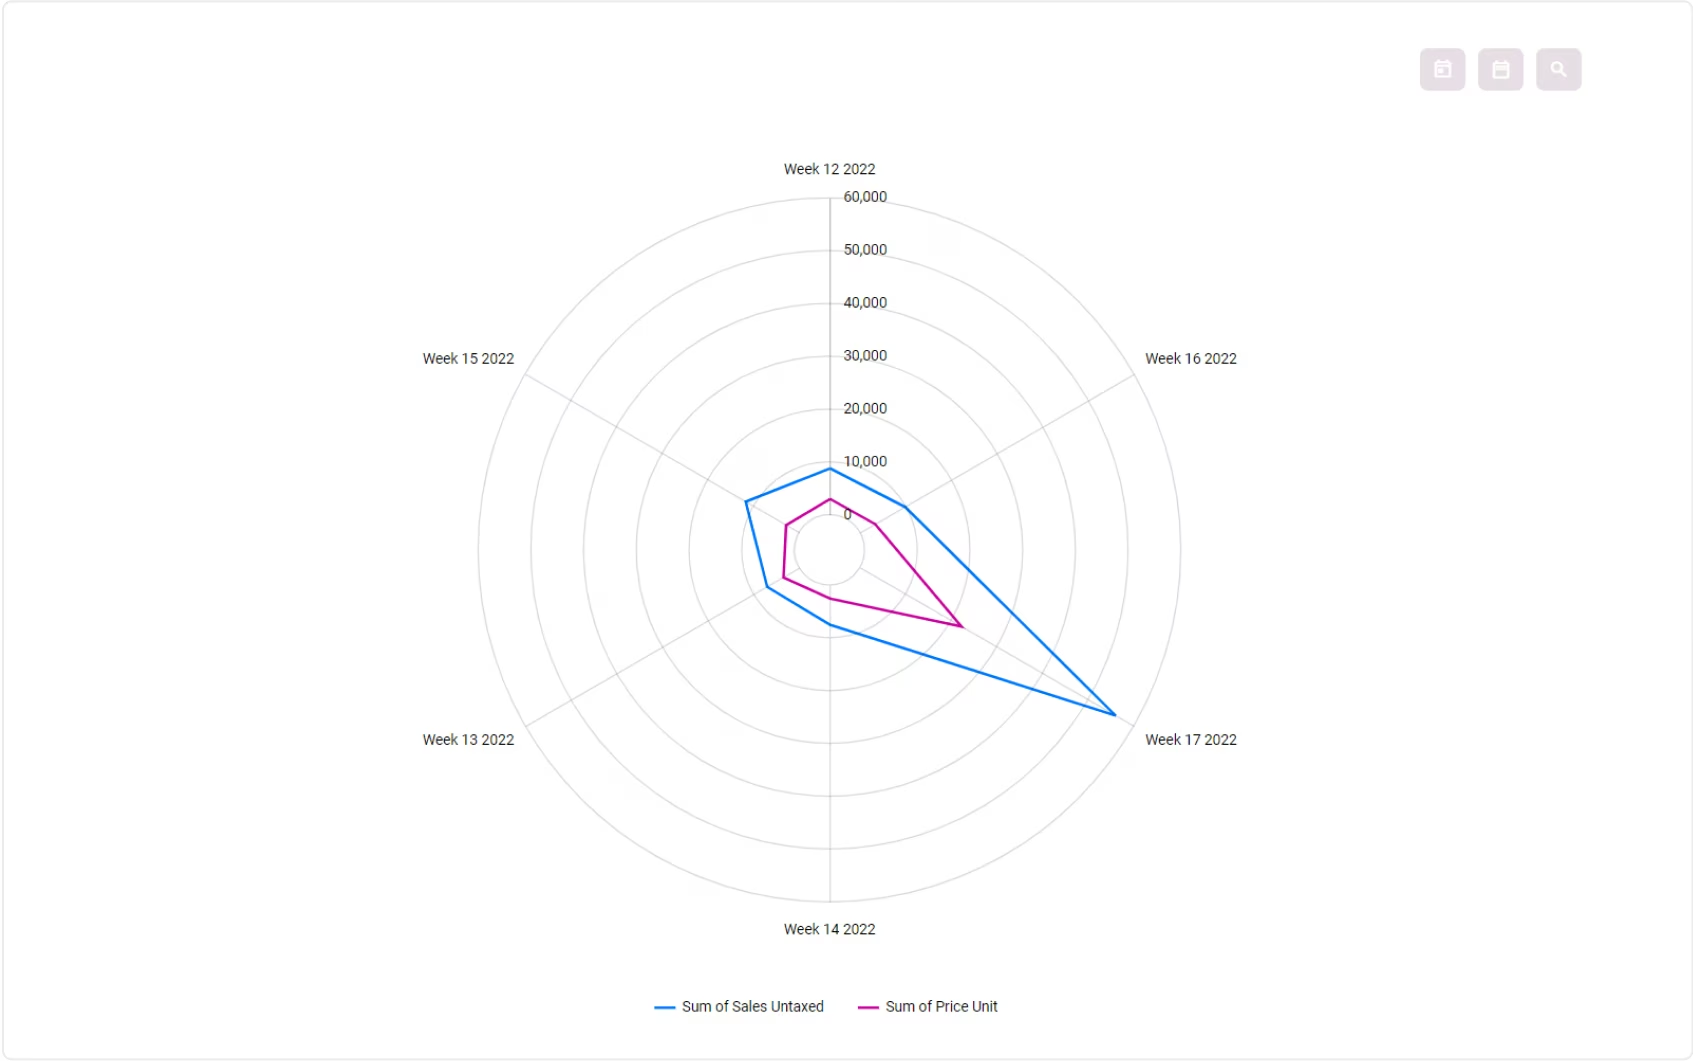
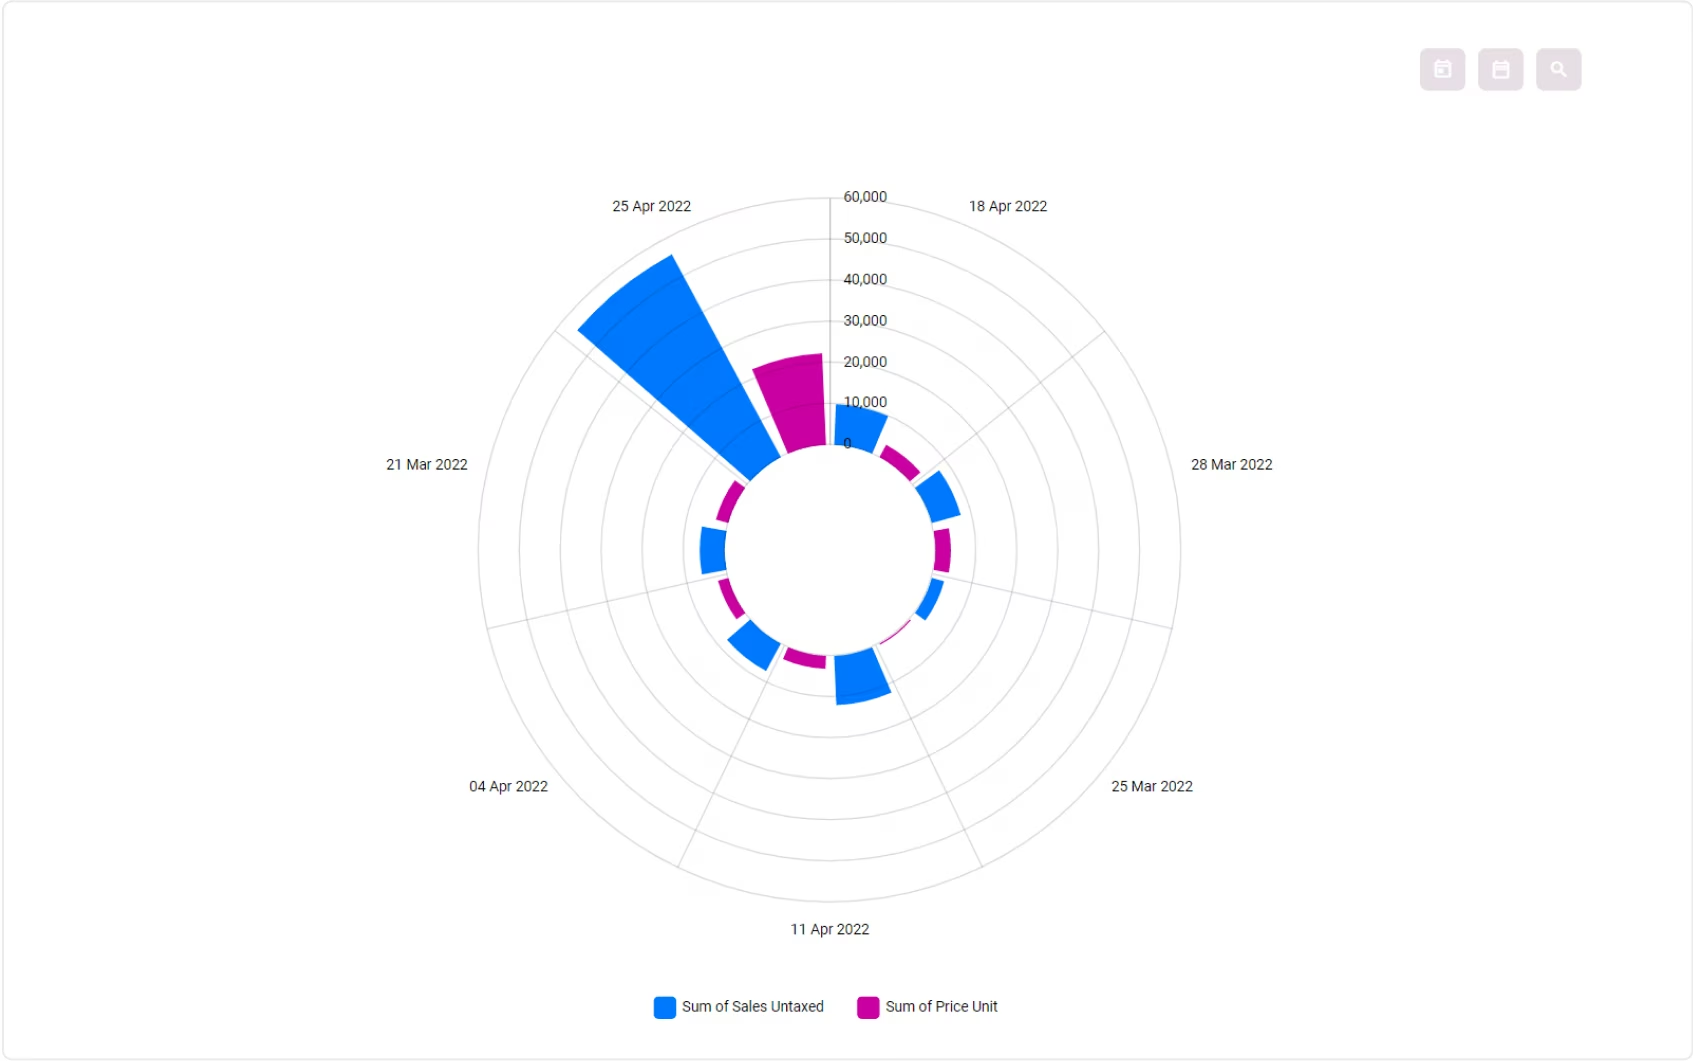
You can change the visual setting of an analysis by clicking the Visual tab.
There are several visual types available and more will be added later.
Every visual can also be configured in more detail such as changing the radius of a pie chart, the position of the legends, etc. with the visual settings
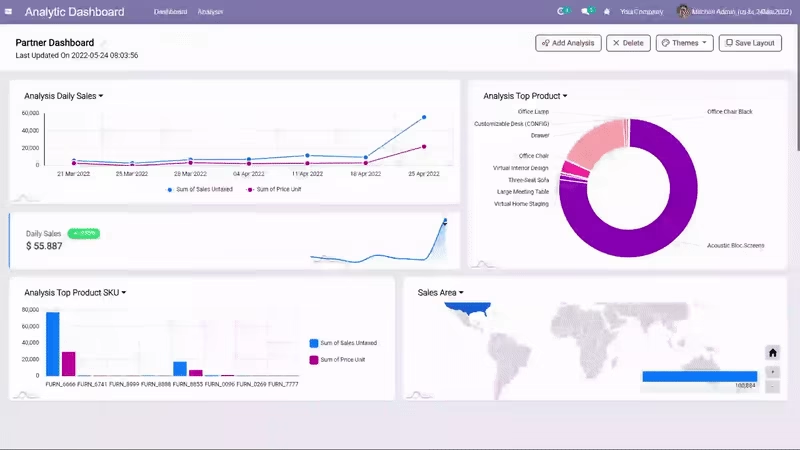
Make a Beautiful Dashboard
Chart position is dynamic. You can move, resize, edit and zoom in on the visual charts to see spesific data in detail.
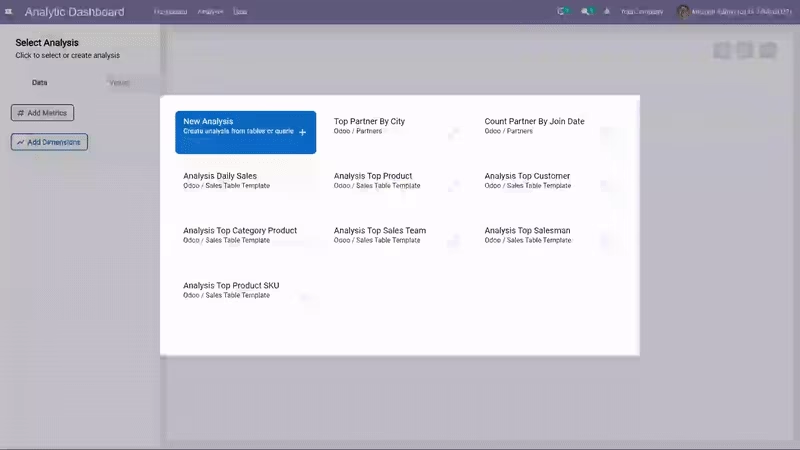
Ready Analysis Template
Even if you aren't an analyst, IZI Analytic Dashboard can make you feel like one.We provide some analysis business templates for you.
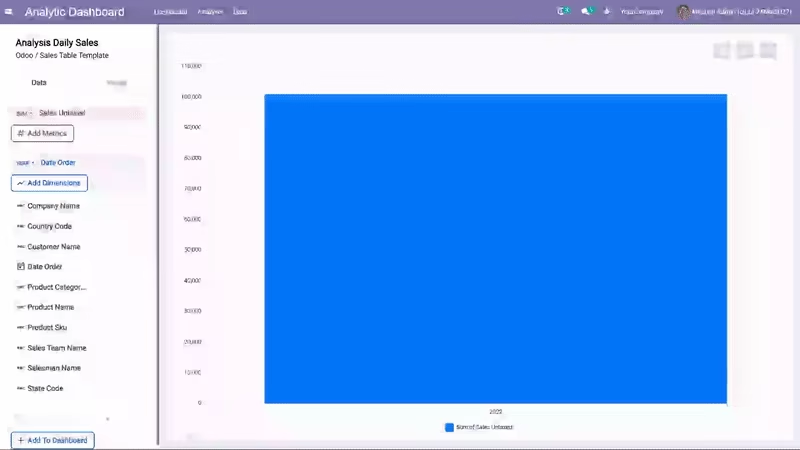
Easily Set the Metrics and Dimensions of an Analysis
All the fields from the analysis table will appear on the left panel. You can easily setup your metrics and dimensions by clicking on them.
You can also set the order (ascending or descending), the calculation applied for the metrics, and the format for each dimensions.
Dynamic Filters
Filters can be dynamically added in the analysis to make data exploration easier.You can still play with the filter in the dashboard view, on the top right of the chart.
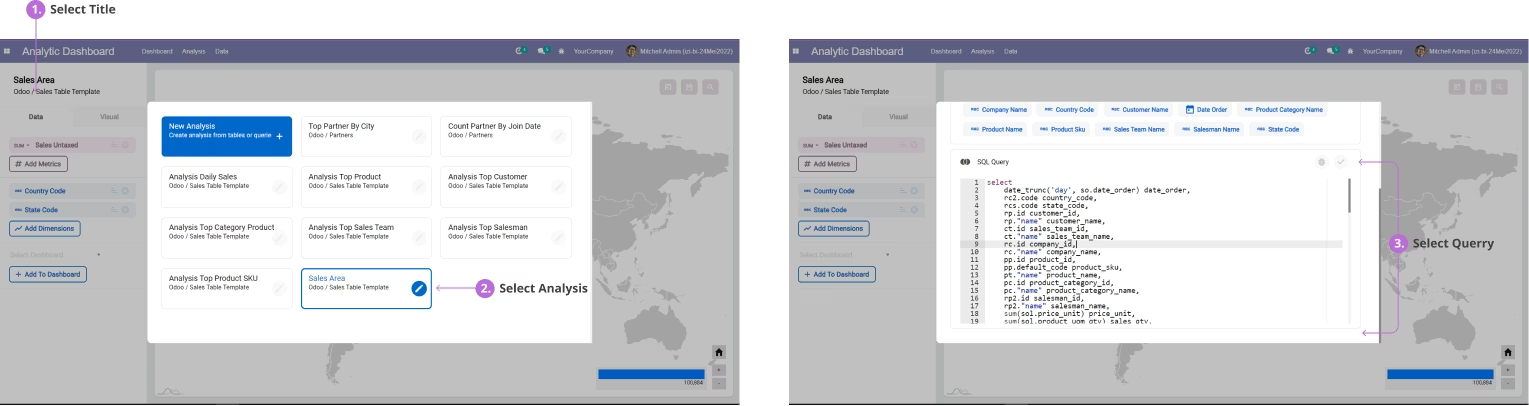
Unlock The Power of Queries
Working with something really complex ?No problem, there's a full editor for those who prefer to write their own SQL.
If you want to modify the data query, you can edit the analysis and input the new query there.