The module extends the capabilities of the Dashboard by introducing AI-powered themes and templates. This enhancement allows users to create dynamic and interactive dashboards that adapt to various business needs, providing deeper insights and facilitating data-driven decision-making.
AI-Powered Themes: Integrate AI-driven themes into your dashboards for enhanced data visualization.
Dynamic Templates: Utilize pre-designed templates that can be customized to fit specific business requirements.
Interactive Dashboards: Create dashboards that allow users to interact with data for deeper insights.
Seamless Integration: Works seamlessly with the Dashboard module to provide a comprehensive analytics solution.
Enhanced Data Visualization: AI-powered themes improve the clarity and impact of data presentations.
Improved Decision-Making: Interactive dashboards facilitate better understanding of data, leading to informed decisions.
Customization Flexibility: Dynamic templates allow for easy customization to meet specific business needs.
Comprehensive Analytics Solution: Combines AI integration with advanced analytics features for a robust dashboard experience.
Analytics Dashboard
Visualize with Beautiful Charts.
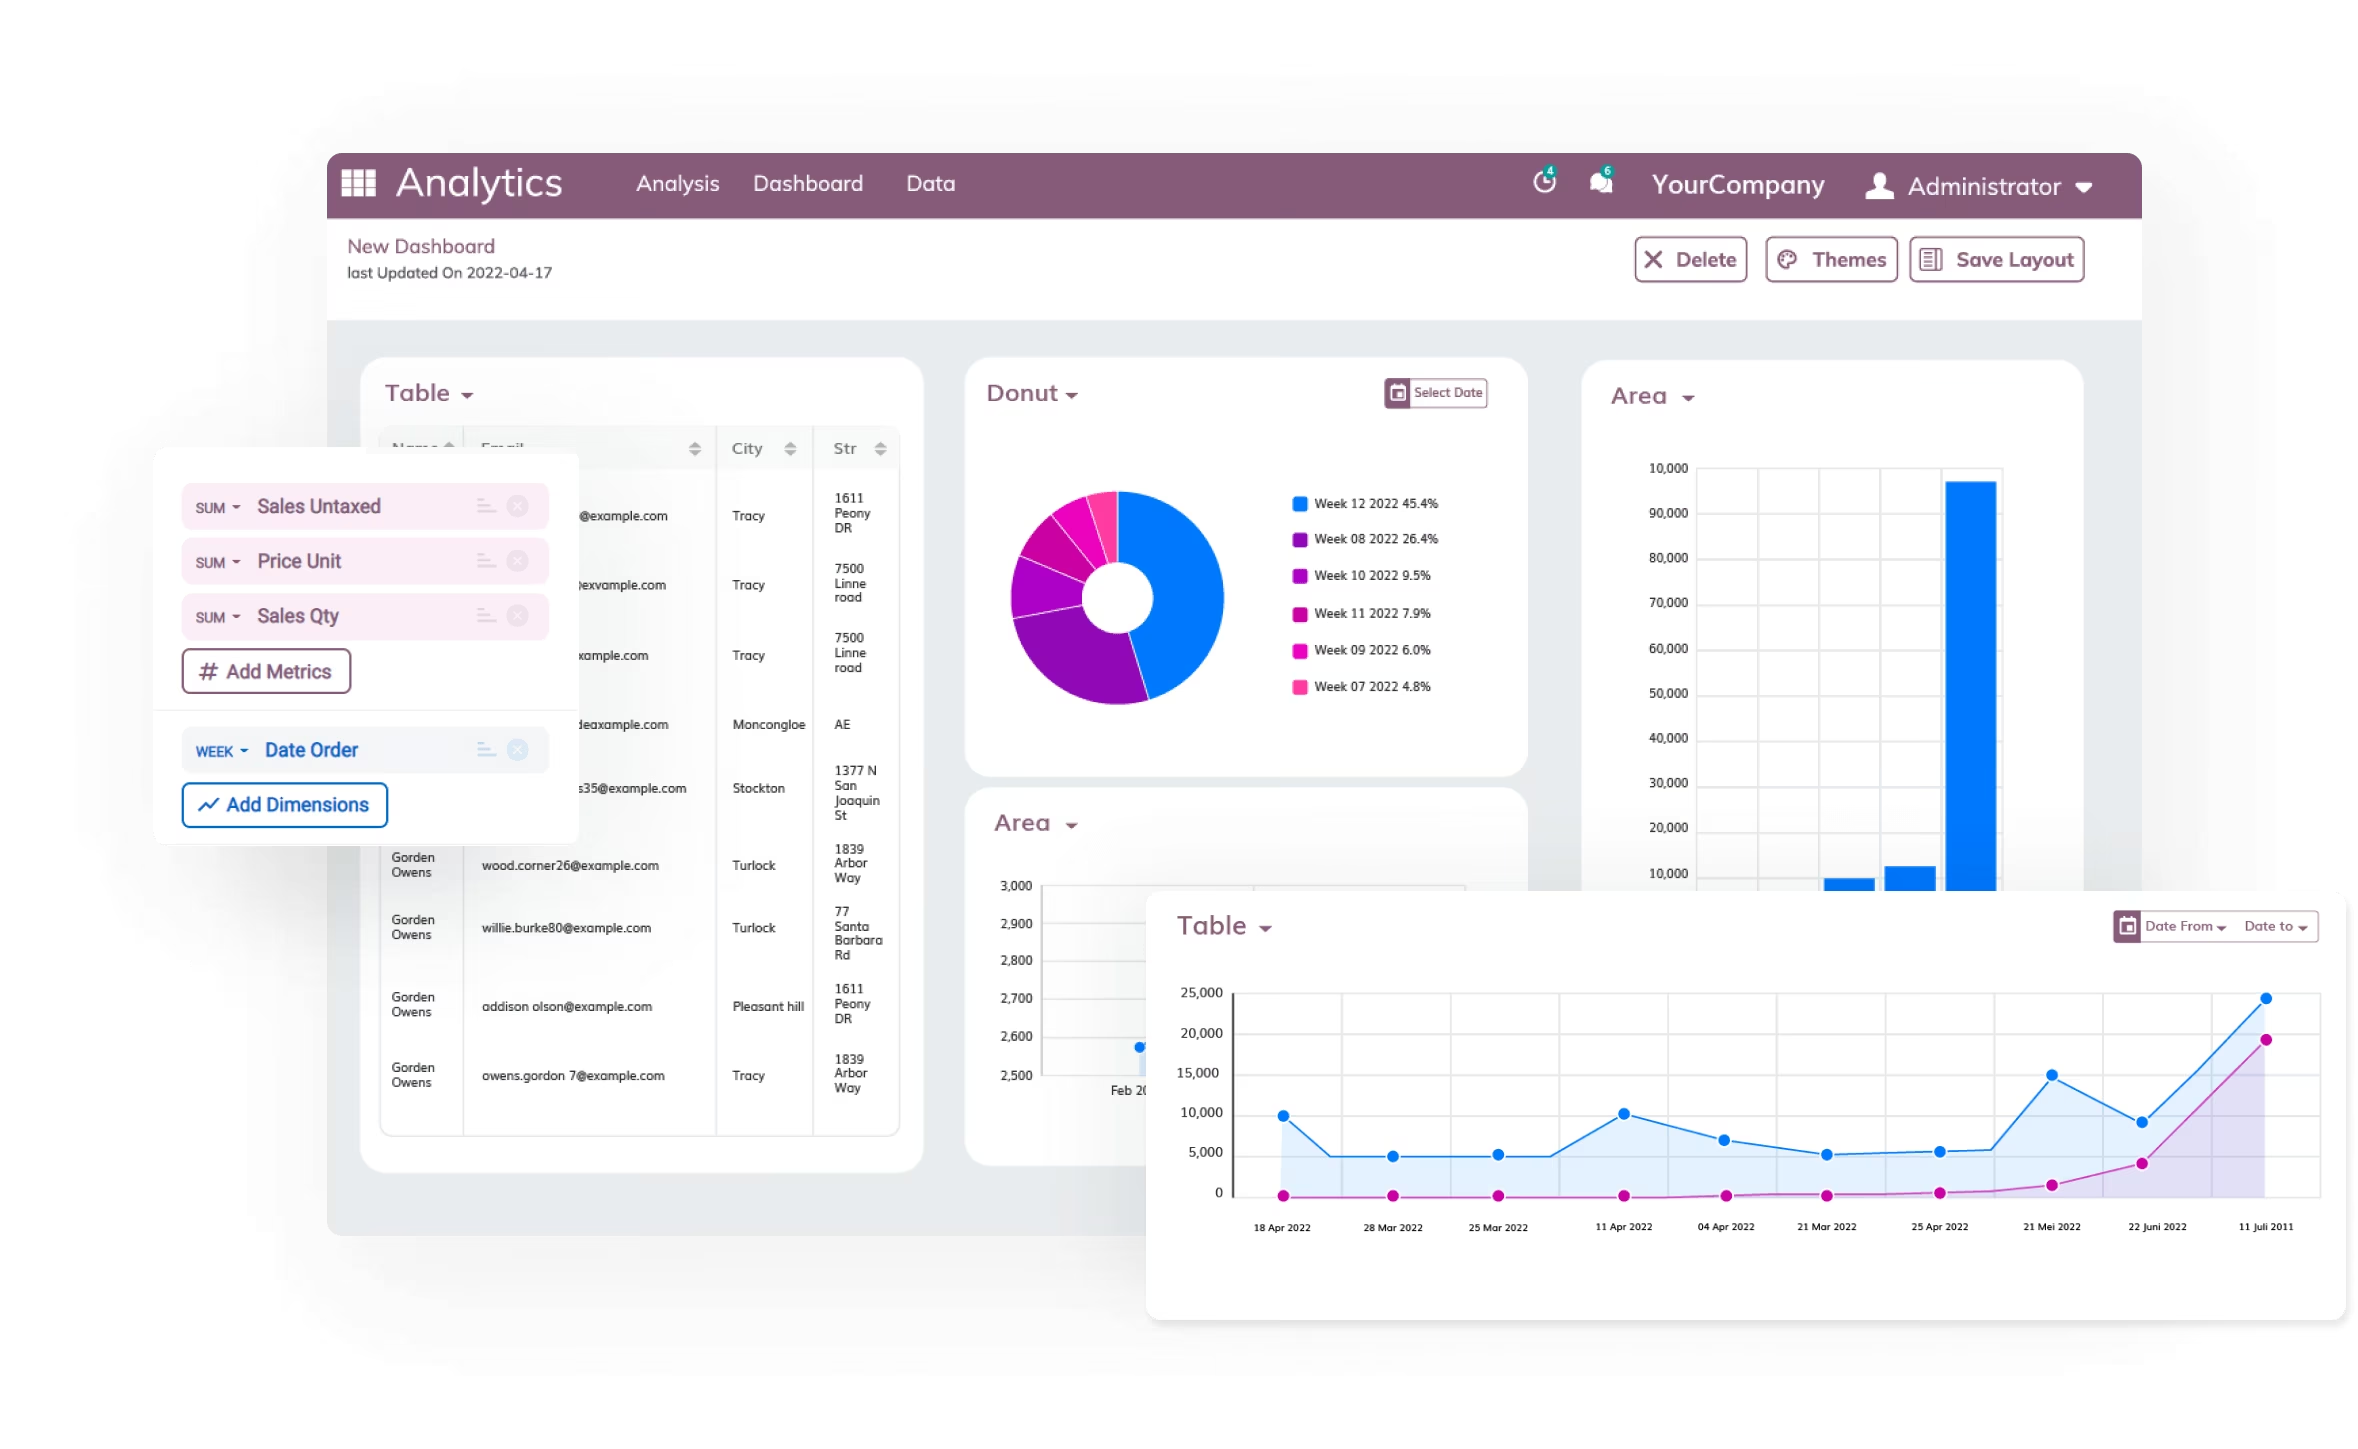
All features you need to manage your data beautifully
 Dynamic Dashboard Builder
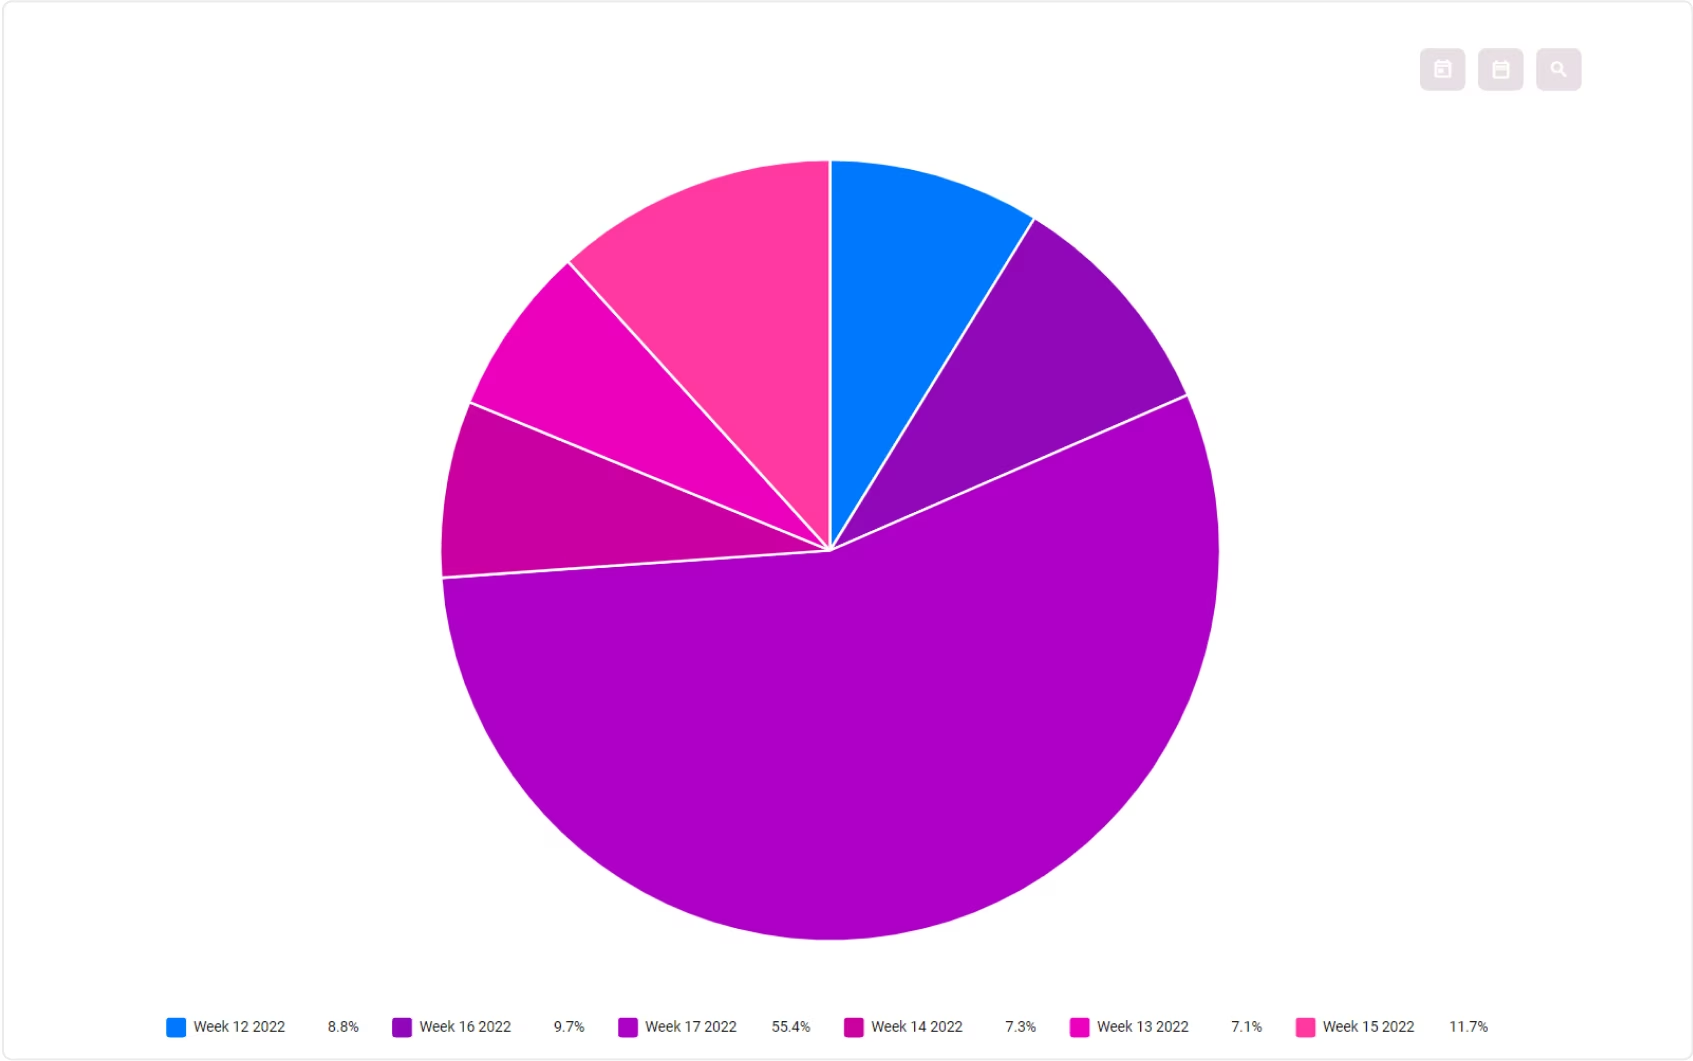
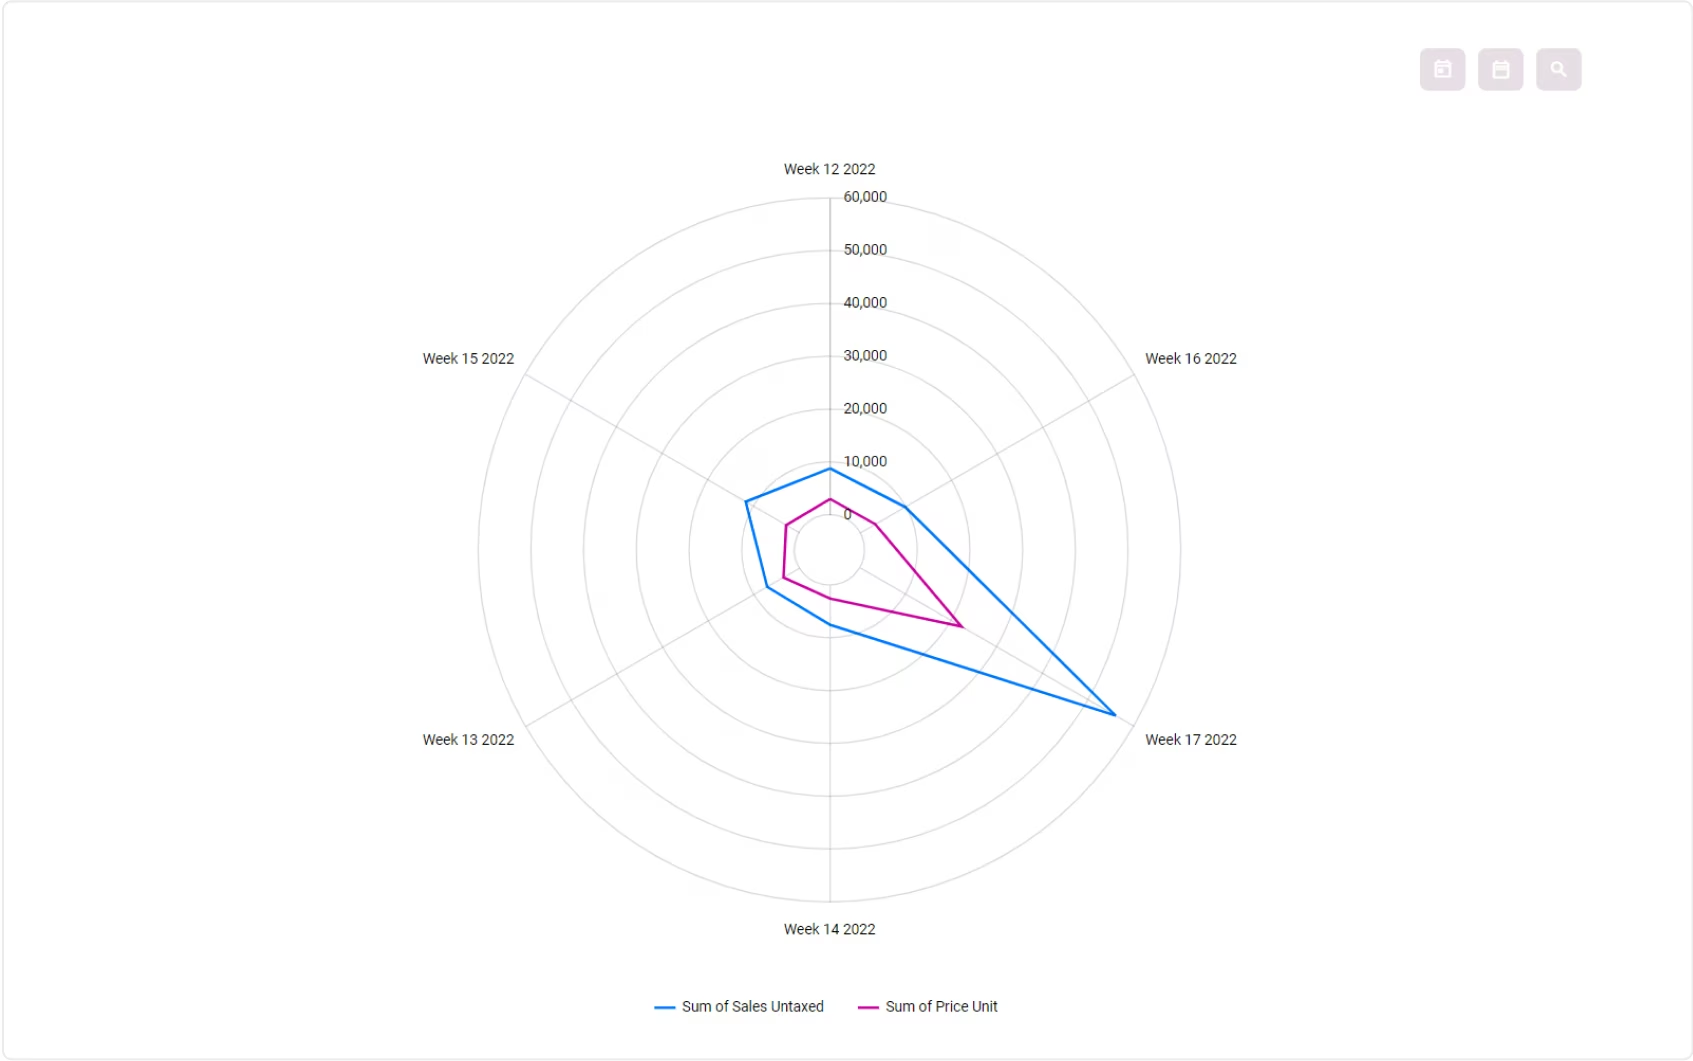
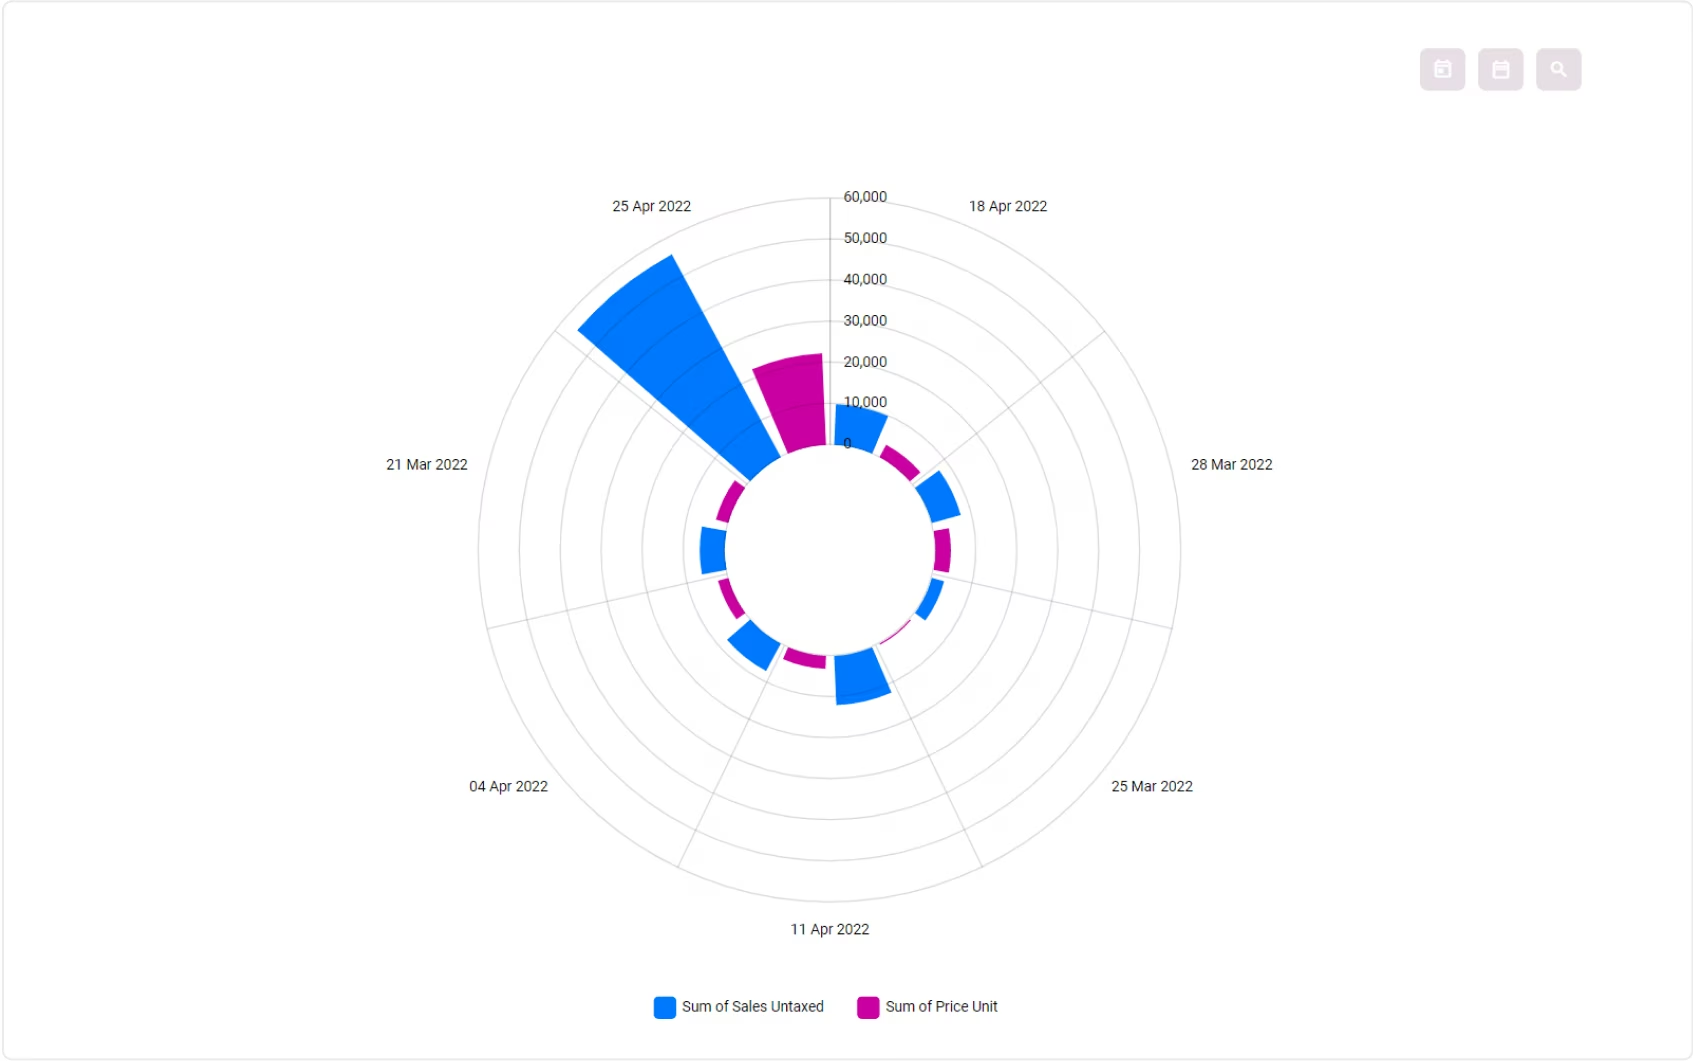
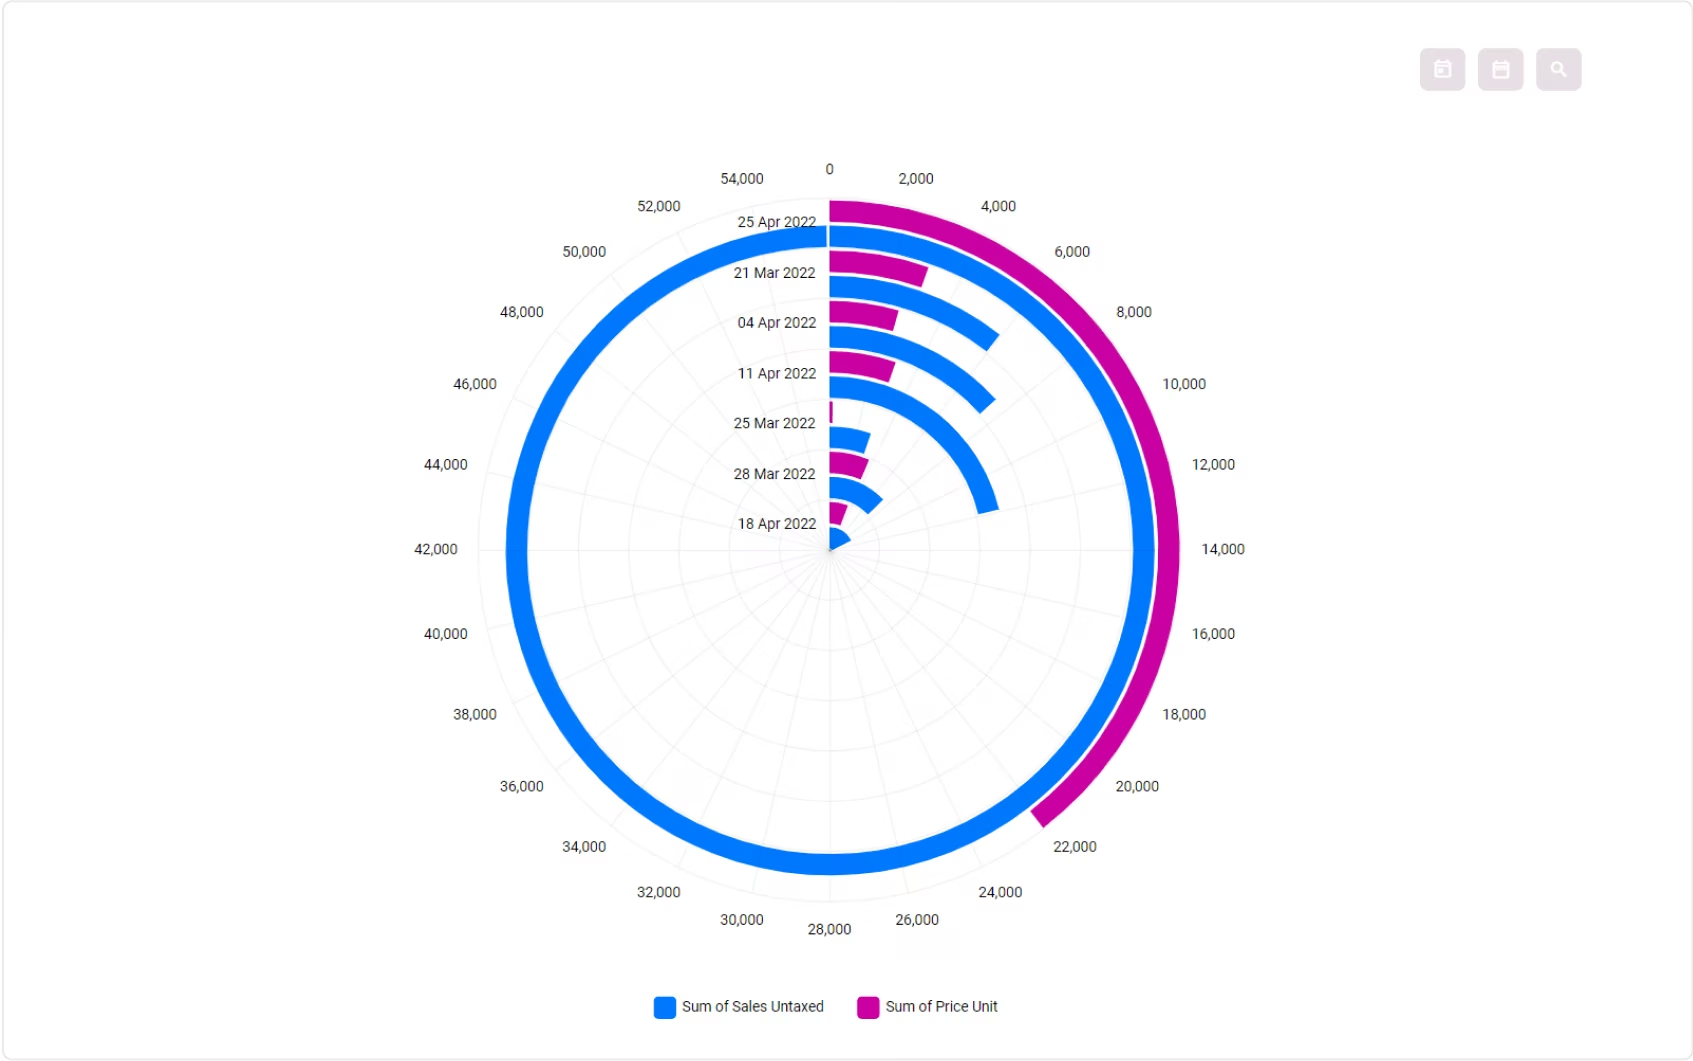
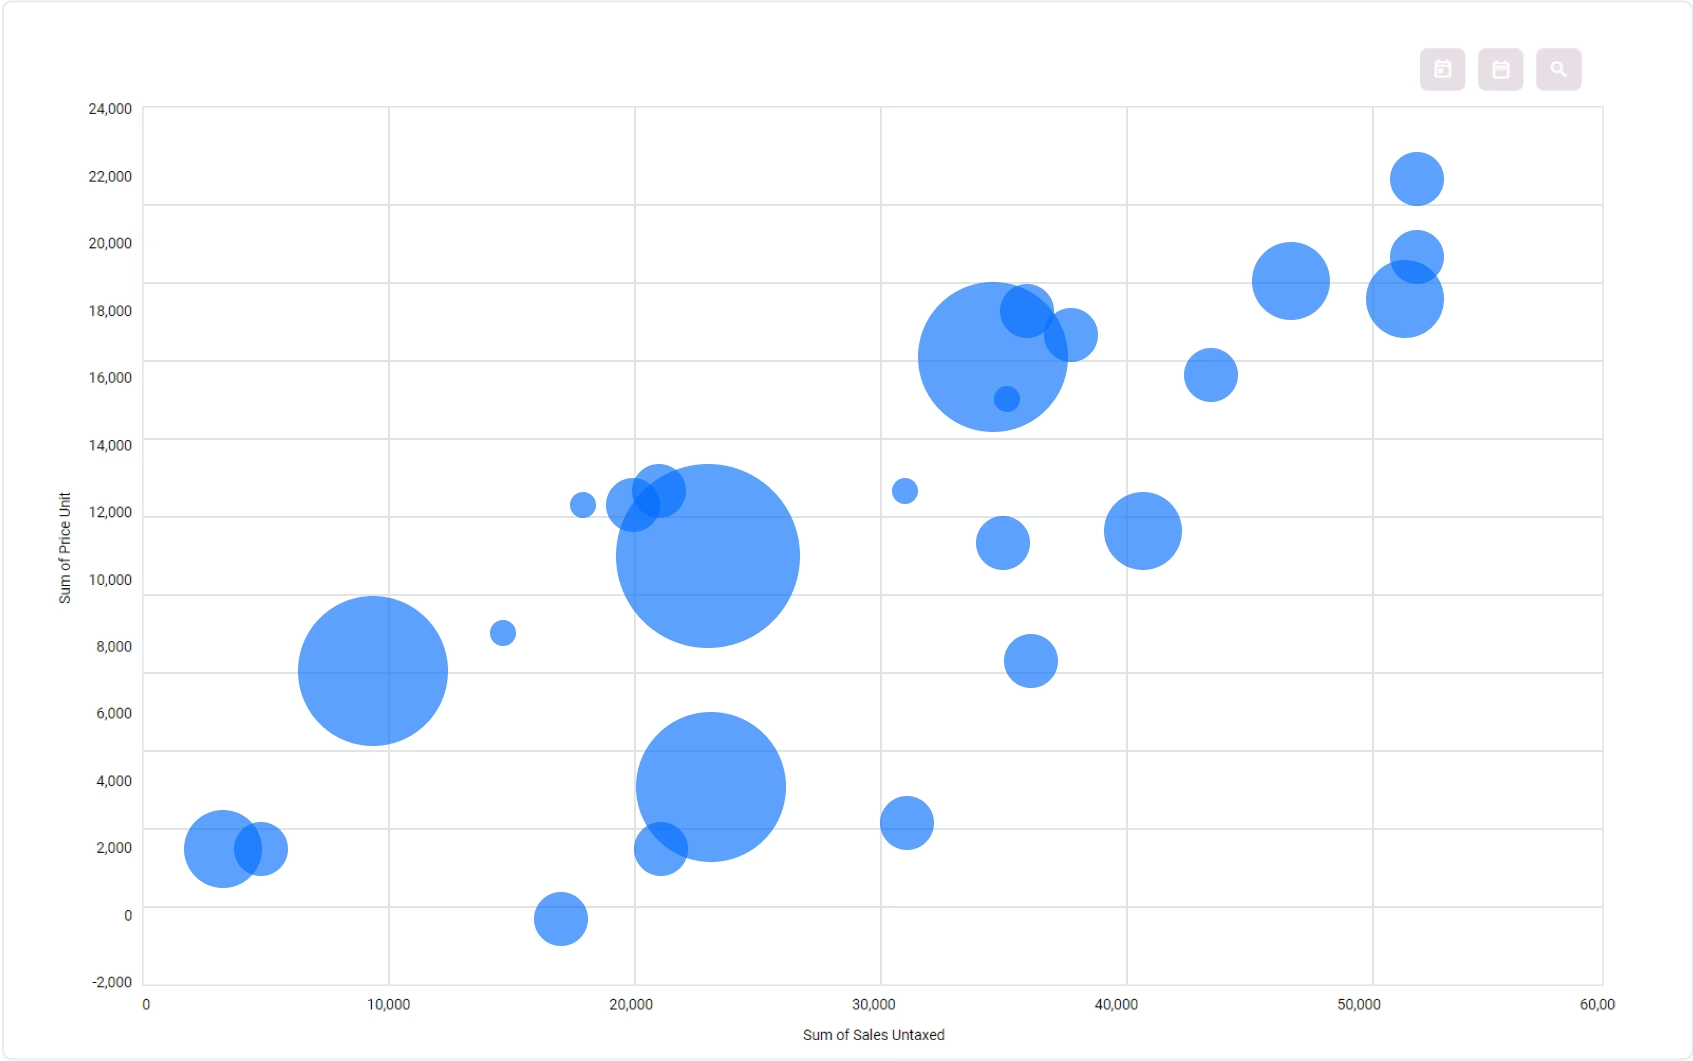
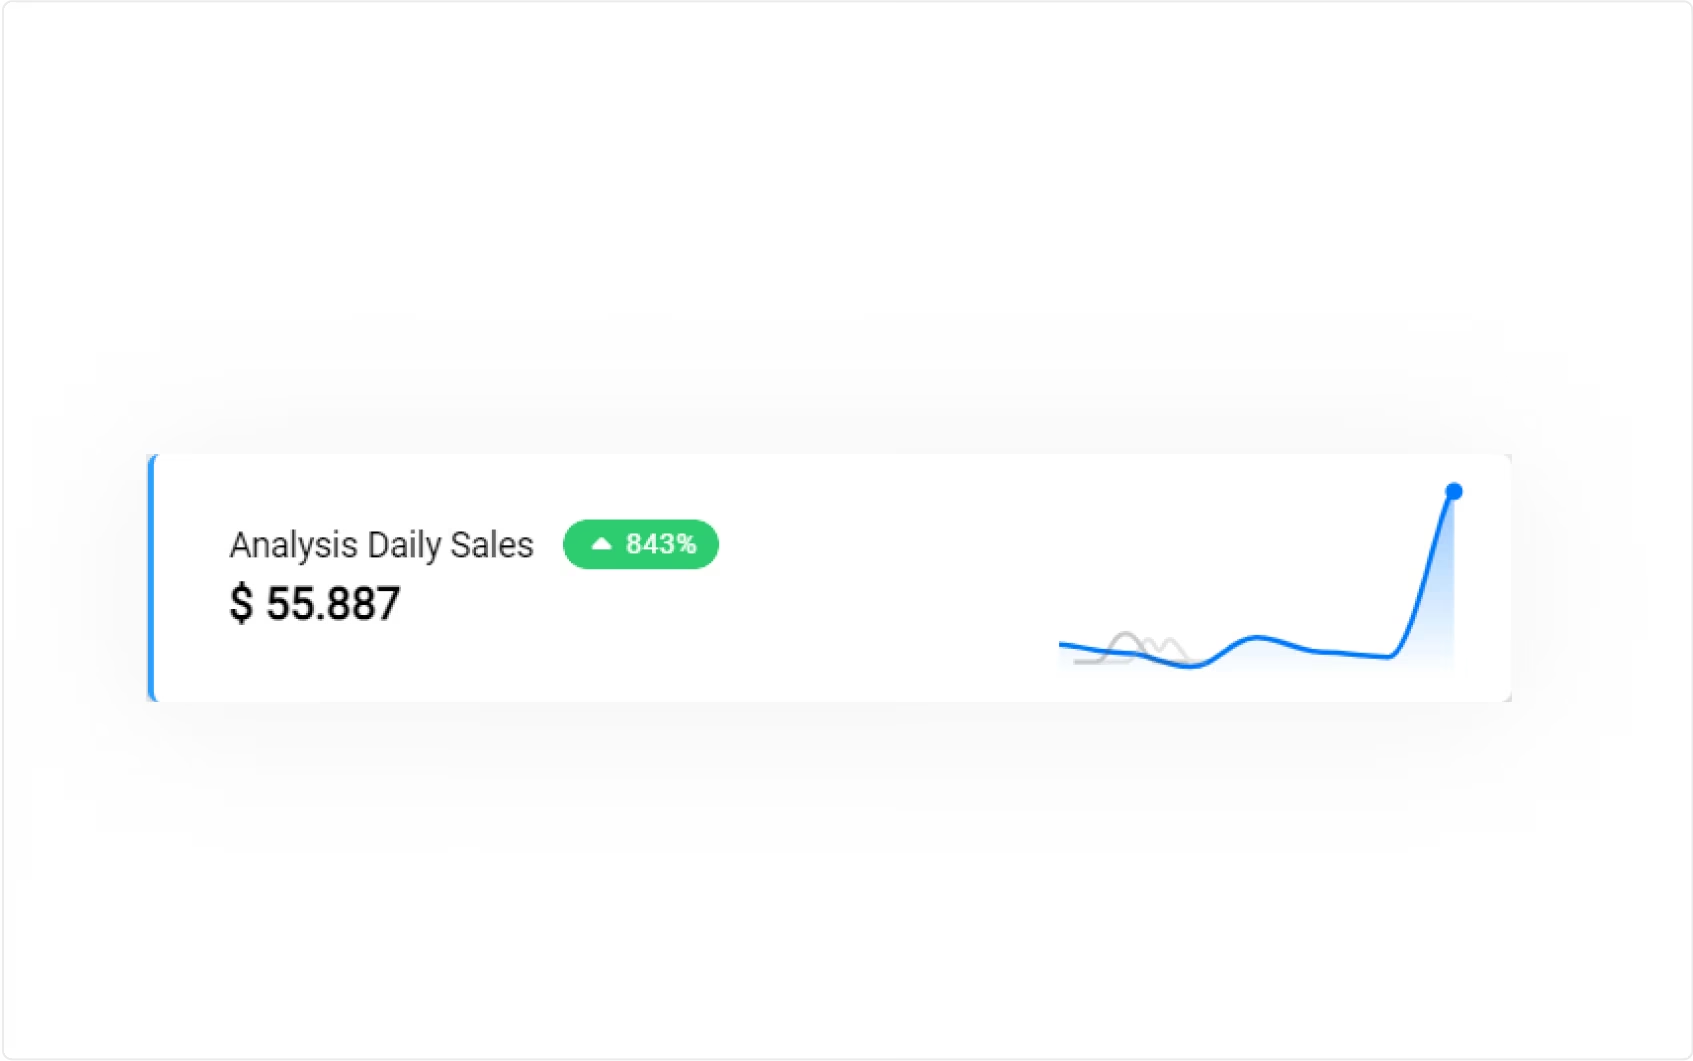
 Beautiful Animated Charts
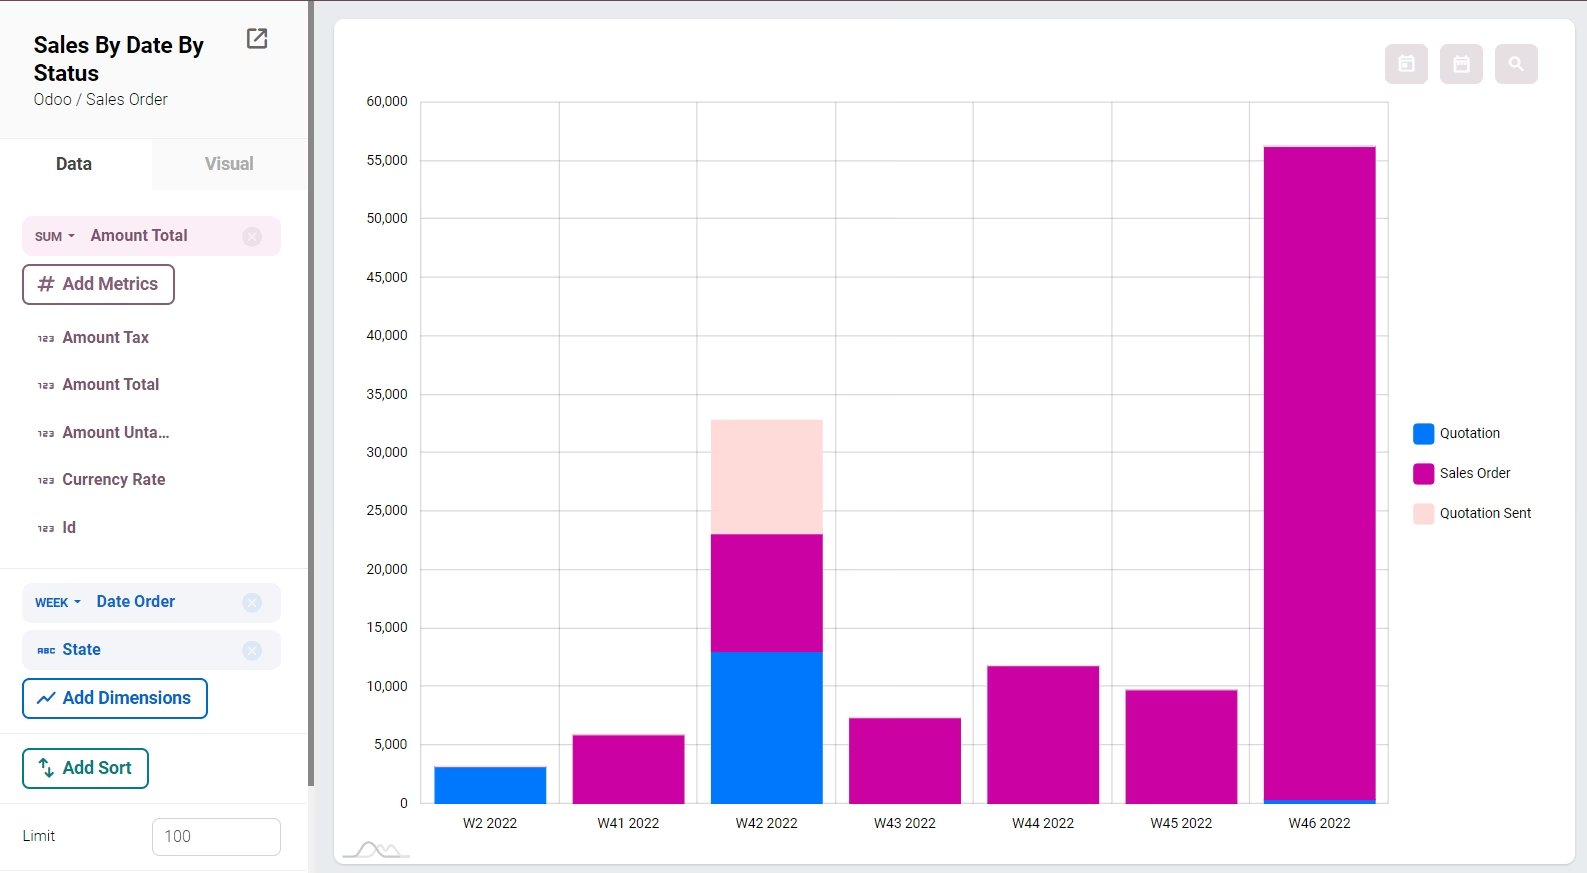
 Analysis Focused View
 Select Metric, Dimension, Sort
 Show / Hide Charts Data
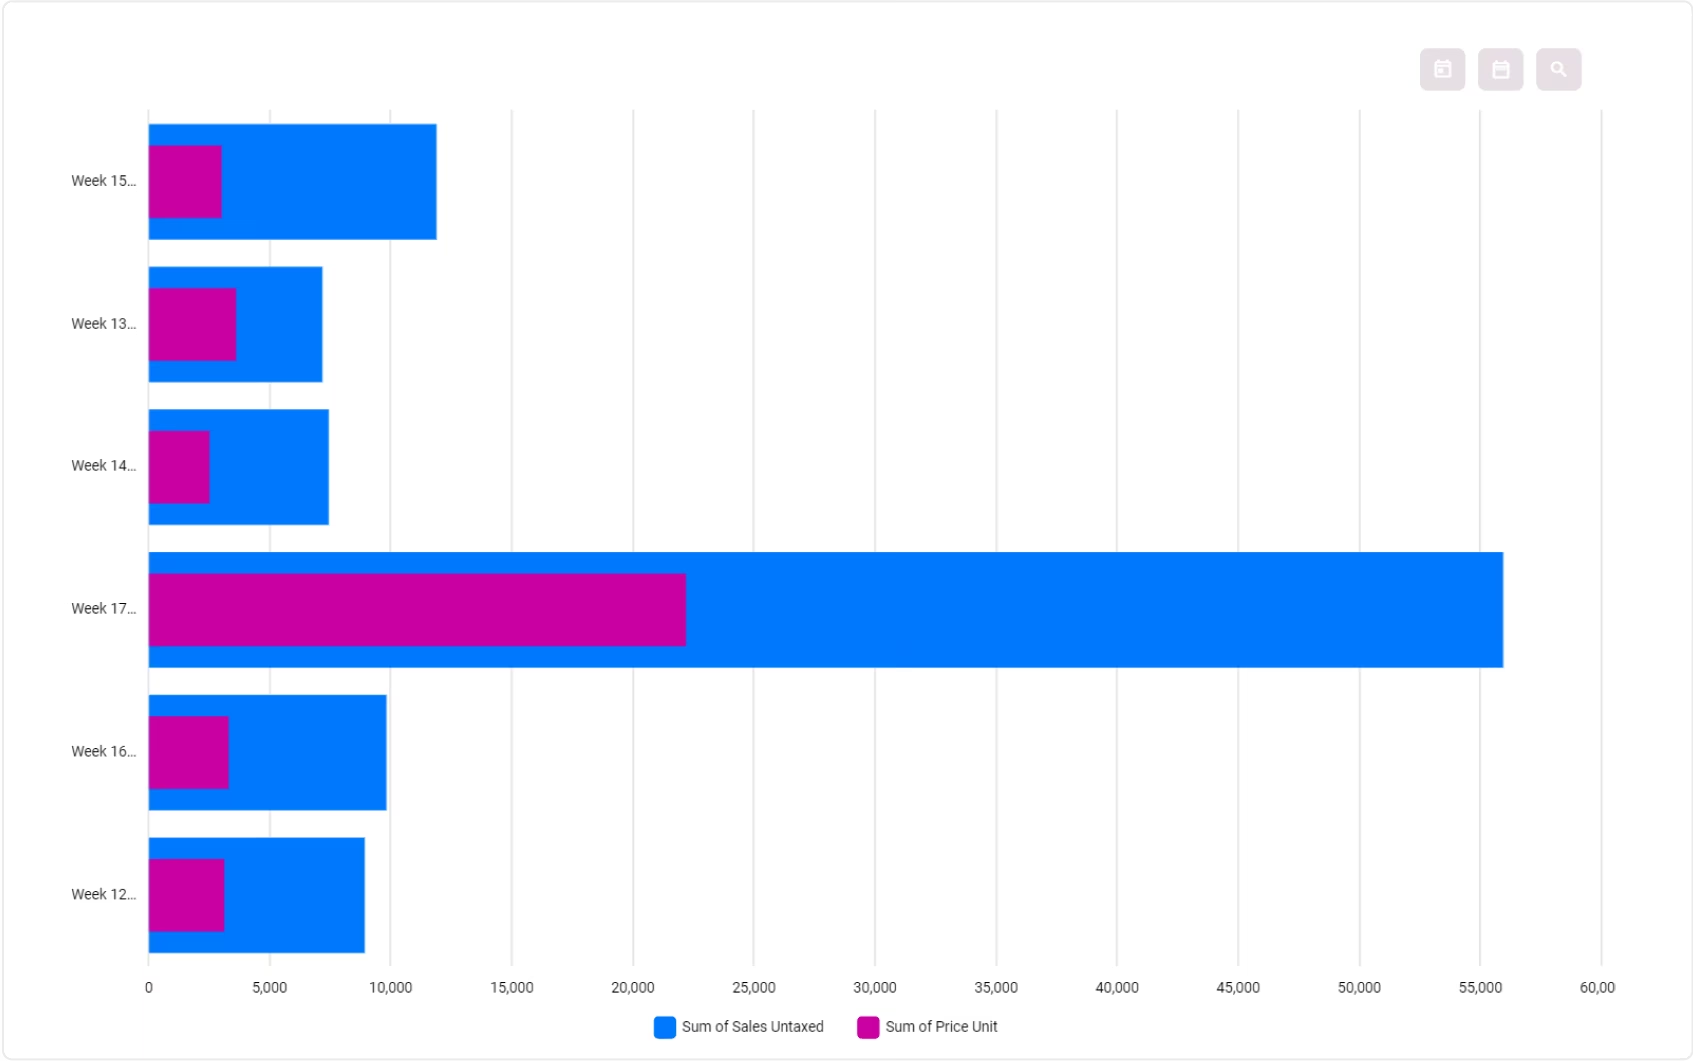
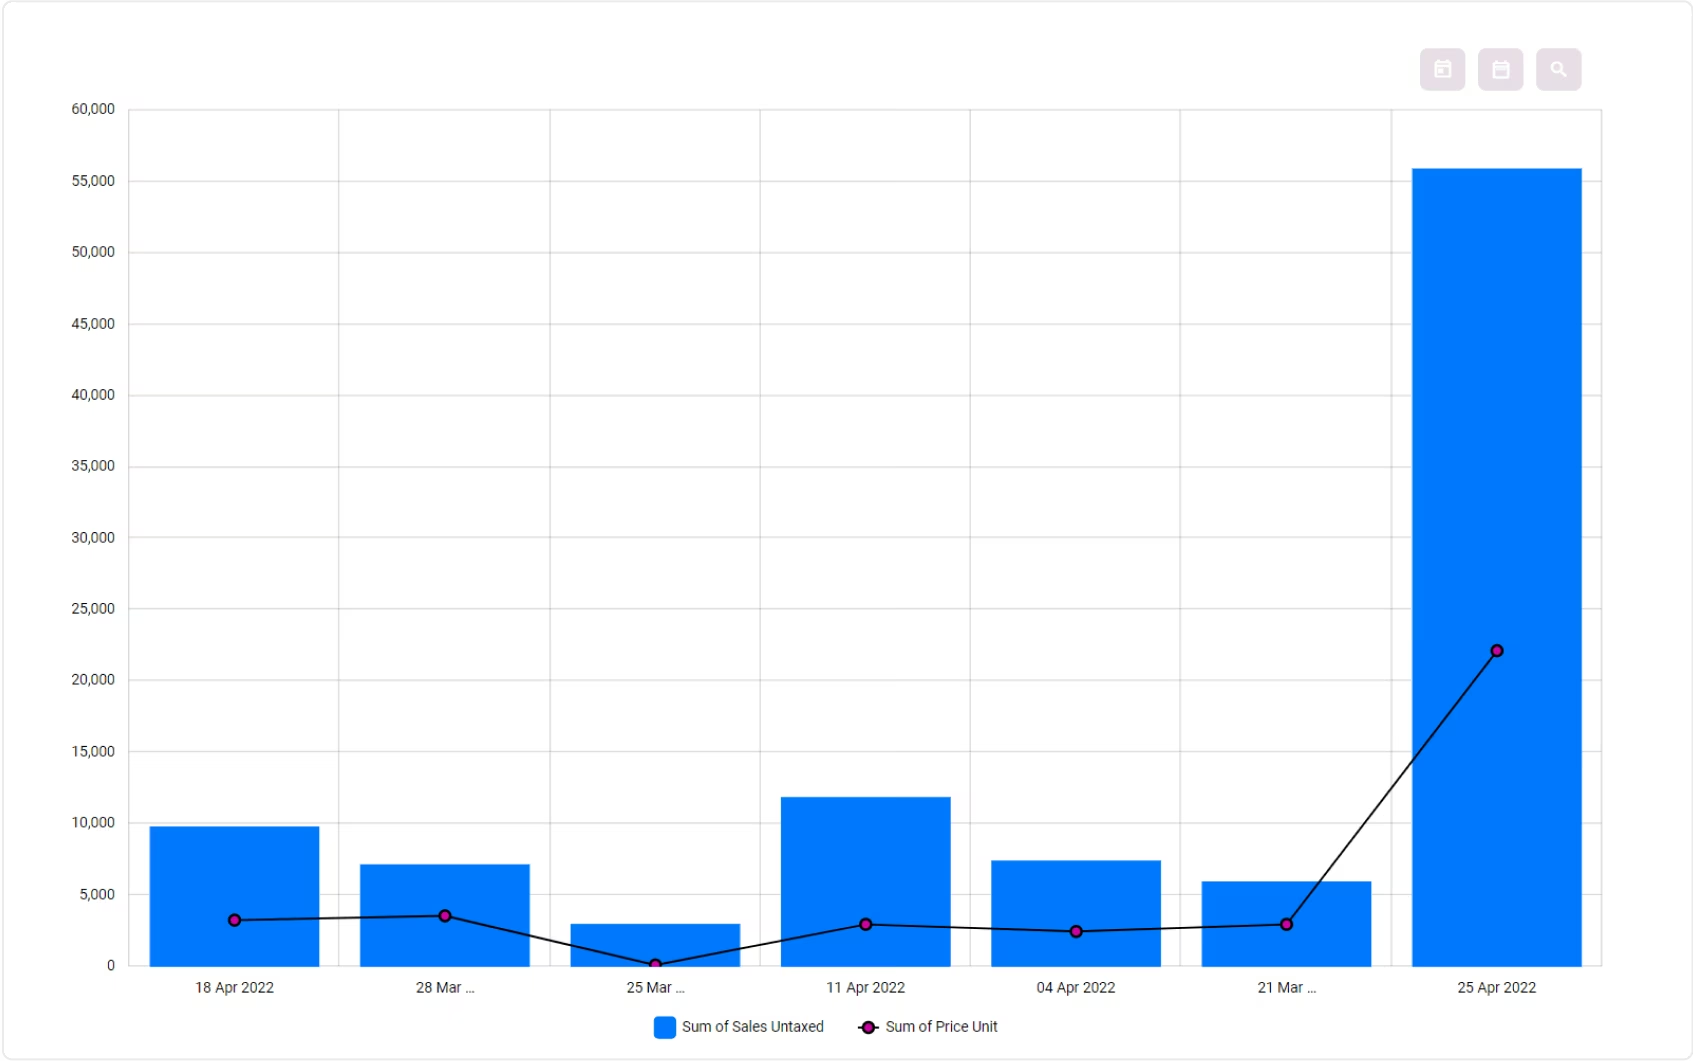
 Multiple Metrics and Dimensions
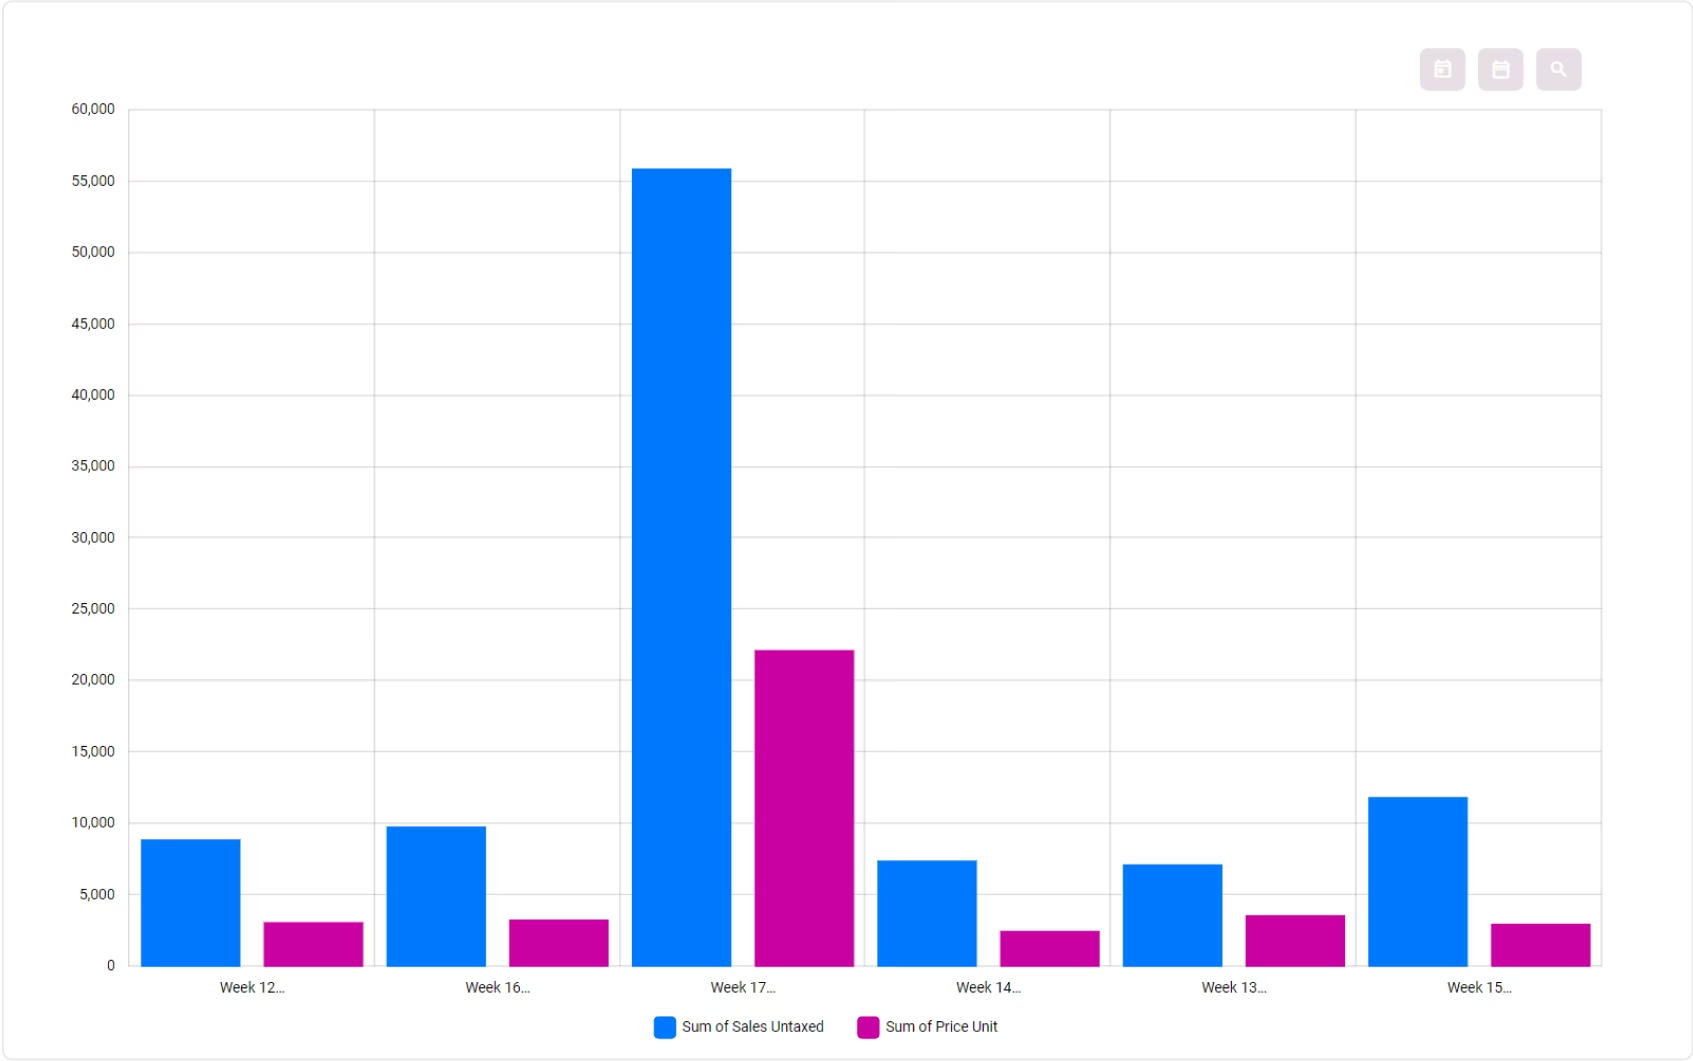
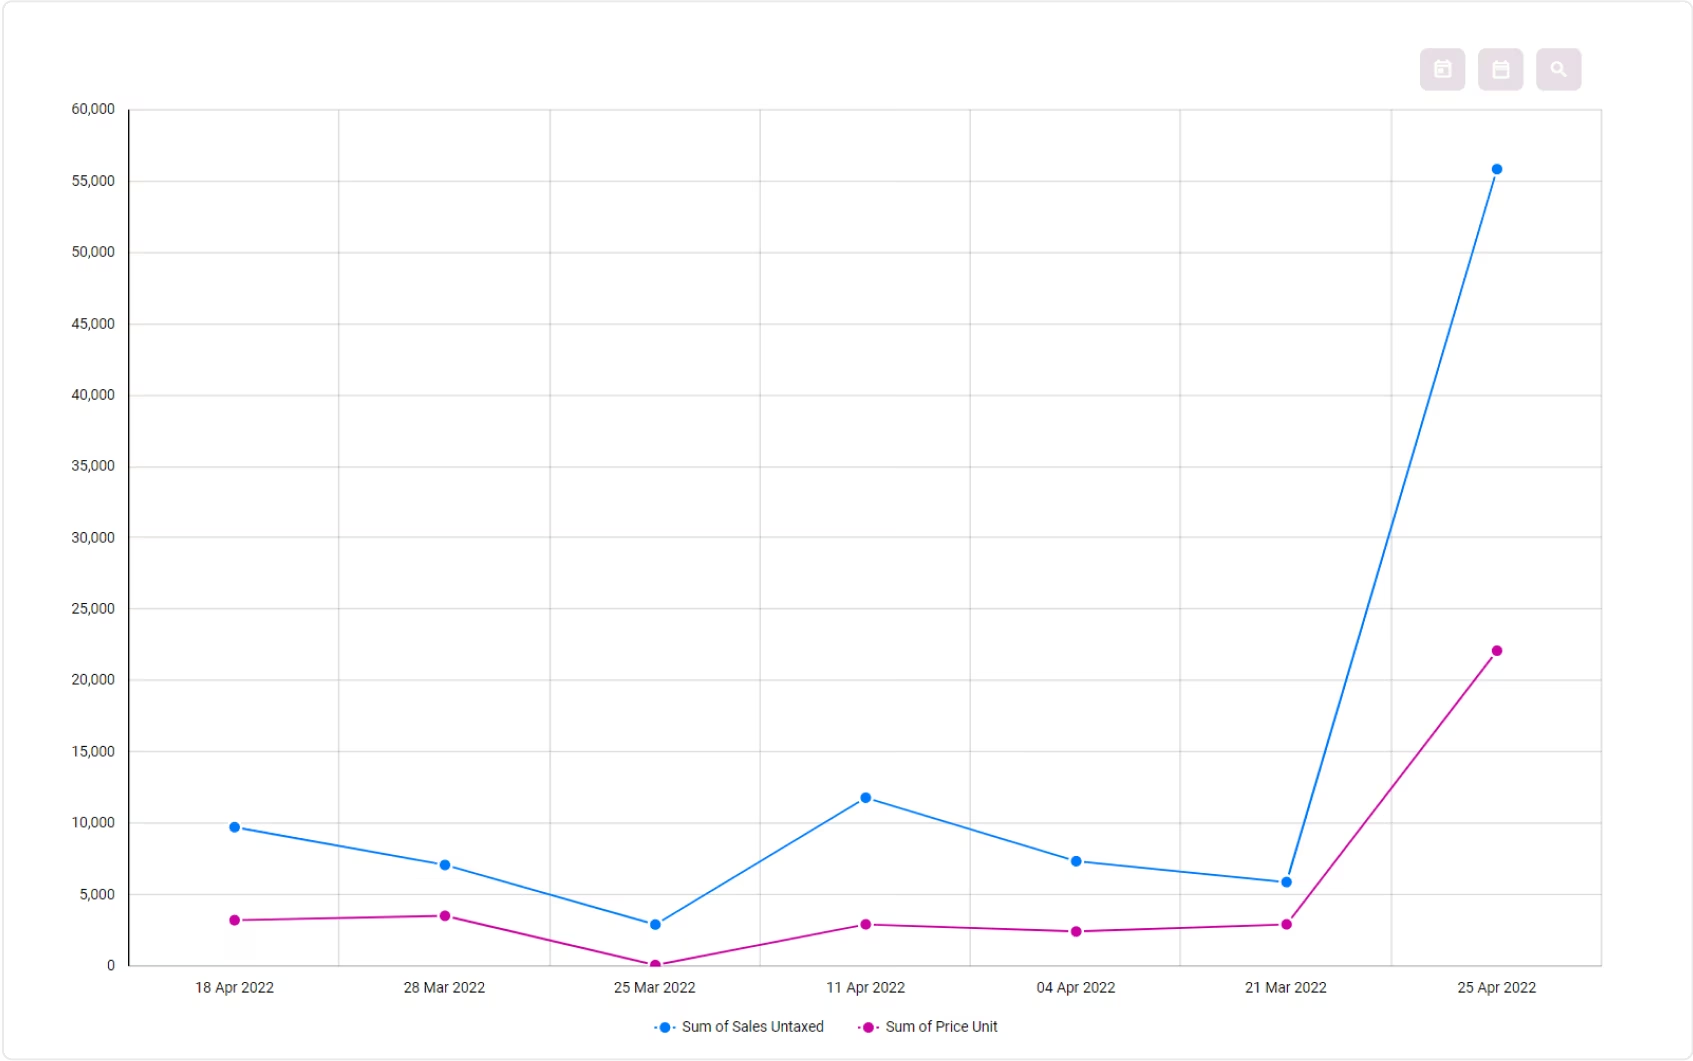
Multi-Dimensional Bar & Line Chart
Multiple Metrics and Dimensions
Multi-Dimensional Bar & Line Chart
 Data Filtration By Domain or Query
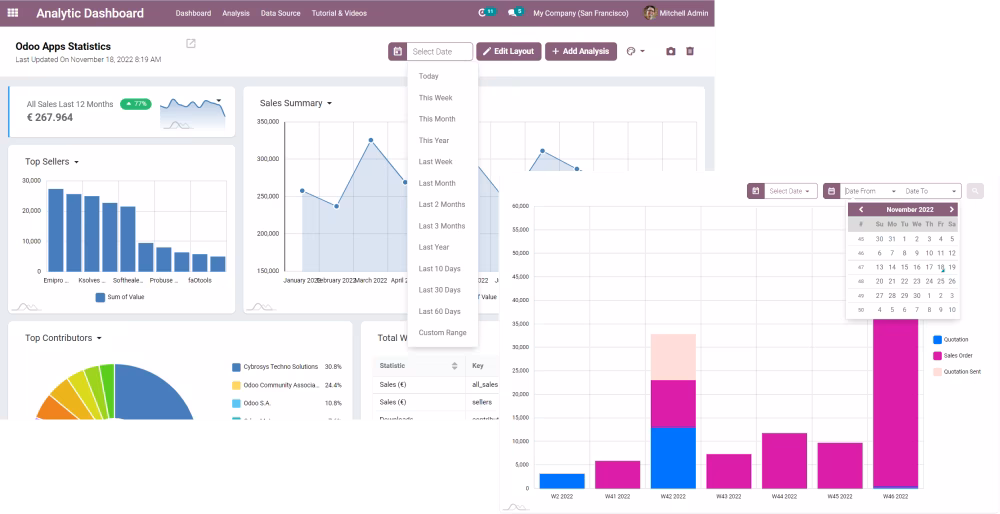
 Advanced Date Filter
 Default Date Filter On Dashboard
 Various Visualization Options
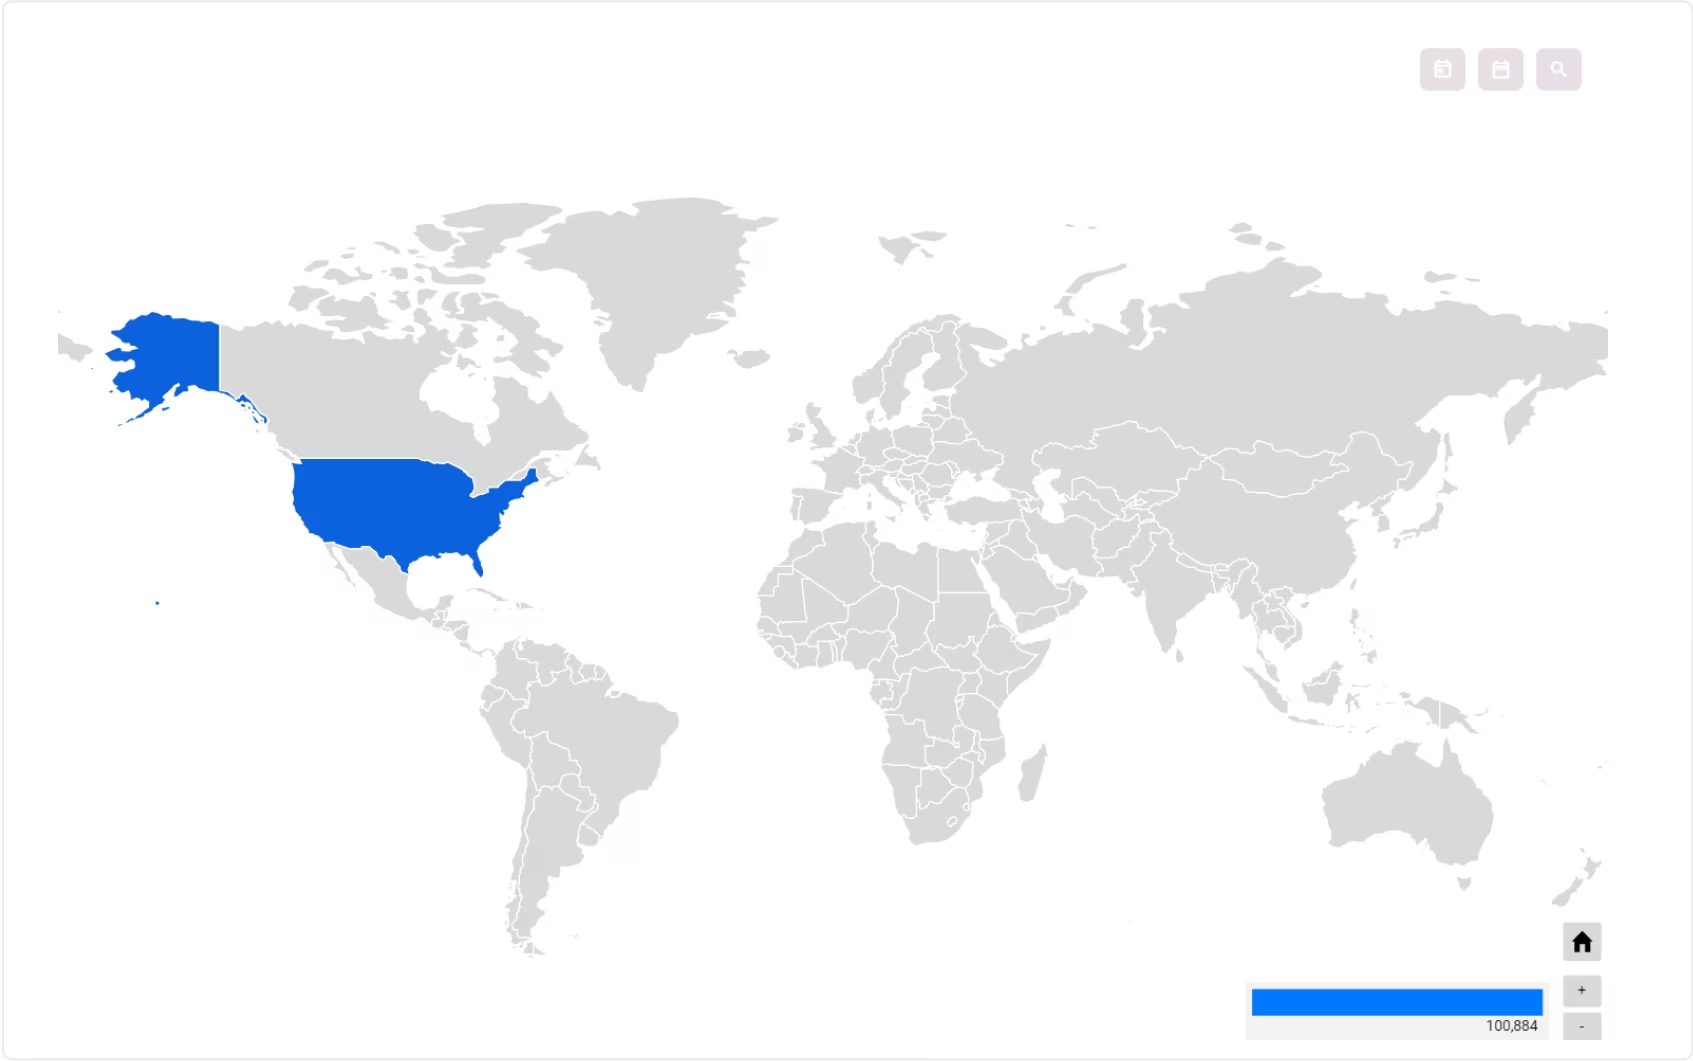
 Heat Map That Support All States in Most Countries
 Responsive: Fluid & Flexible Layout
 Move Dashboard Items Position
 Multi-Color Themes
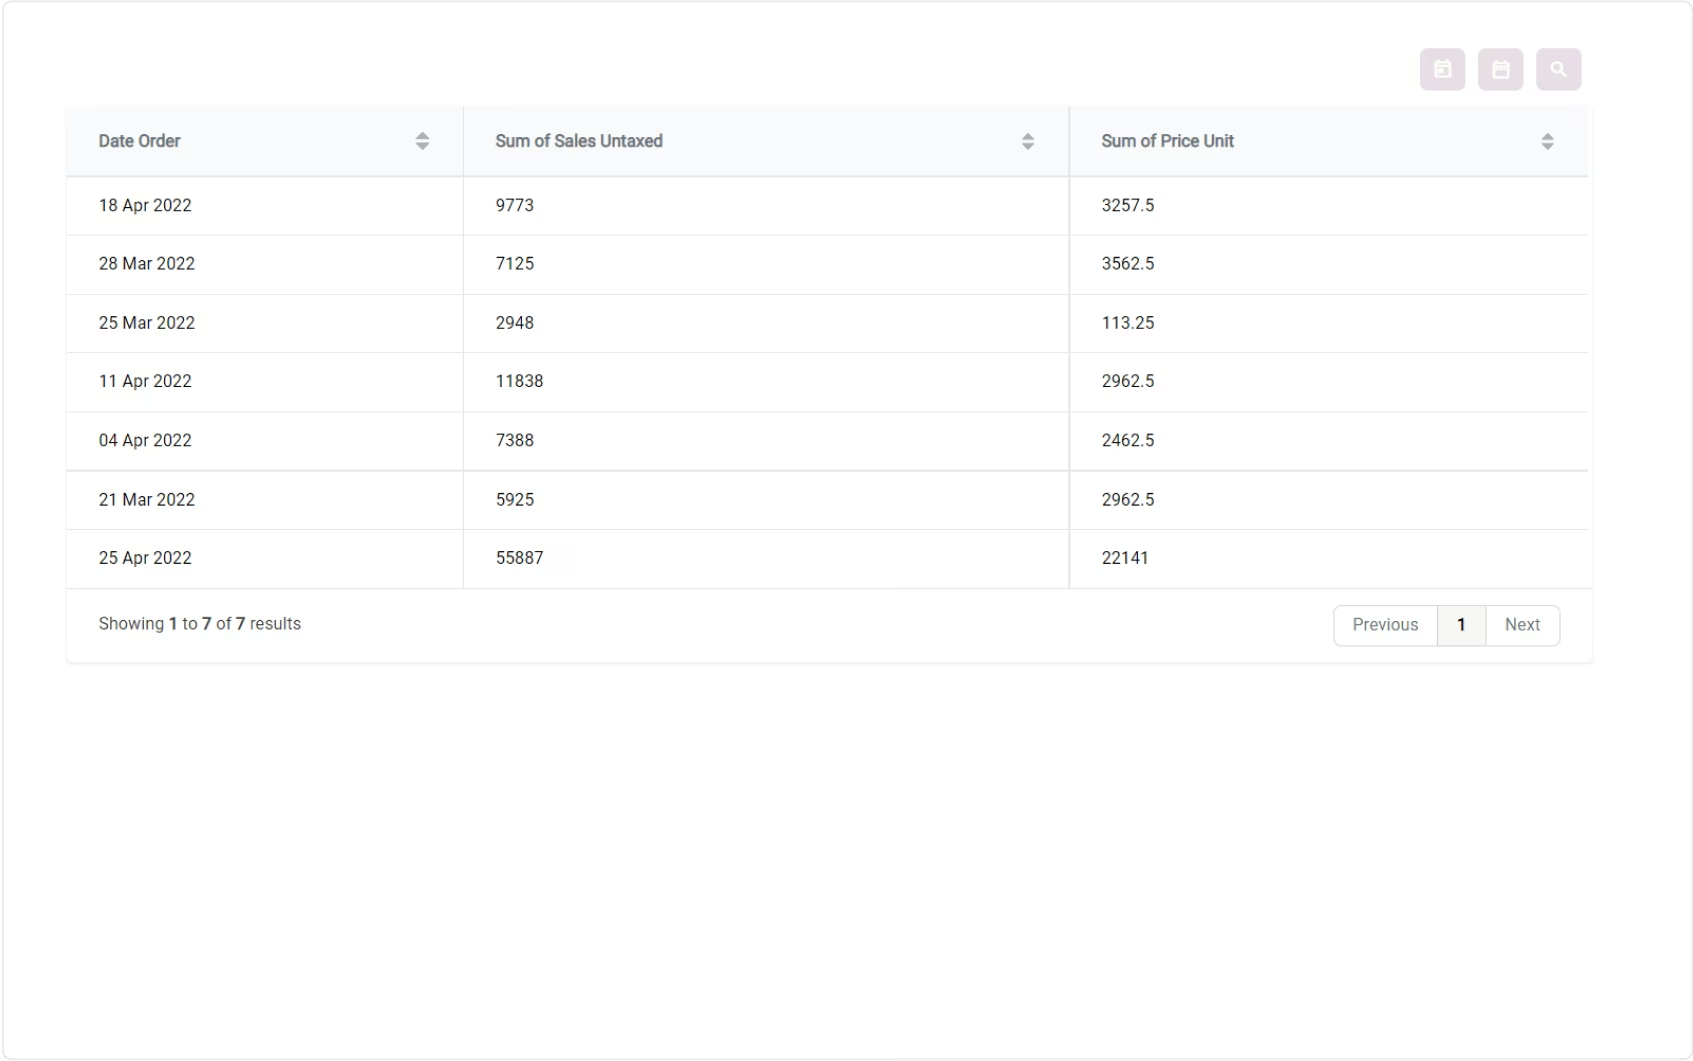
 Open Data in List View
 Export Dashboard to PNG
 Export Dashboard Data to Excel
 Predefined Analysis
 Community / Enterprise / .Sh Support
 Access Control
 Monetary / Custom Units
 Multi-Company Support
 Multi-Currency Support
 Multiple Data Source
 Custom Query to Get Data
 Predefined Table View
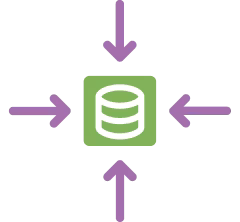
 Data Mart and ETL Process
 Python Calculation for ETL Process
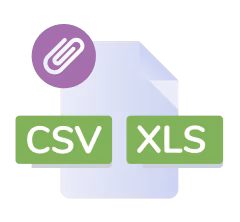 Upload and Read XLS / CSV Attachment
 Get Data From API
 Get Data From Scrapping
Connect To External MySQL and PostgreSQL (Extension)
Get Data From Scrapping
Connect To External MySQL and PostgreSQL (Extension)
 Key Performance Indicator
 Multi-Level KPI System
 Import Export KPI Target
 KPI Calculation From Models
 Custom KPI Calculation With Scheduler
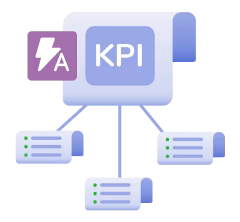 Auto Calculation From Child KPIs
 Show KPI Achievement On Dashboard
 Date Filter on KPI Dashboard


Create Dashboard
From Existing Analysis
Let your business users select existing analysis and build the dashboard
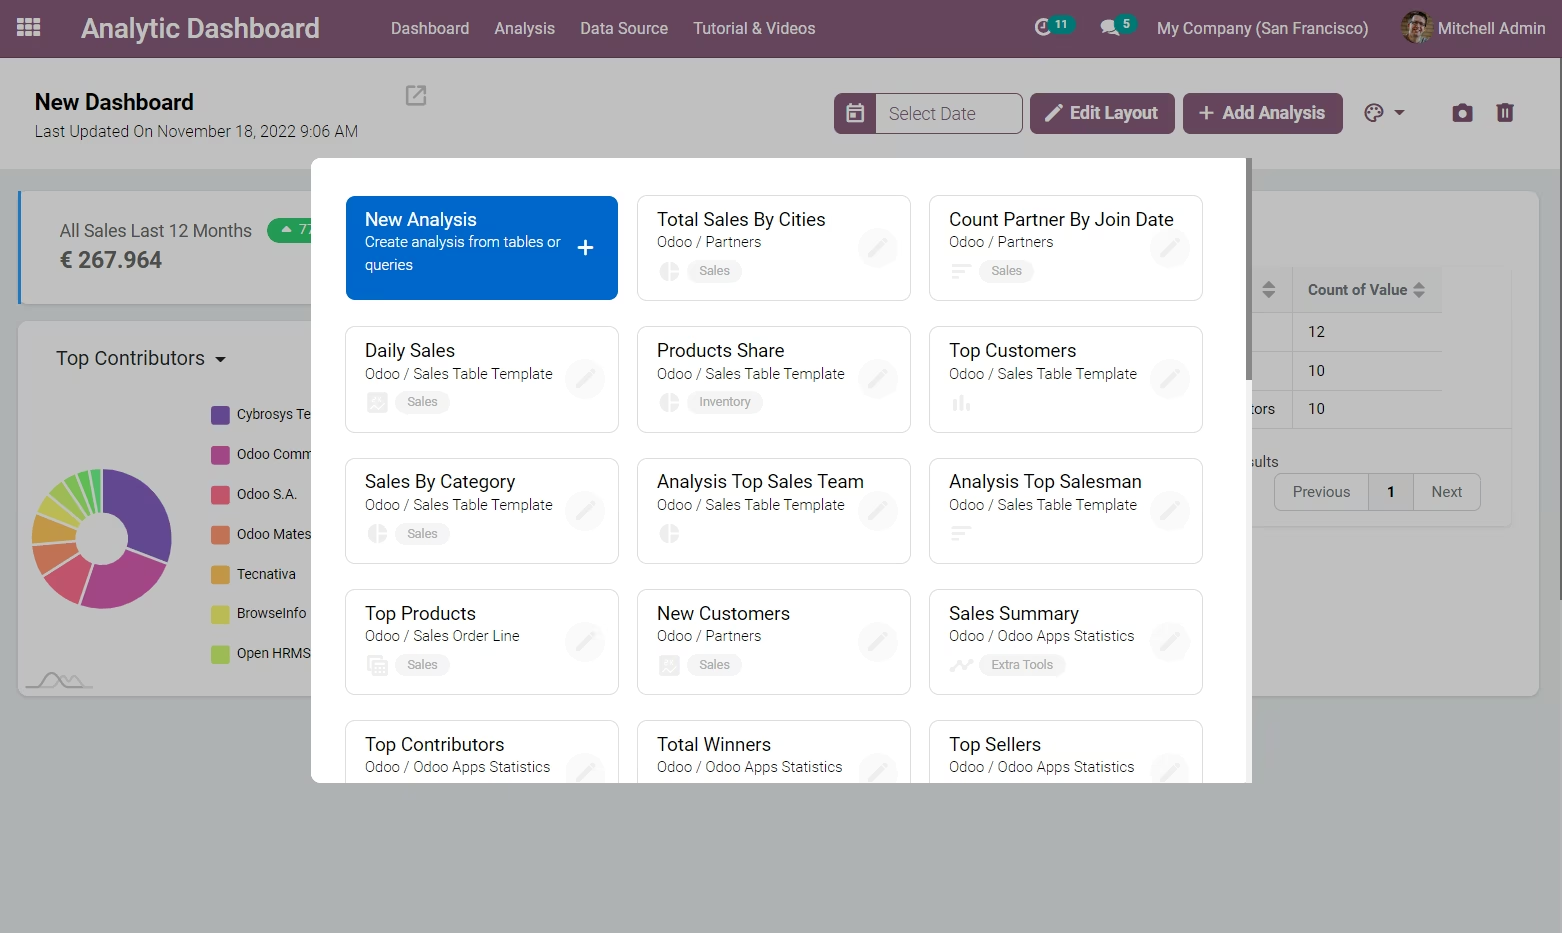
Or Explore New Data
while your data analyst exploring new data in analysis view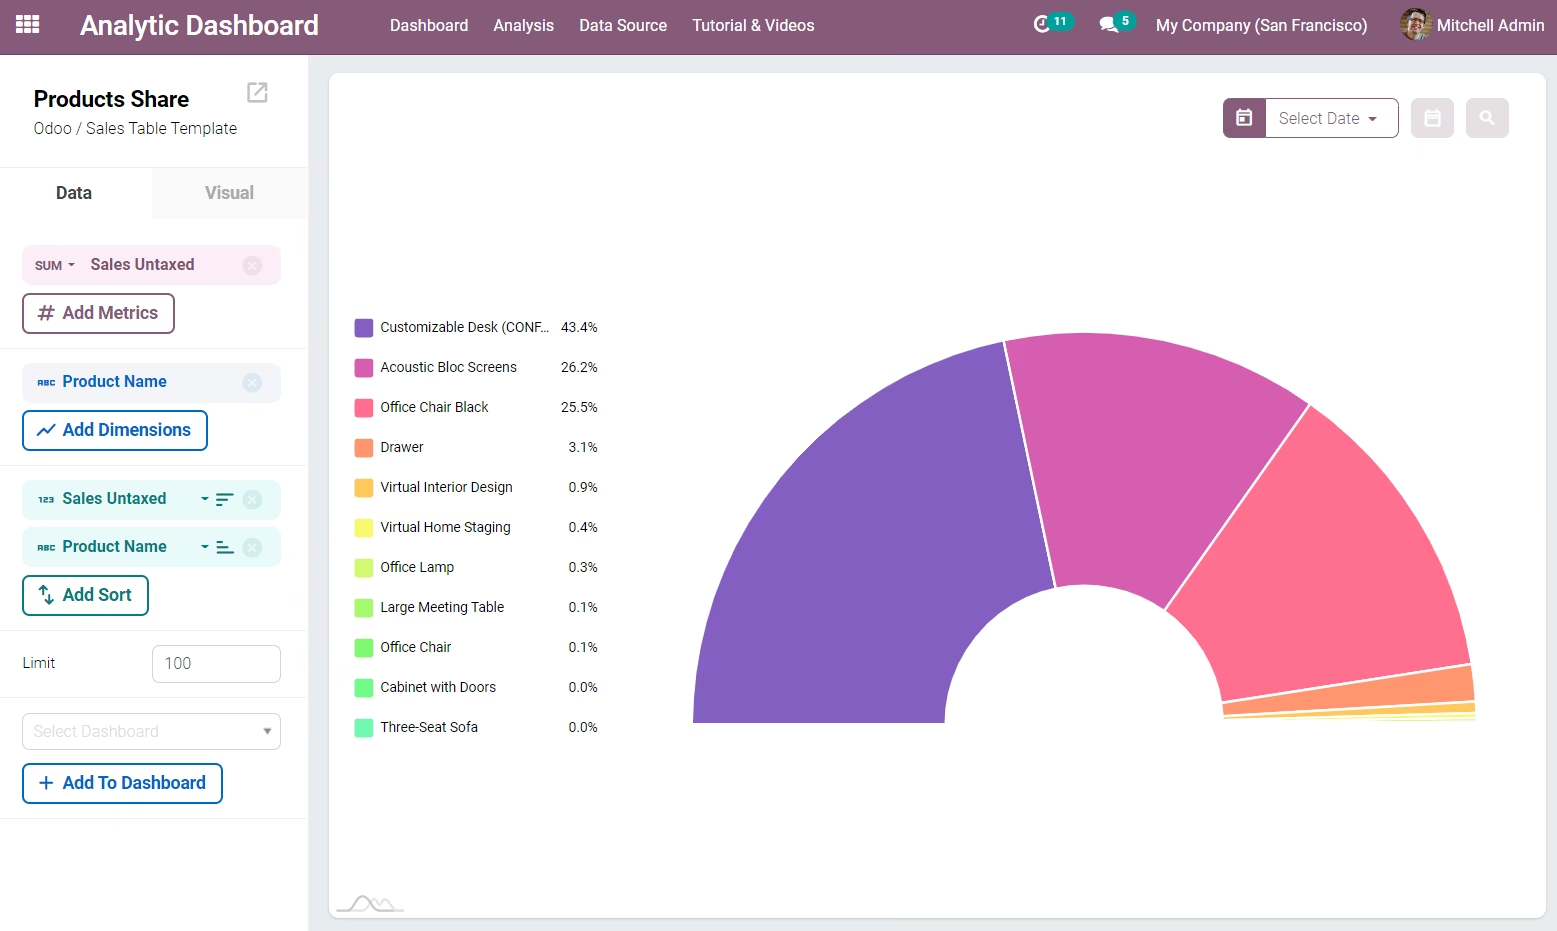
Define Metrics and Dimensions Easily
All the fields from the table will appear on the left panel. You can easily setup your metrics and dimensions by clicking on them. You can also set the order (ascending or descending), the calculation applied for the metrics, and the format for each dimensions.
Customizable
Chart Display
You can change the visual setting of an analysis by clicking the visual tab.
There are several visual types available and more will be added later.
Every chart can also be configured in more detail such as changing the radius of a pie chart, the position of the legends, etc.
Dynamic Filters
Filters can be dynamically added into analysis to make data exploration easier.You can play with the filters on the dashboard level too.
Responsive
Layout
Chart position is dynamic. You can move, resize, edit and zoom in the charts and personalize your dashboard with themes.
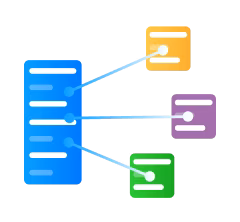
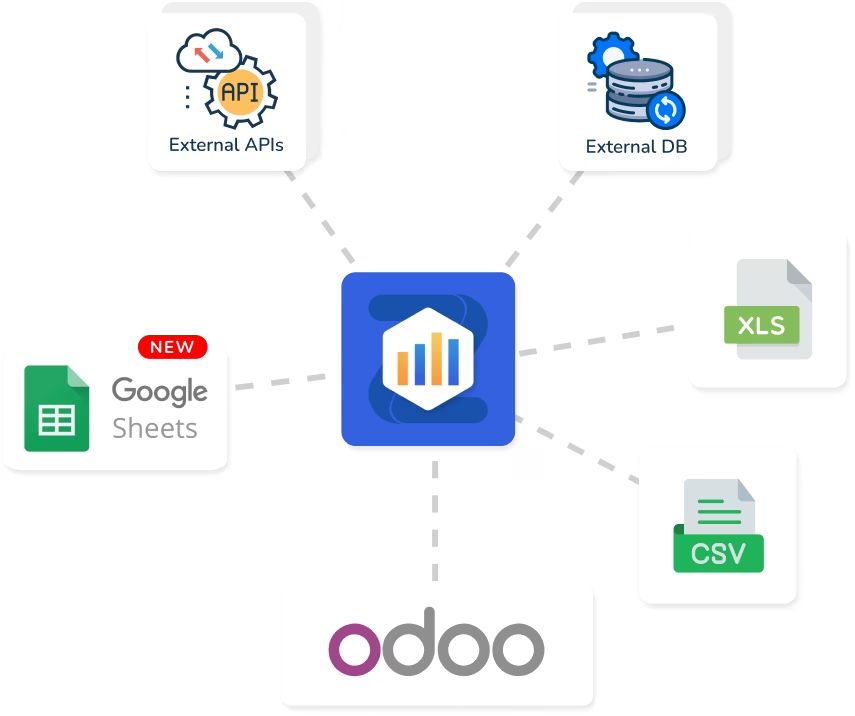
Explore Various Data Sources
Extract data from various data sources. Currently, We have data source connectors to external PostgreSQL and MySQL Databases. (Extension Module - Beta Version)
You can also read data from CSV / XLS files and automatically pull data from Google Sheet and also fetch from external application APIs.
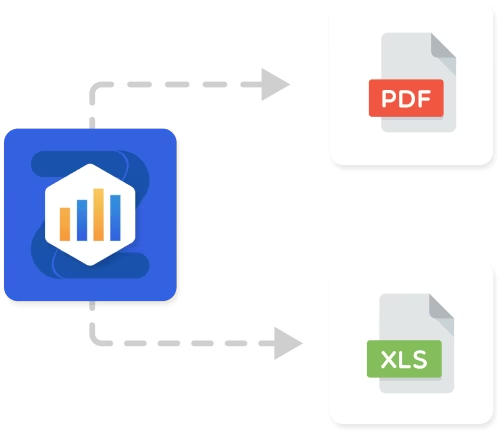
Export and Share The Insights
You can export an Analysis Dataset as an XLS file. And you can capture the awesome dashboard you've been created as a pdf file ready to share.
Get 10++ Extra Themes
Not just aesthetic - color can also convey meaning. It can immediately draw your users eyes to critical information, identify relationships, or highlight potential issues before they become big problems.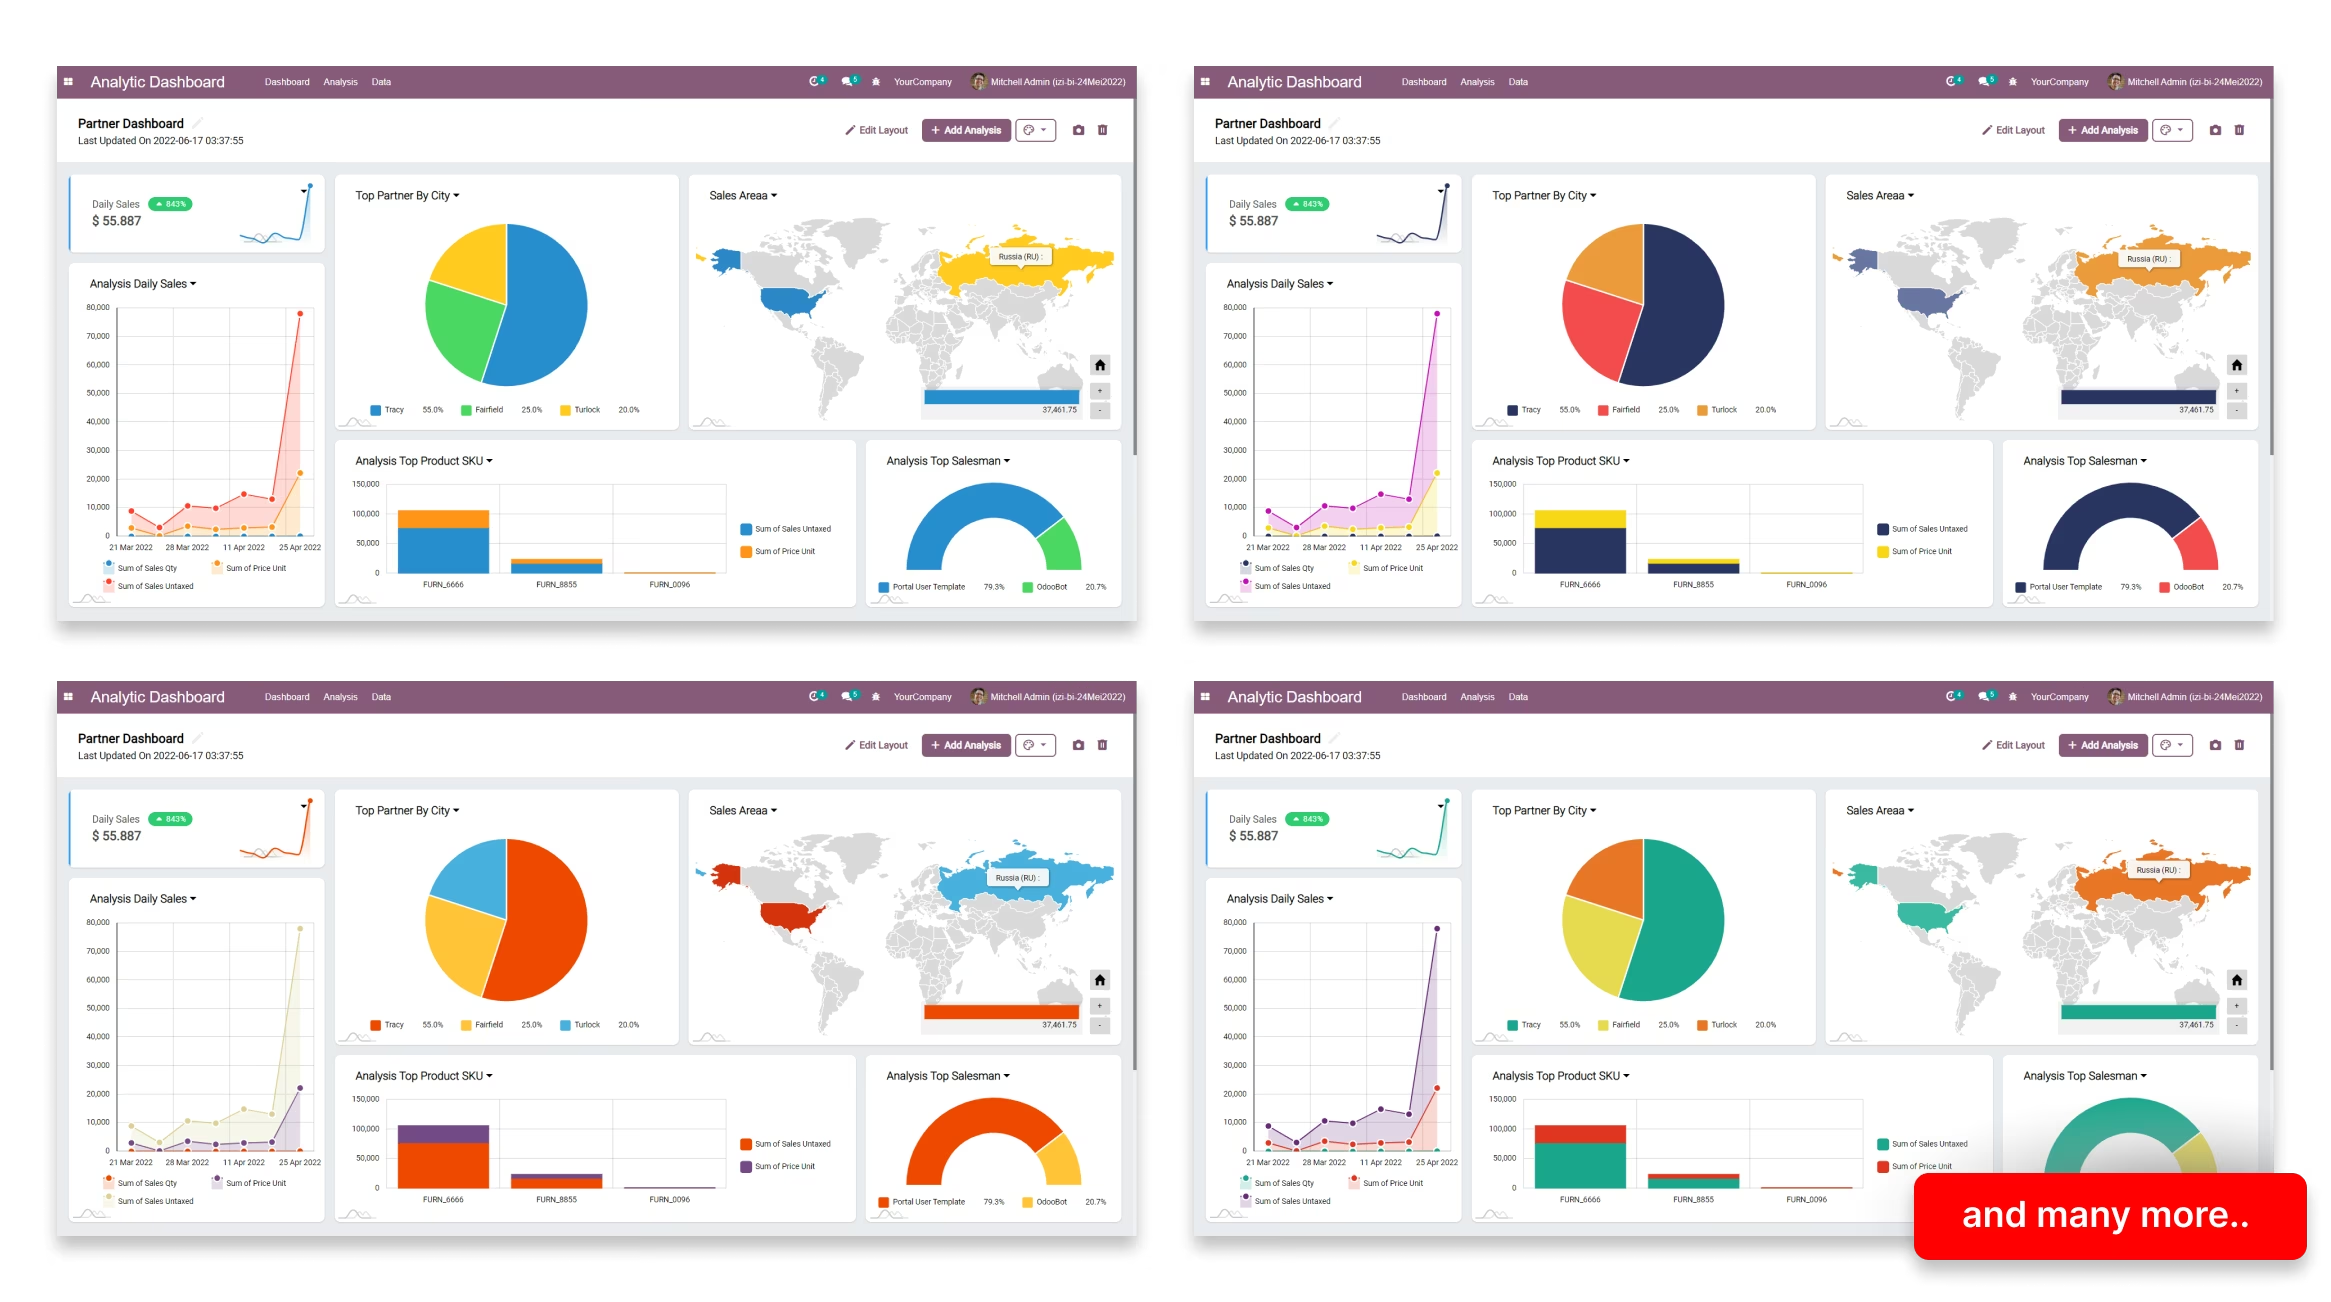
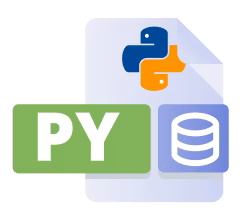
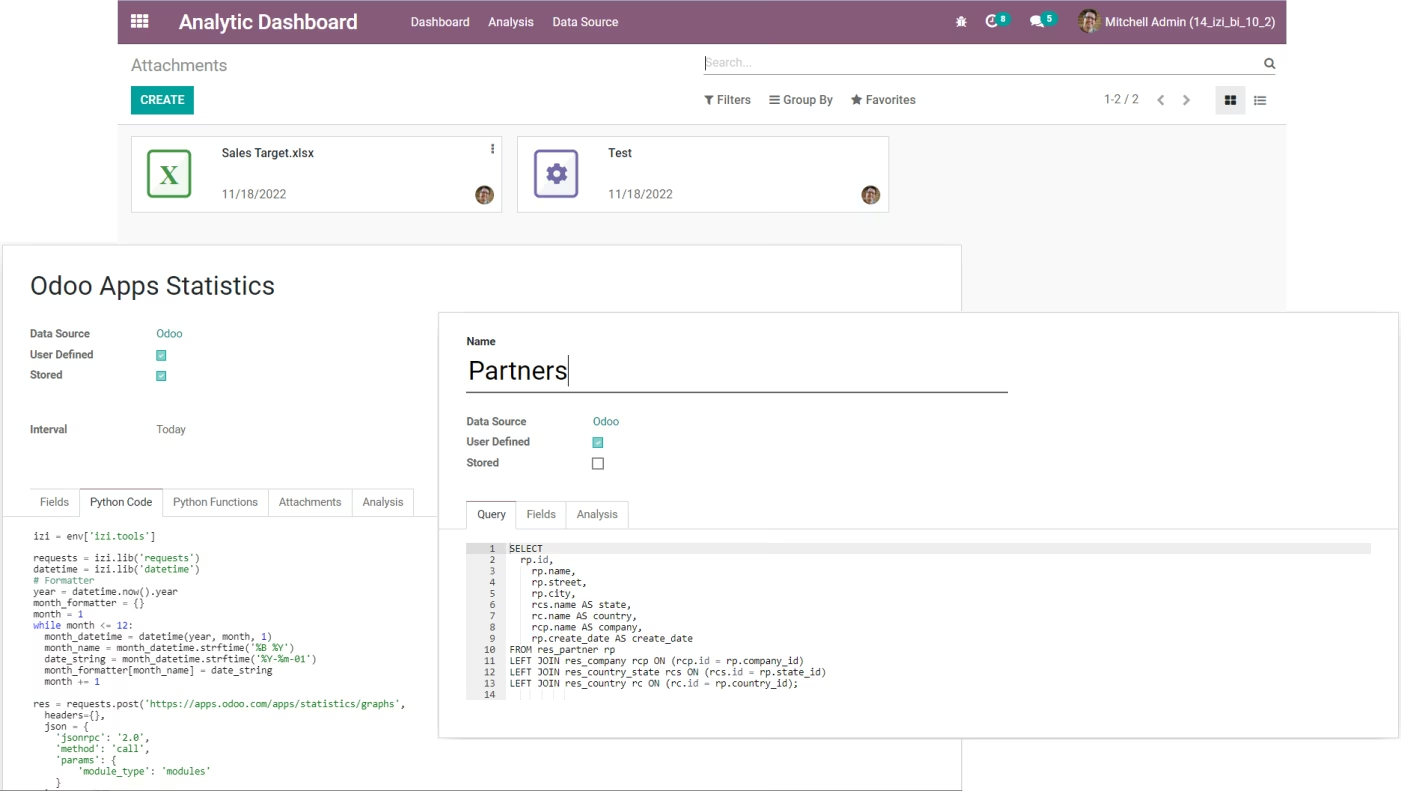
Unlock The Power Of
Queries & Python Codes
Working with something more complex? No problem, you can have an based ETL Tools with SQL Editor, Python Codes, Attachments and Schedulers.Get data from API, joining with CSV files, comparing to Calculation, it is all now possible with IZI Analytic Platform.
Track Company Performance
With Key Performance Indicators
Set your company, department, sales team or employee KPIs easily. Generate periods and import target from CSV.
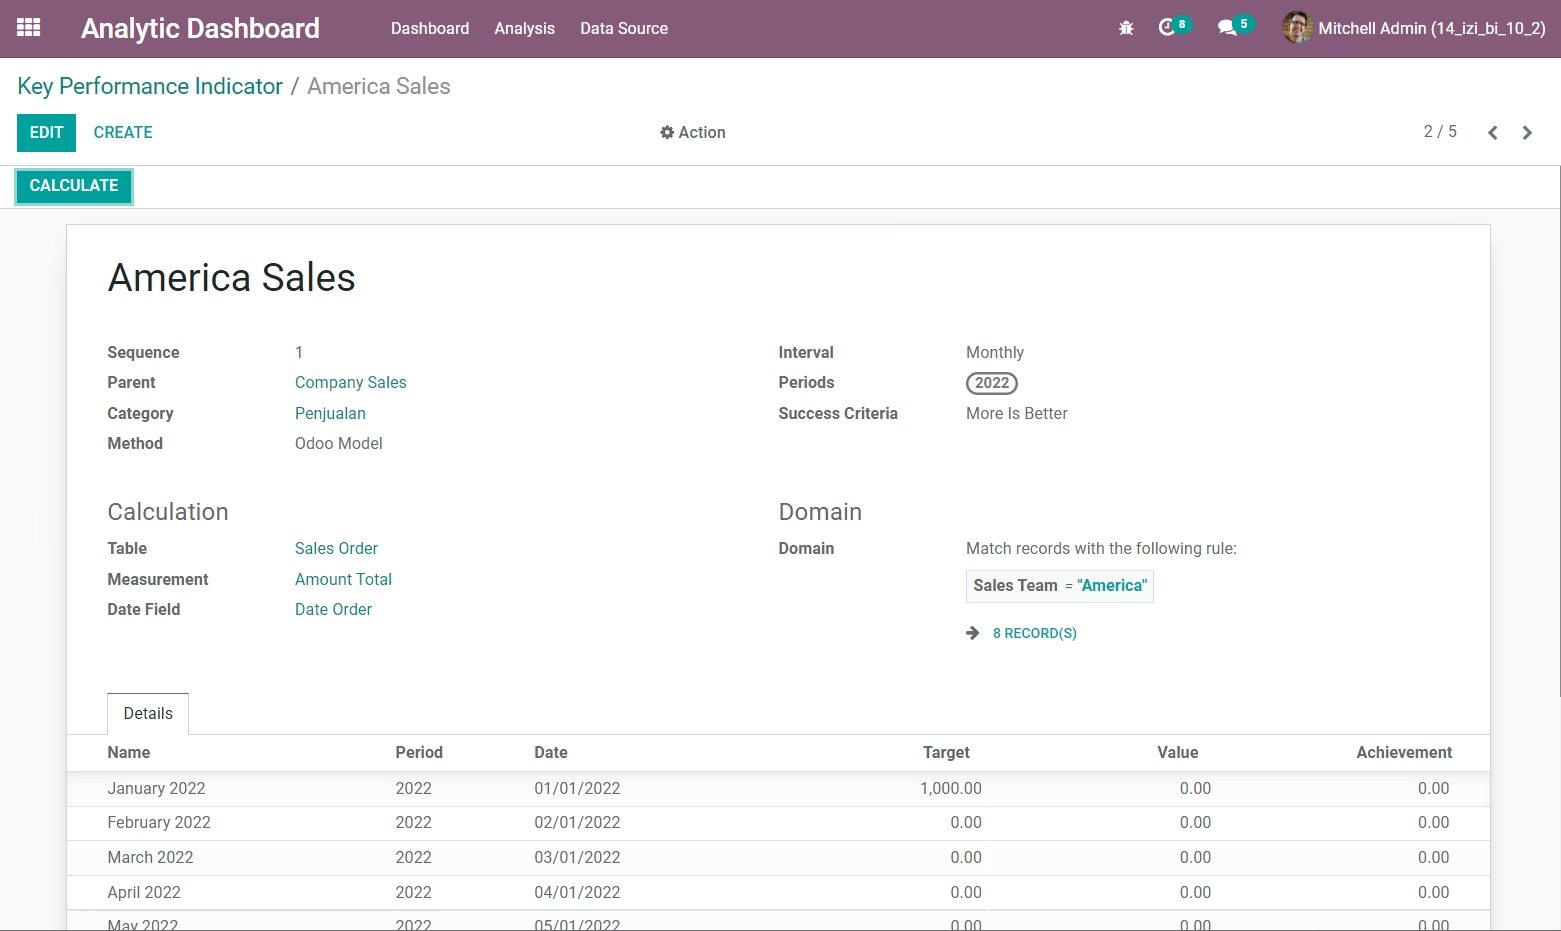
Monitor On Performance Dashboard
Get the KPIs calculation automatically and monitor them on performance dashboard!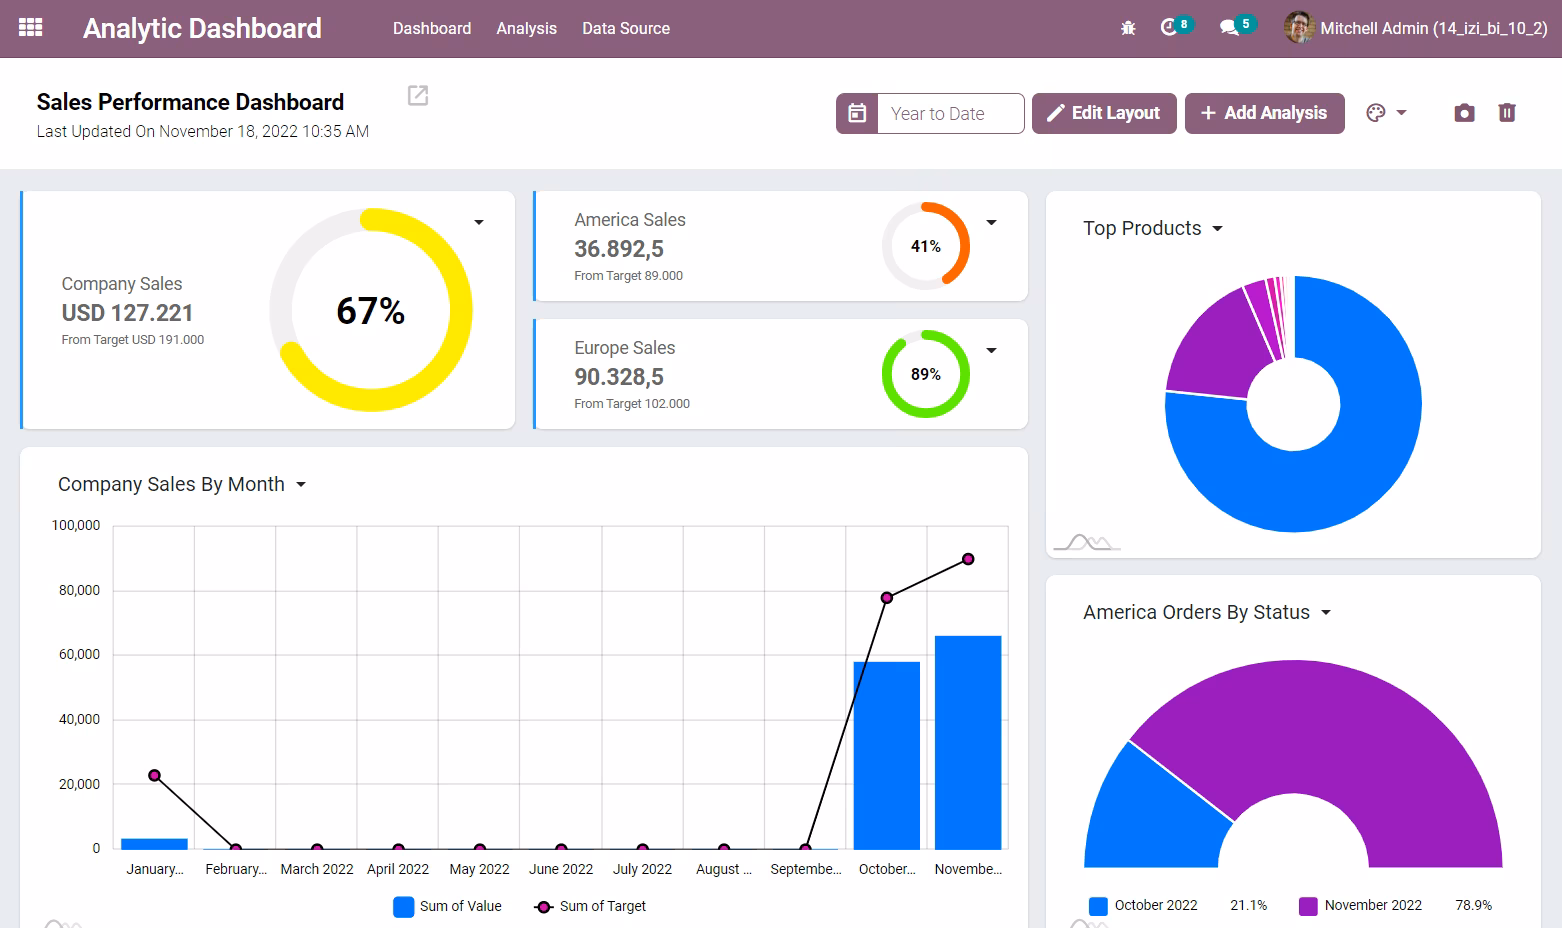
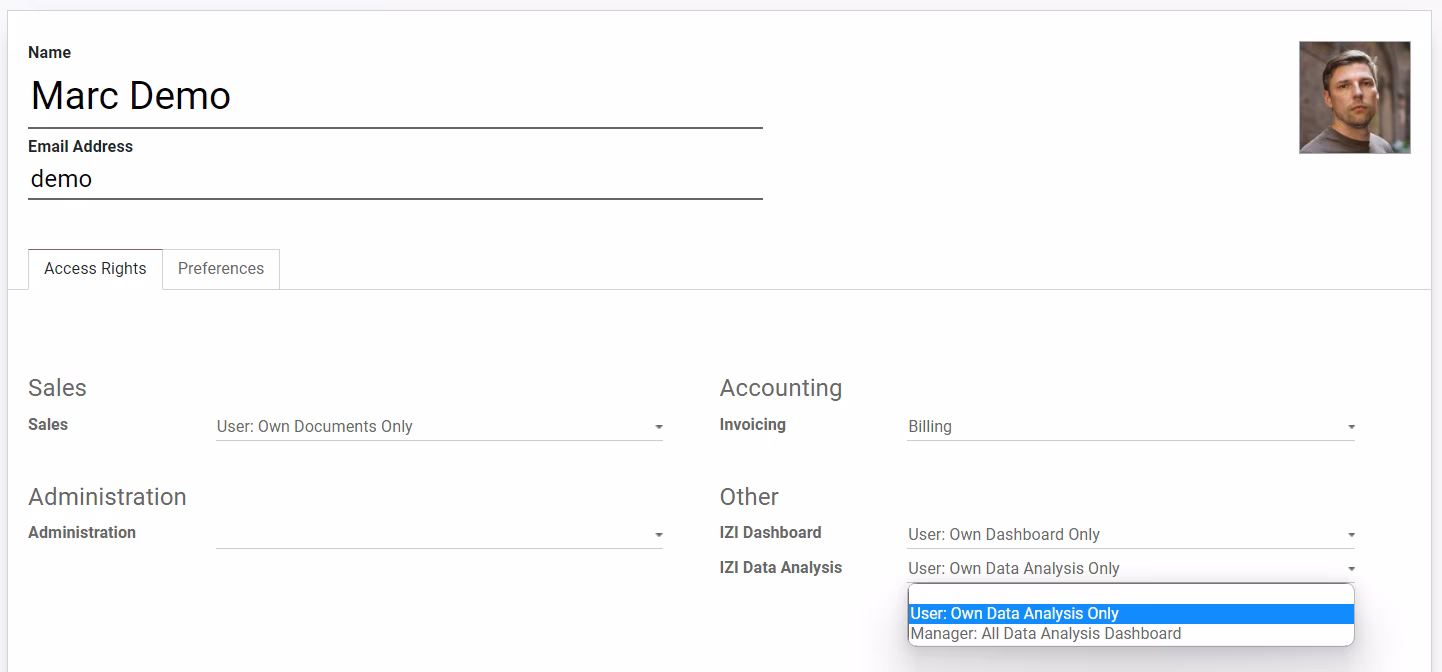
Manage User Permissions
There are always going to be sensitive bits of information in your data.IZI Analytics Dashboard provides 2 user groups to ensure that people on your team only see the data they are supposed to.