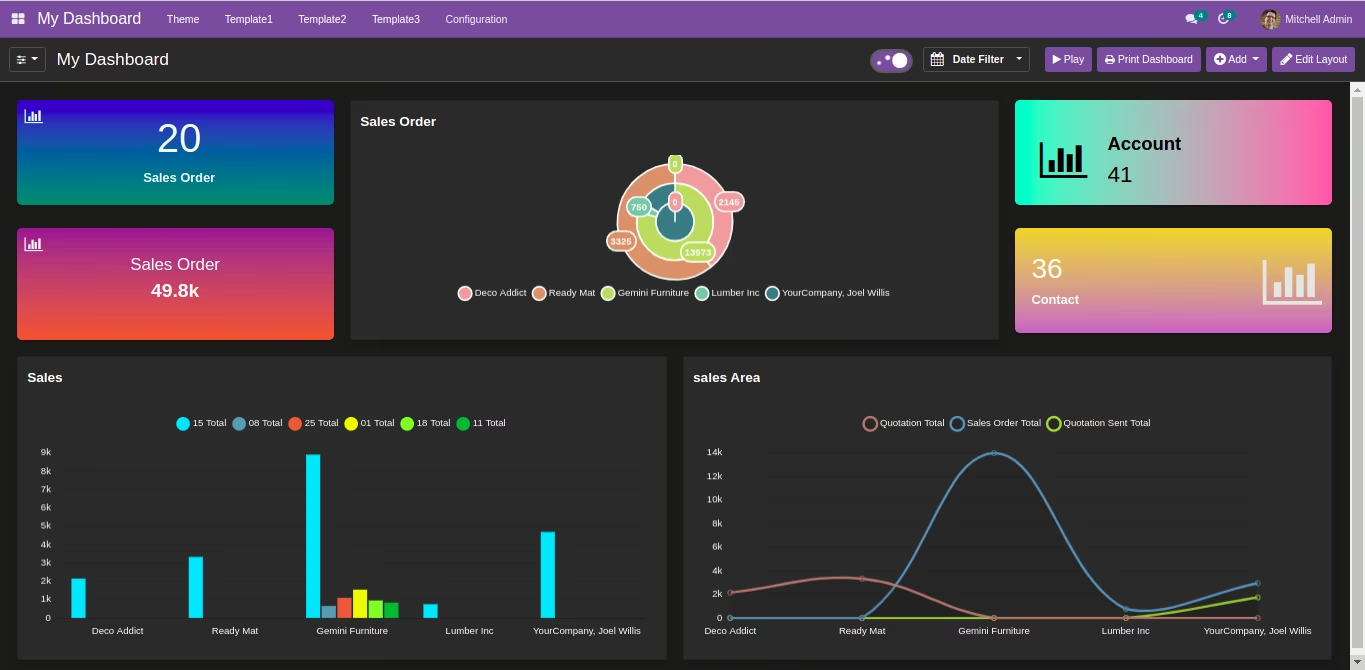
This module empowers users to personalize the look and feel of dashboards with customizable themes, color palettes, layouts, and print-friendly configurations. Tailored for organizations that value branding, visual clarity, and efficient data presentation, it elevates dashboard usability and impact without altering the core reporting mechanics.
Theme designer for customizing dashboard appearance
Configurable color schemes to match branding or user preferences
Layout options for improved data presentation and clarity
Printable and PDF-exportable dashboard views for easy sharing
Seamless integration with existing dashboard widgets and structure
Strengthens visual branding by aligning dashboards with organizational identity
Enhances data readability and presentation through tailored layouts
Empowers users to export visually optimized PDF dashboards
Improves user engagement with a more intuitive and personalized UI
Requires minimal setup maintains core dashboard features while enhancing aesthetics
***The Custom Themes will only be applied on Line Chart, Bar Chart, Horizontal Bar Chart, Area Chart, Polar Area Chart, Pie Chart, Doughnut Charts, Scatter Chart & Radar Chart.

Dashboard Ninja Theme Dashboard Ninja Theme
Make Informed & Rewarding Decisions With Dashboard Ninja Theme
What makes
Dashboard Ninja Theme Unique
The ultimate time and money saving tool for your Business.
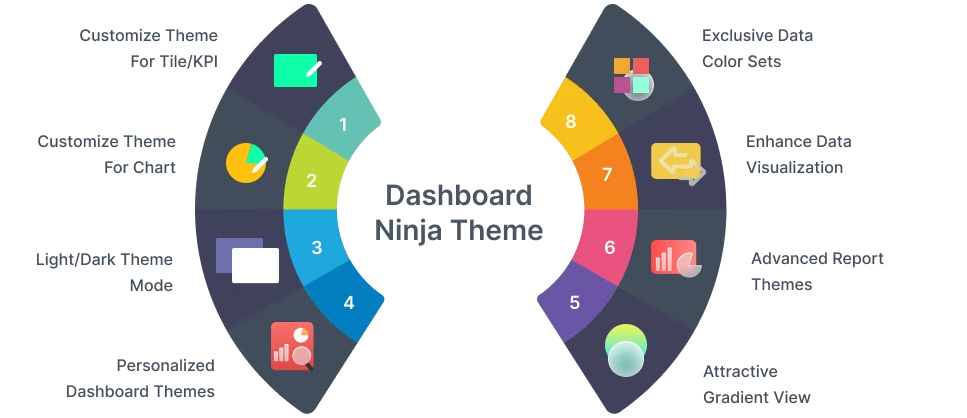

Customize theme for Tile/KPI
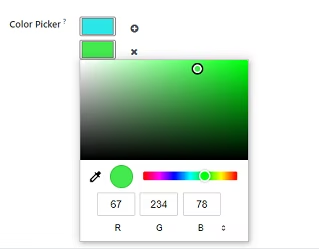
Color Picker
A color picker helps a user to choose multiple colors as per the choice or requirement.
Gradient Angle Slider
With this feature, a user can change the angle of the gradient view. A user can also set gradient angles manually.
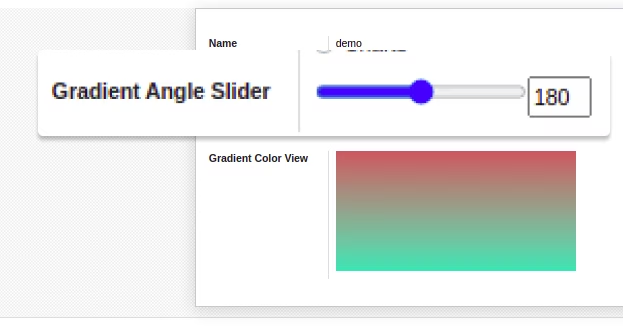
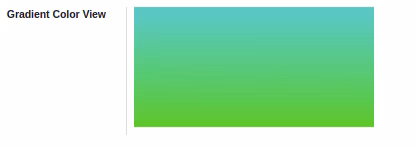
Gradient Color View
Gradient Color View helps a user to see the color pattern of the dashboard items.

Customize theme for Chart
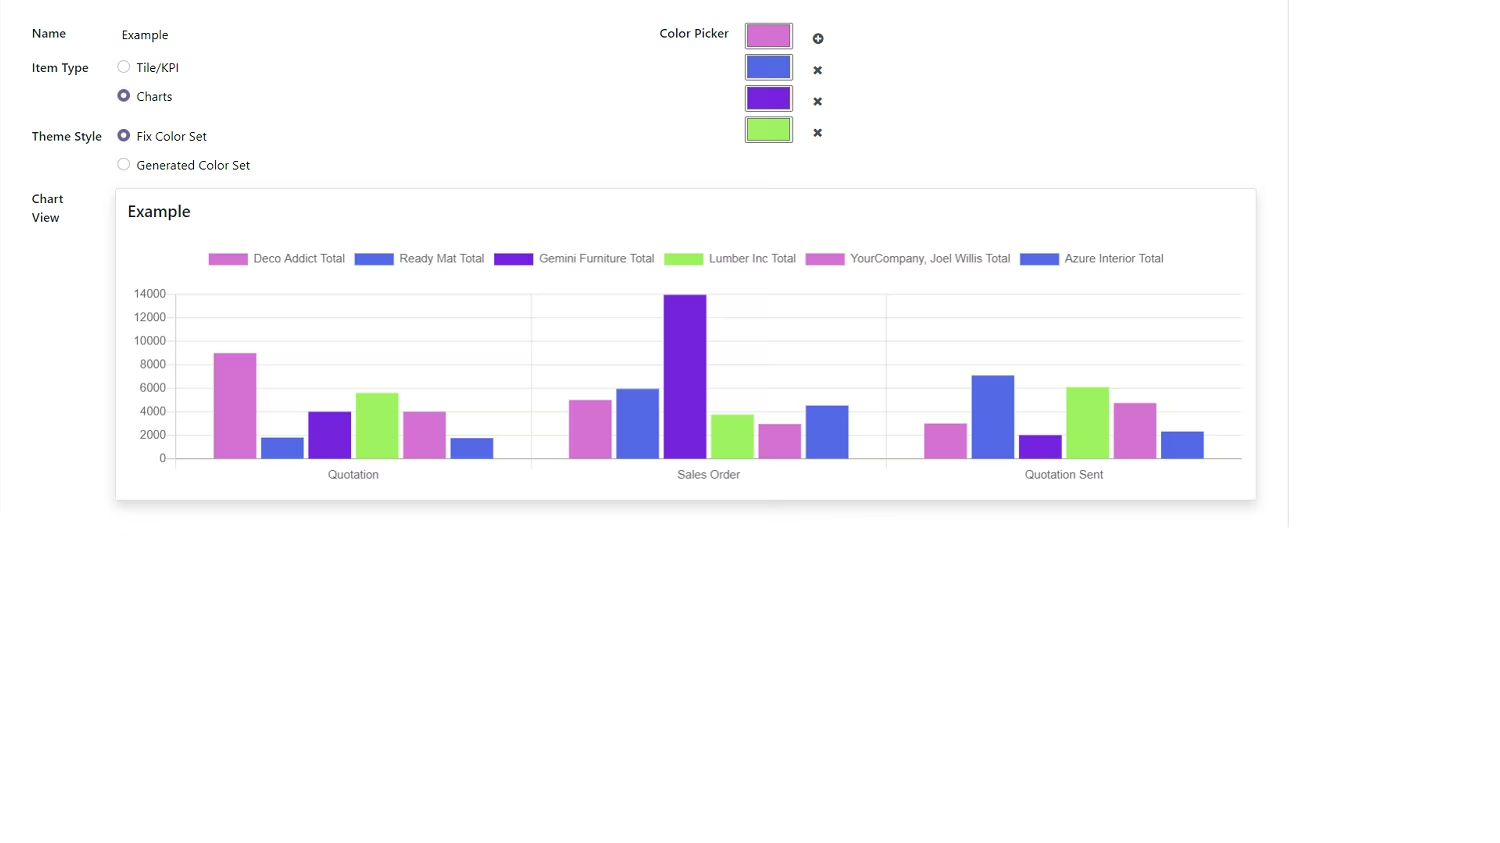
Color Picker
A color picker helps a user to choose multiple colors as per the choice or requirement.
Fixed color set
In a fixed color set, the fixed data color set keeps repeating as it is from the chosen color palette range.
Generated color set
In a Generated color set, multiple data color sets are generated from the chosen color palette range.
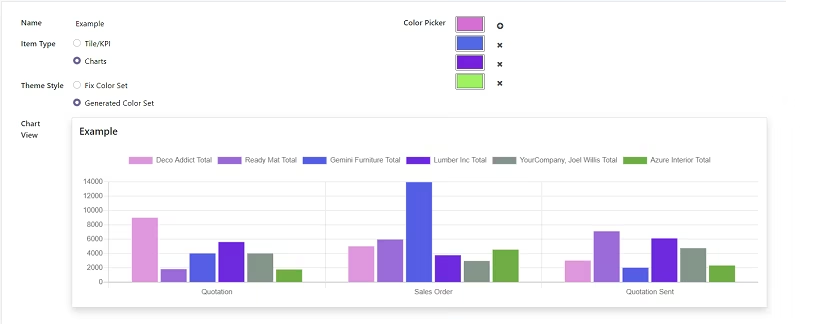
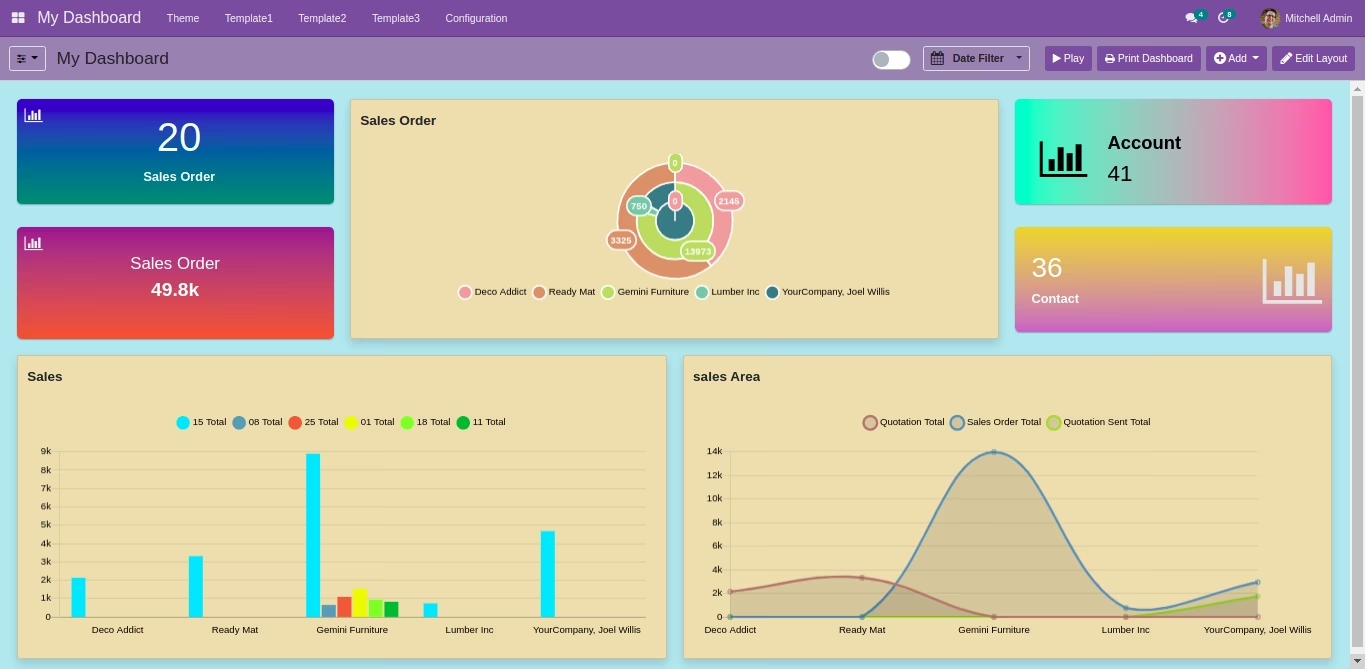
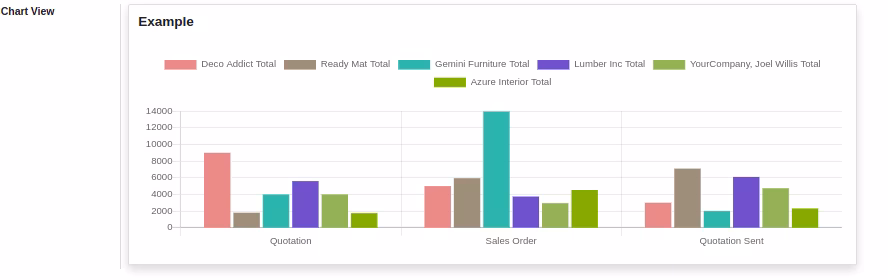
Chart view
It displays graphical representations of data with chosen color patterns for greater visualization.

Light/Dark
Toggle Button
With the all-new light and dark theme mode option, a user can change the view of the dashboard from light to dark or vice versa for comfortable reading and visualization.

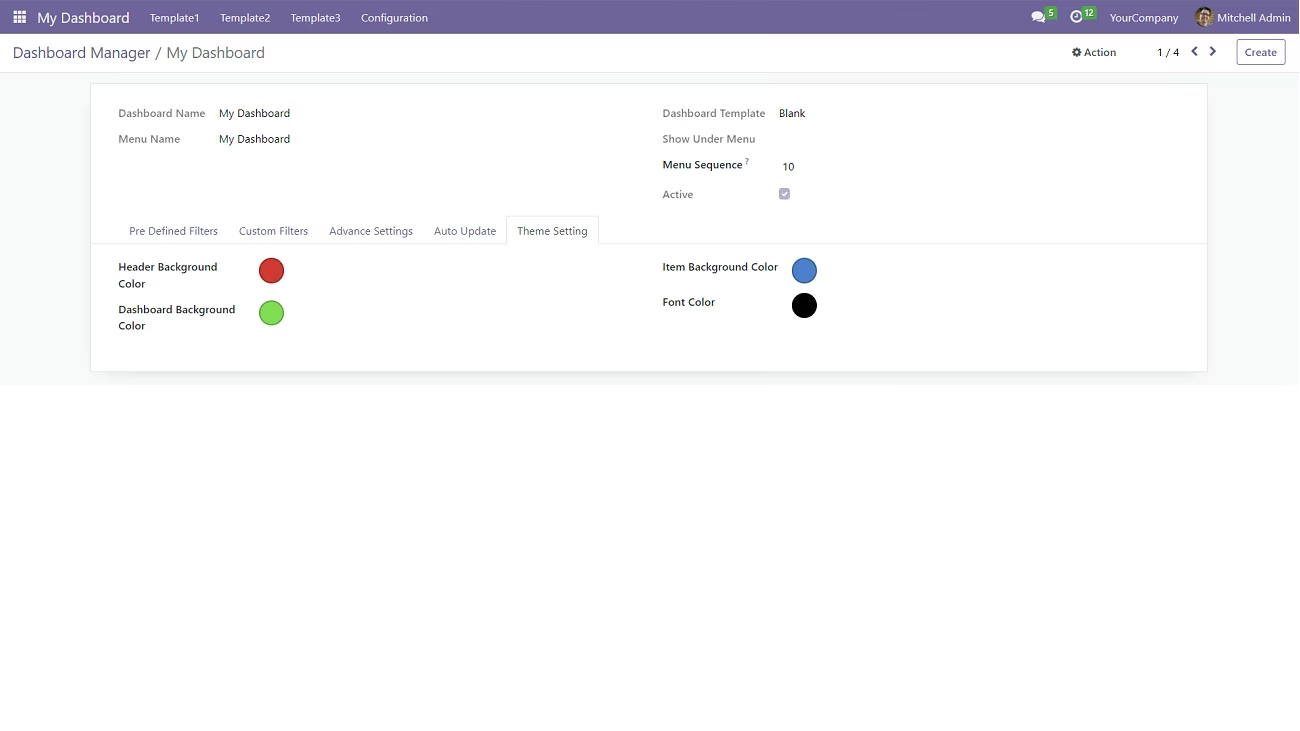
Custom
Dashboard Theme
Now a user can customize the Header background color, Dashboard background color, Item background color, and Font color of the dashboard to improve the visibility of business analytics.
All Features
Dynamic & Animated Reporting Dashboards
Real-Time
Streaming Dashboard
Responsive: Fluid
& Flexible Layout
Advanced
Date Filter
Download Dashboard Items (Excel, CSV, PDF, PNG)
Export & Import Dashboards or Specific Dashboard Items
Access
Control
Predefined
Dashboards
Drill Down/
Drill Up Data
Community/Enterprise/
.sh Support
Duplicate/
Move Dashboard
Customizable
Dashboard Tile Items
Data Filtration -
Group By, Limit & Sort By
Dashboard Item -
2 List View Styles
Design Multiple
Dashboards
Dashboard Personalization
/Configuration
Personalized & Interactive Dashboard Layouts
View Dashboard
Item Data
Multi-Color
Themes
Set Targets

Unique User
ID (%UID)

Authentic
%MYCOMPANY Filter

To do item

Instant
Edit Mode

Number
Systems

Show/Hide
Data Values

Monetary/
Custom Units

Multi-Company
Support

Multi-Language
Support

Multi-Currency
Support