This module enhances the portal experience in by delivering an attractive, interactive dashboard for portal users. Visitors can view key records at a glance through count cards, access document tables, and explore graphical summaries of activities. Designed to enrich self-service interactions, this dashboard promotes informed user engagement and streamlines portal navigation.
Displays record counts in visually engaging dashboard cards
Provides users with quick access to documents via table views
Includes graphical summaries to visualize sales, invoices, tasks, and more
Designed specifically for portal users to improve self-service and engagement
Enhances user experience by offering informative, branded dashboards instead of plain menus
Supports portal users with quick visibility into relevant documents and actions
Encourages efficient navigation and reduces manual searching
Boosts portal adoption with clean, visual, and interactive design
Website Portal Dashboard App
Portal Charts for Sales, Purchase & Invoices
Website Dashboard for Portal Users App
Web Dashboard and Analysis Chart view for Portal Access App
Portal Dashboard app helps user to show attractive website dashboard for portal users. Portal user can see different records with counts and different analysis chart for sales , purchase, invoice, bills, sold products and purchased products, also can see latest quotations, sales orders, RFQs, and purchase orders, invoices and bills with status and projects and task from portal view, Also can filter all charts by today, week, month, year.
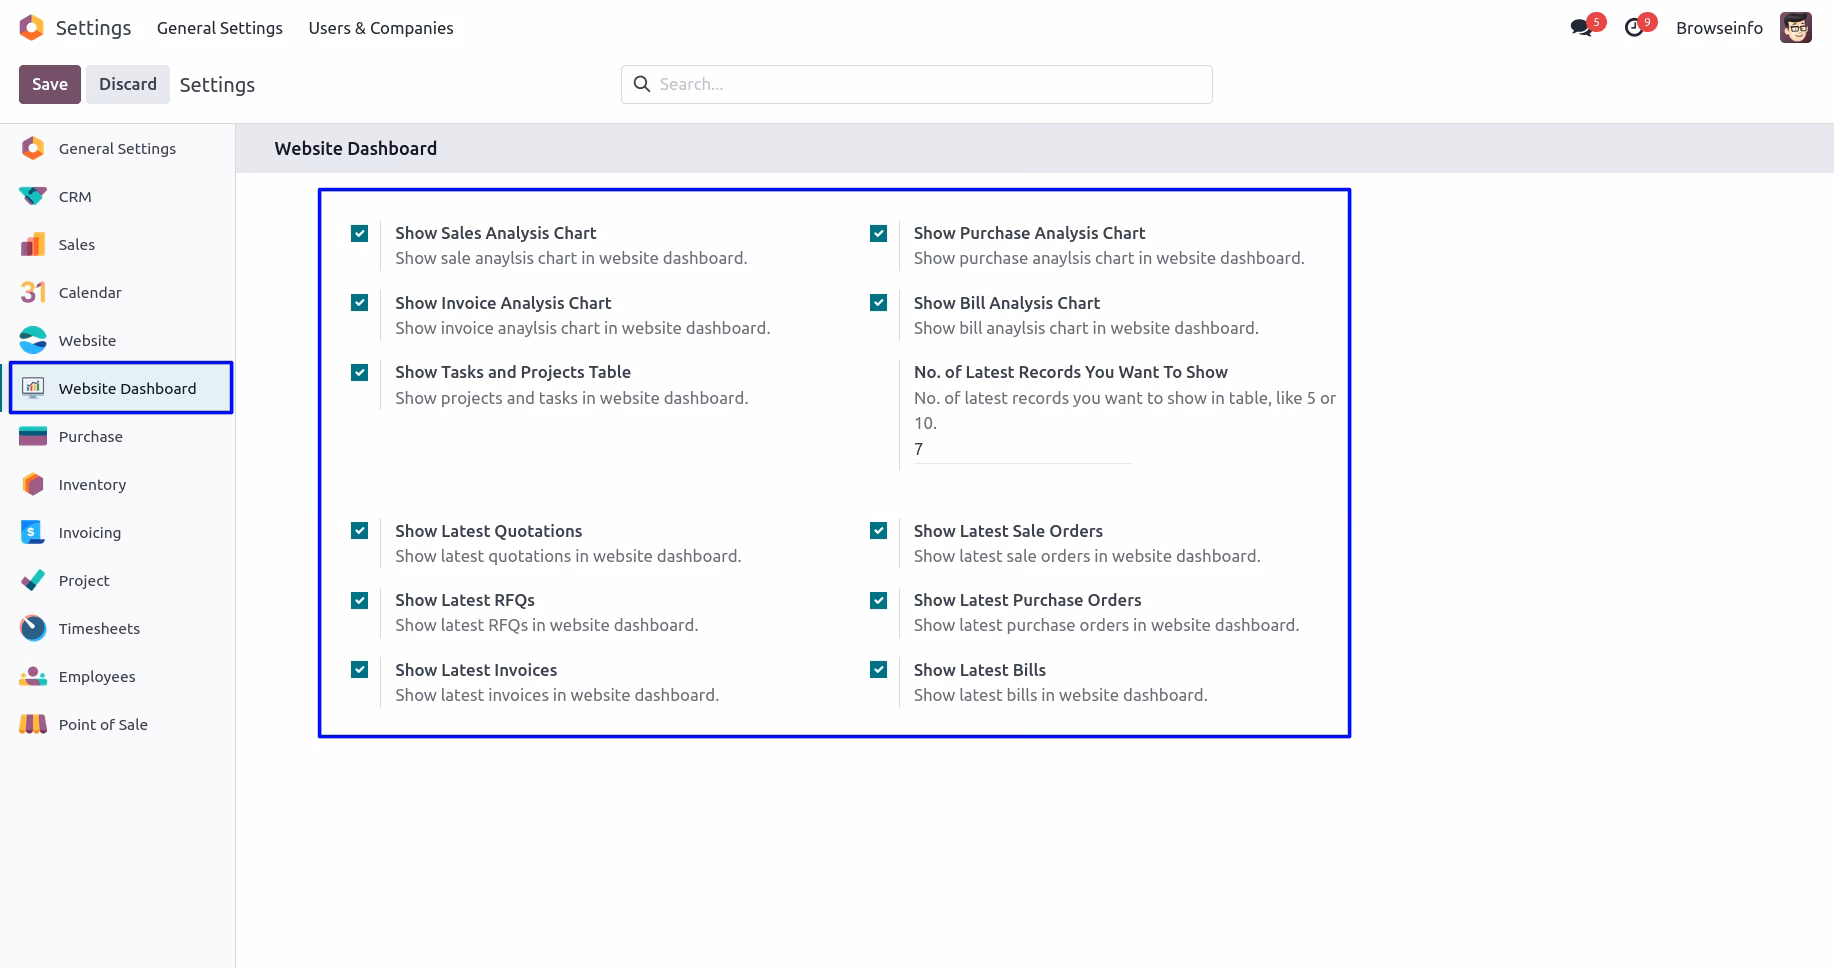
Under "Settings" menu user can configure website dashboard, User have to enter "No. of Latest Records You Want To Show" and as per this number record will show on dashboard.
Dashboard Tiles
Under "My Account" user can see dashboard, On dashboard tiles user can see different informations with counts.
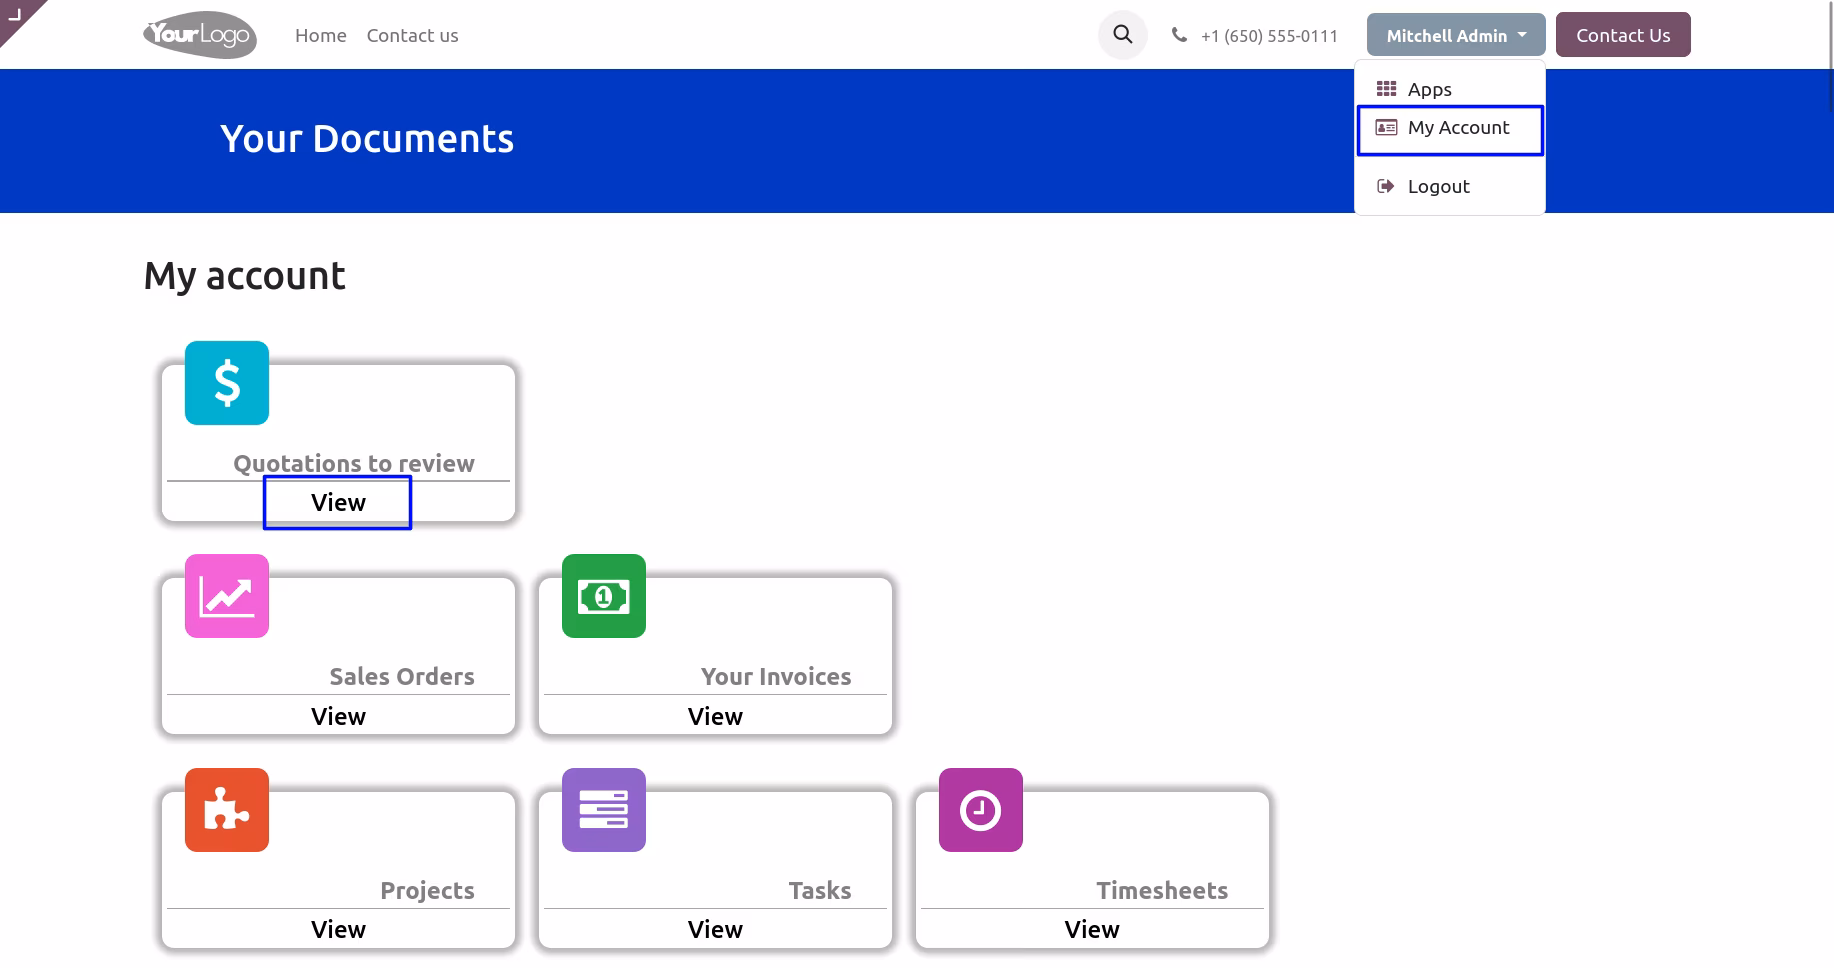
When user clicks on particular tiles then, tiles title and details will shown.
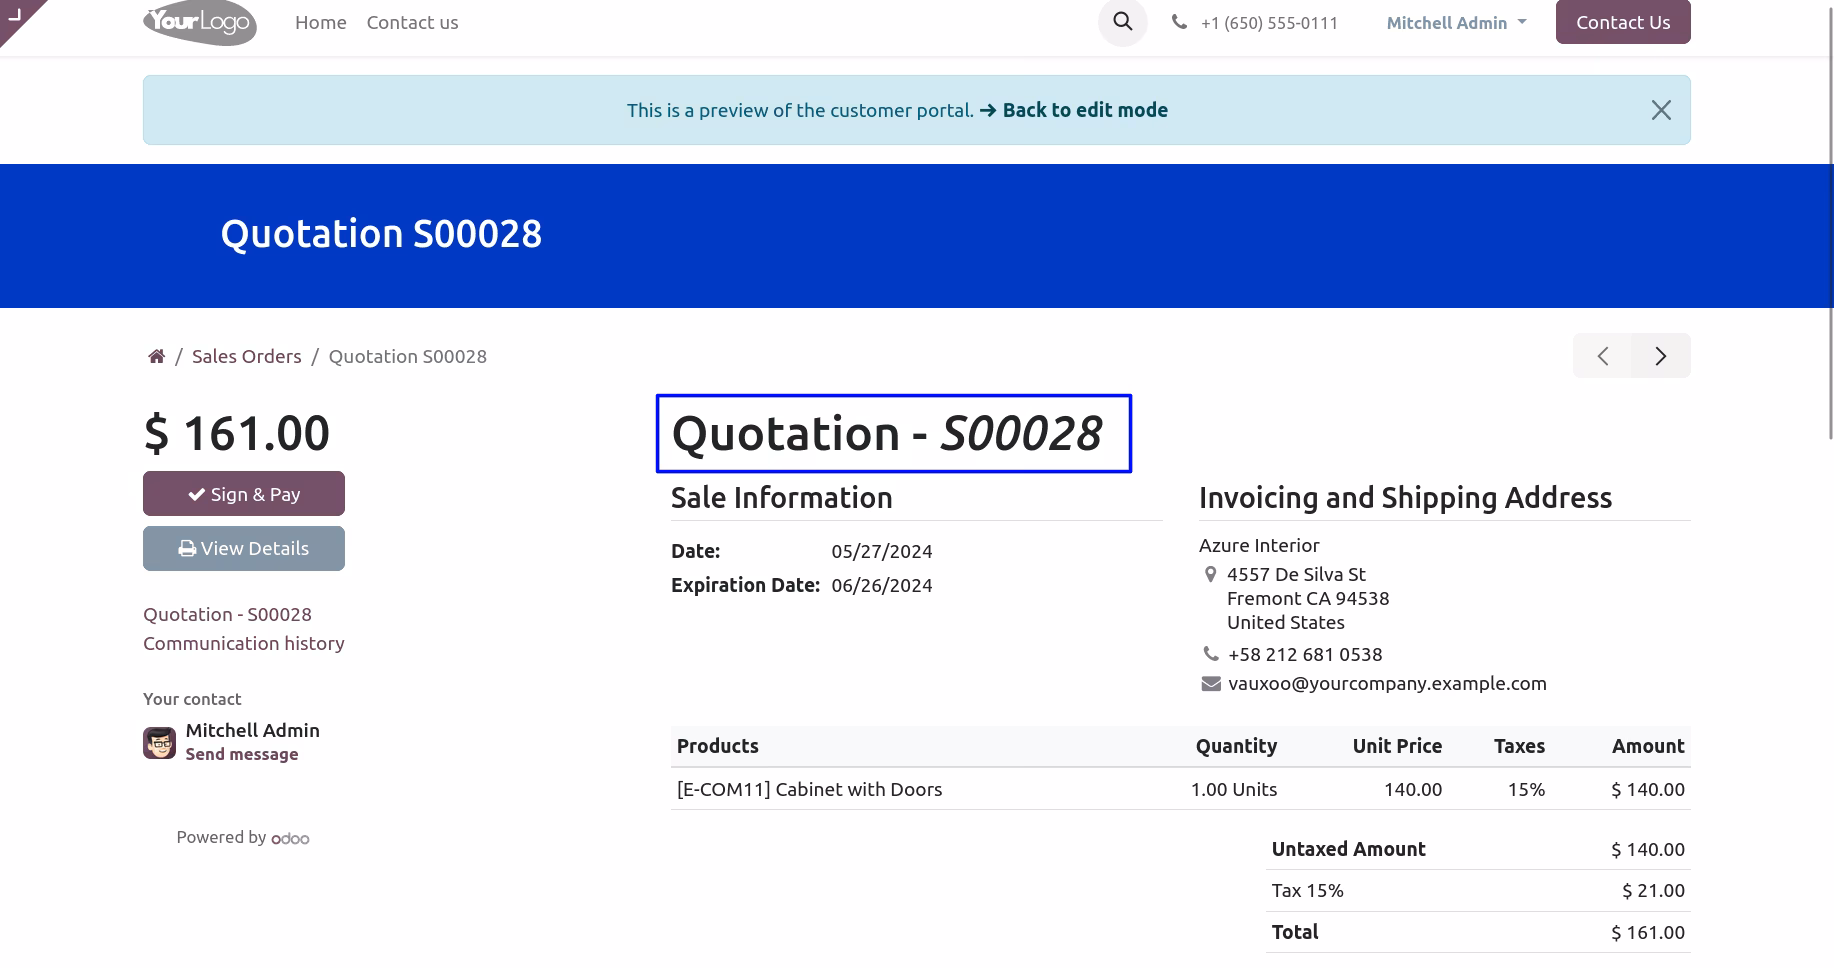
User can also open documents from here.
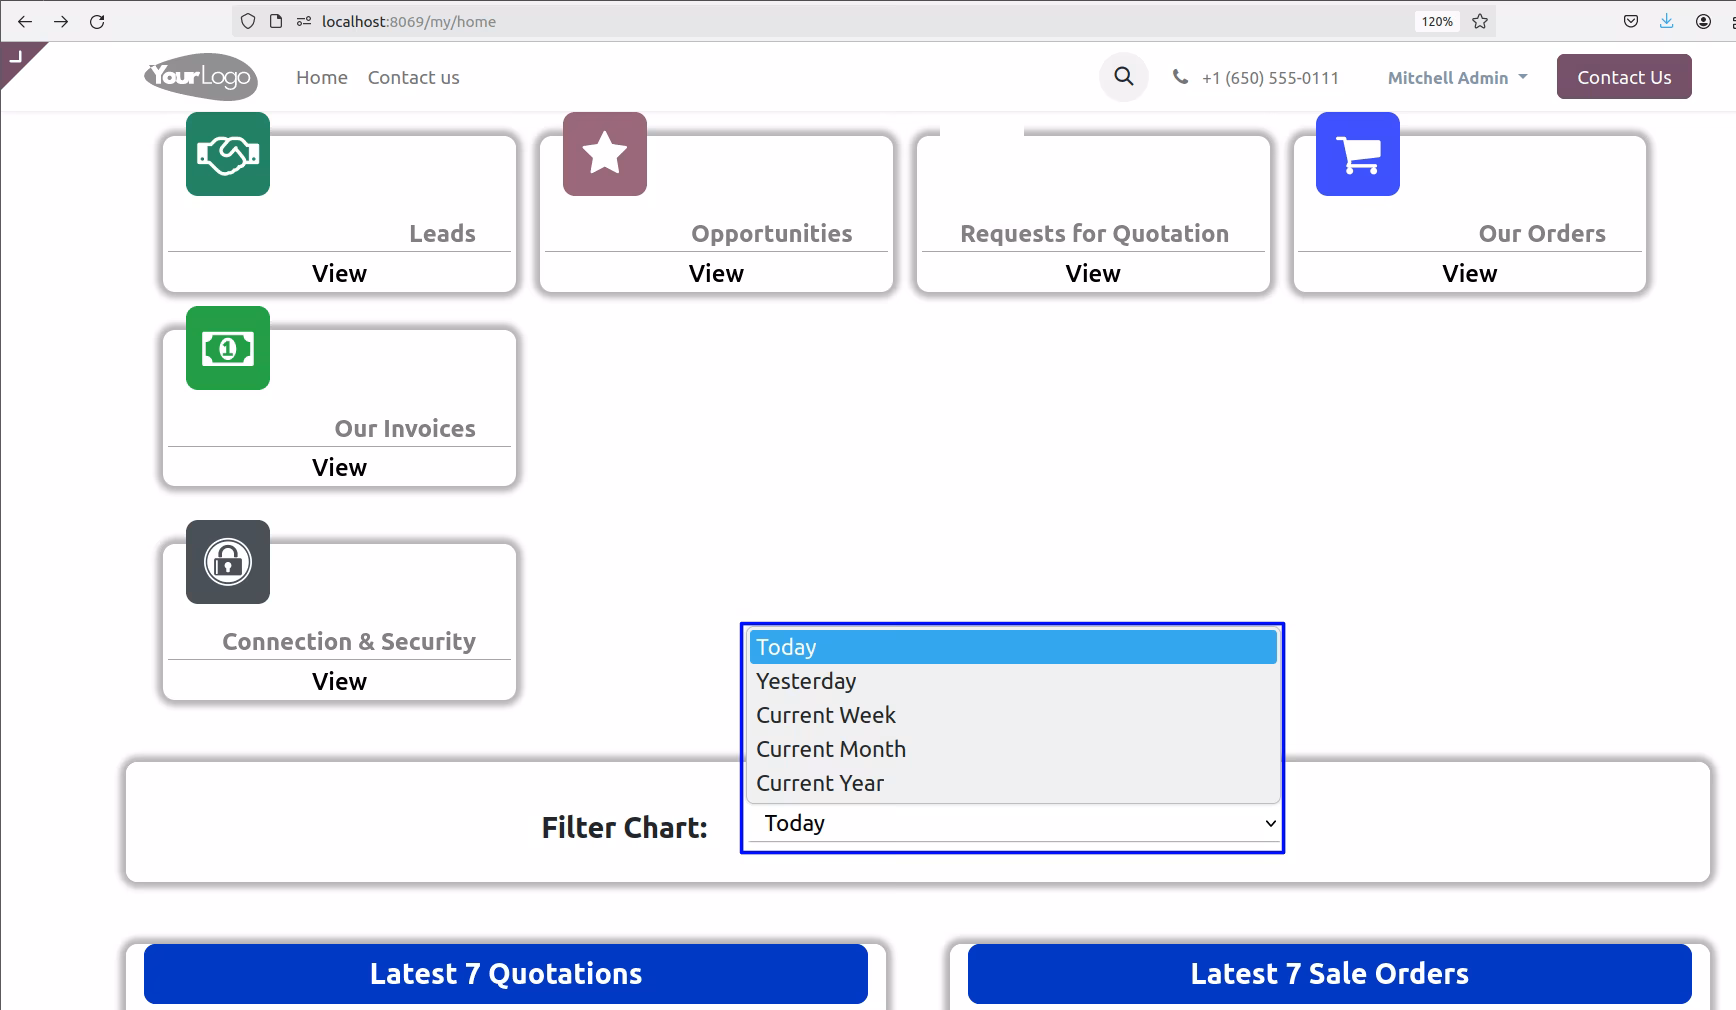
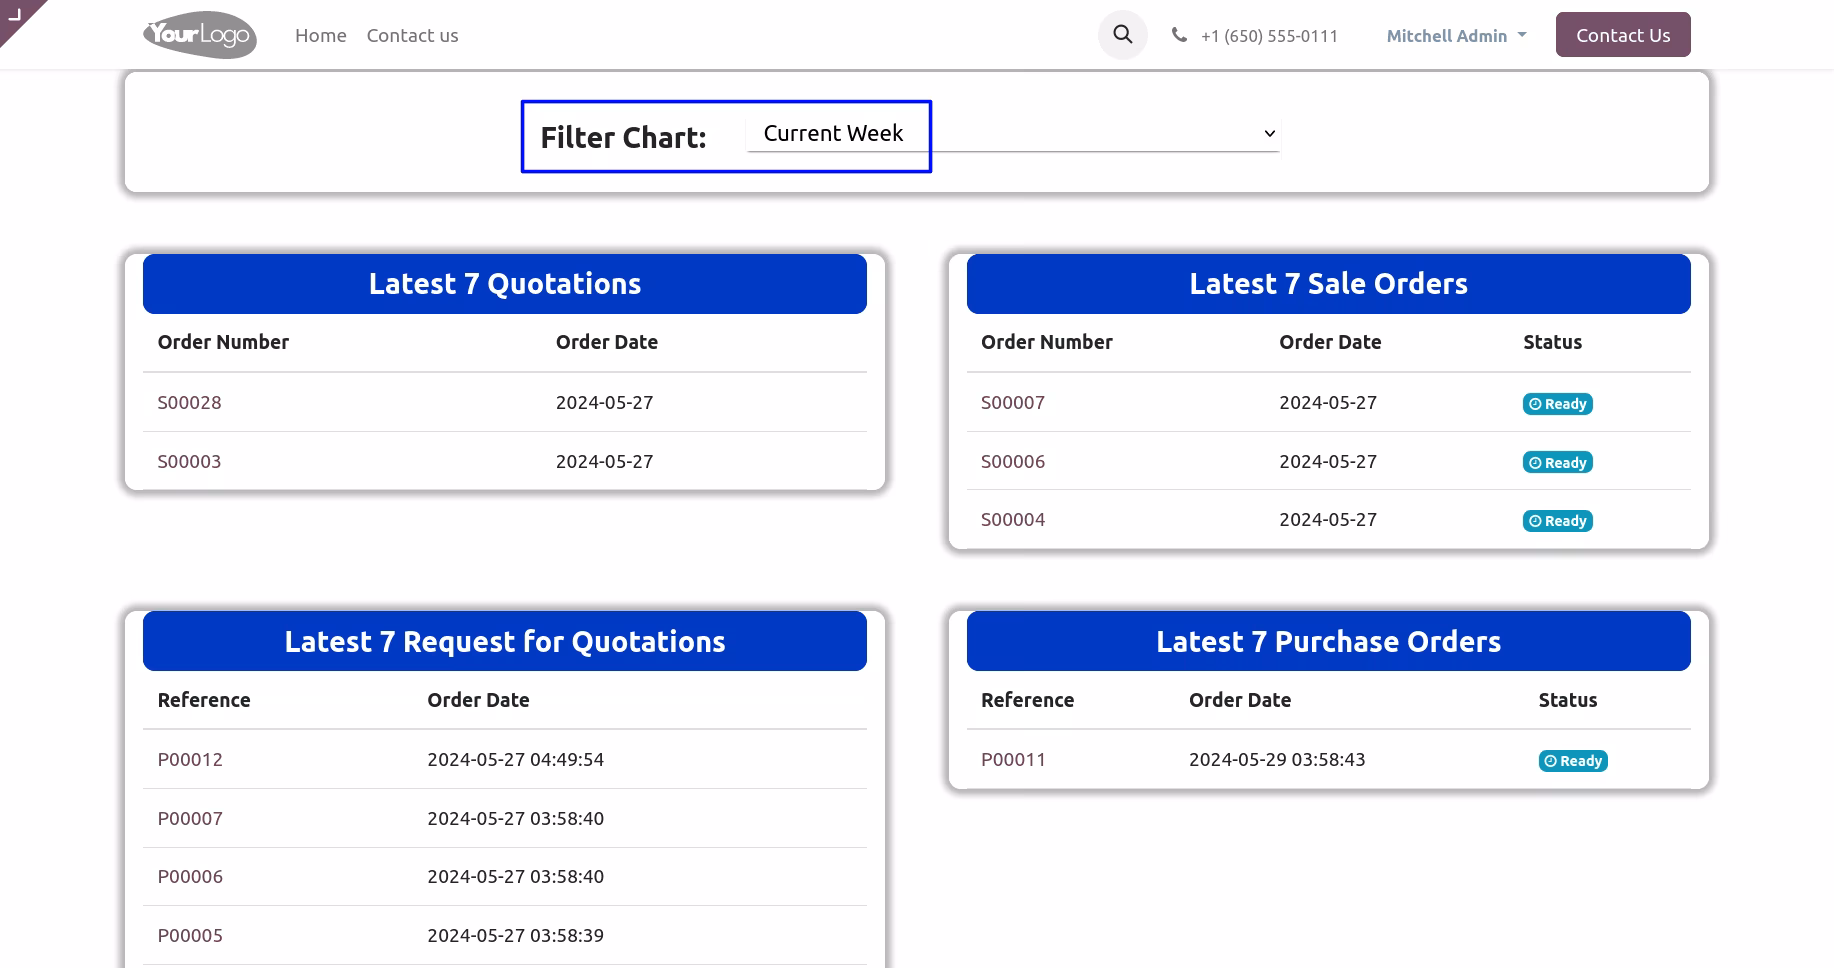
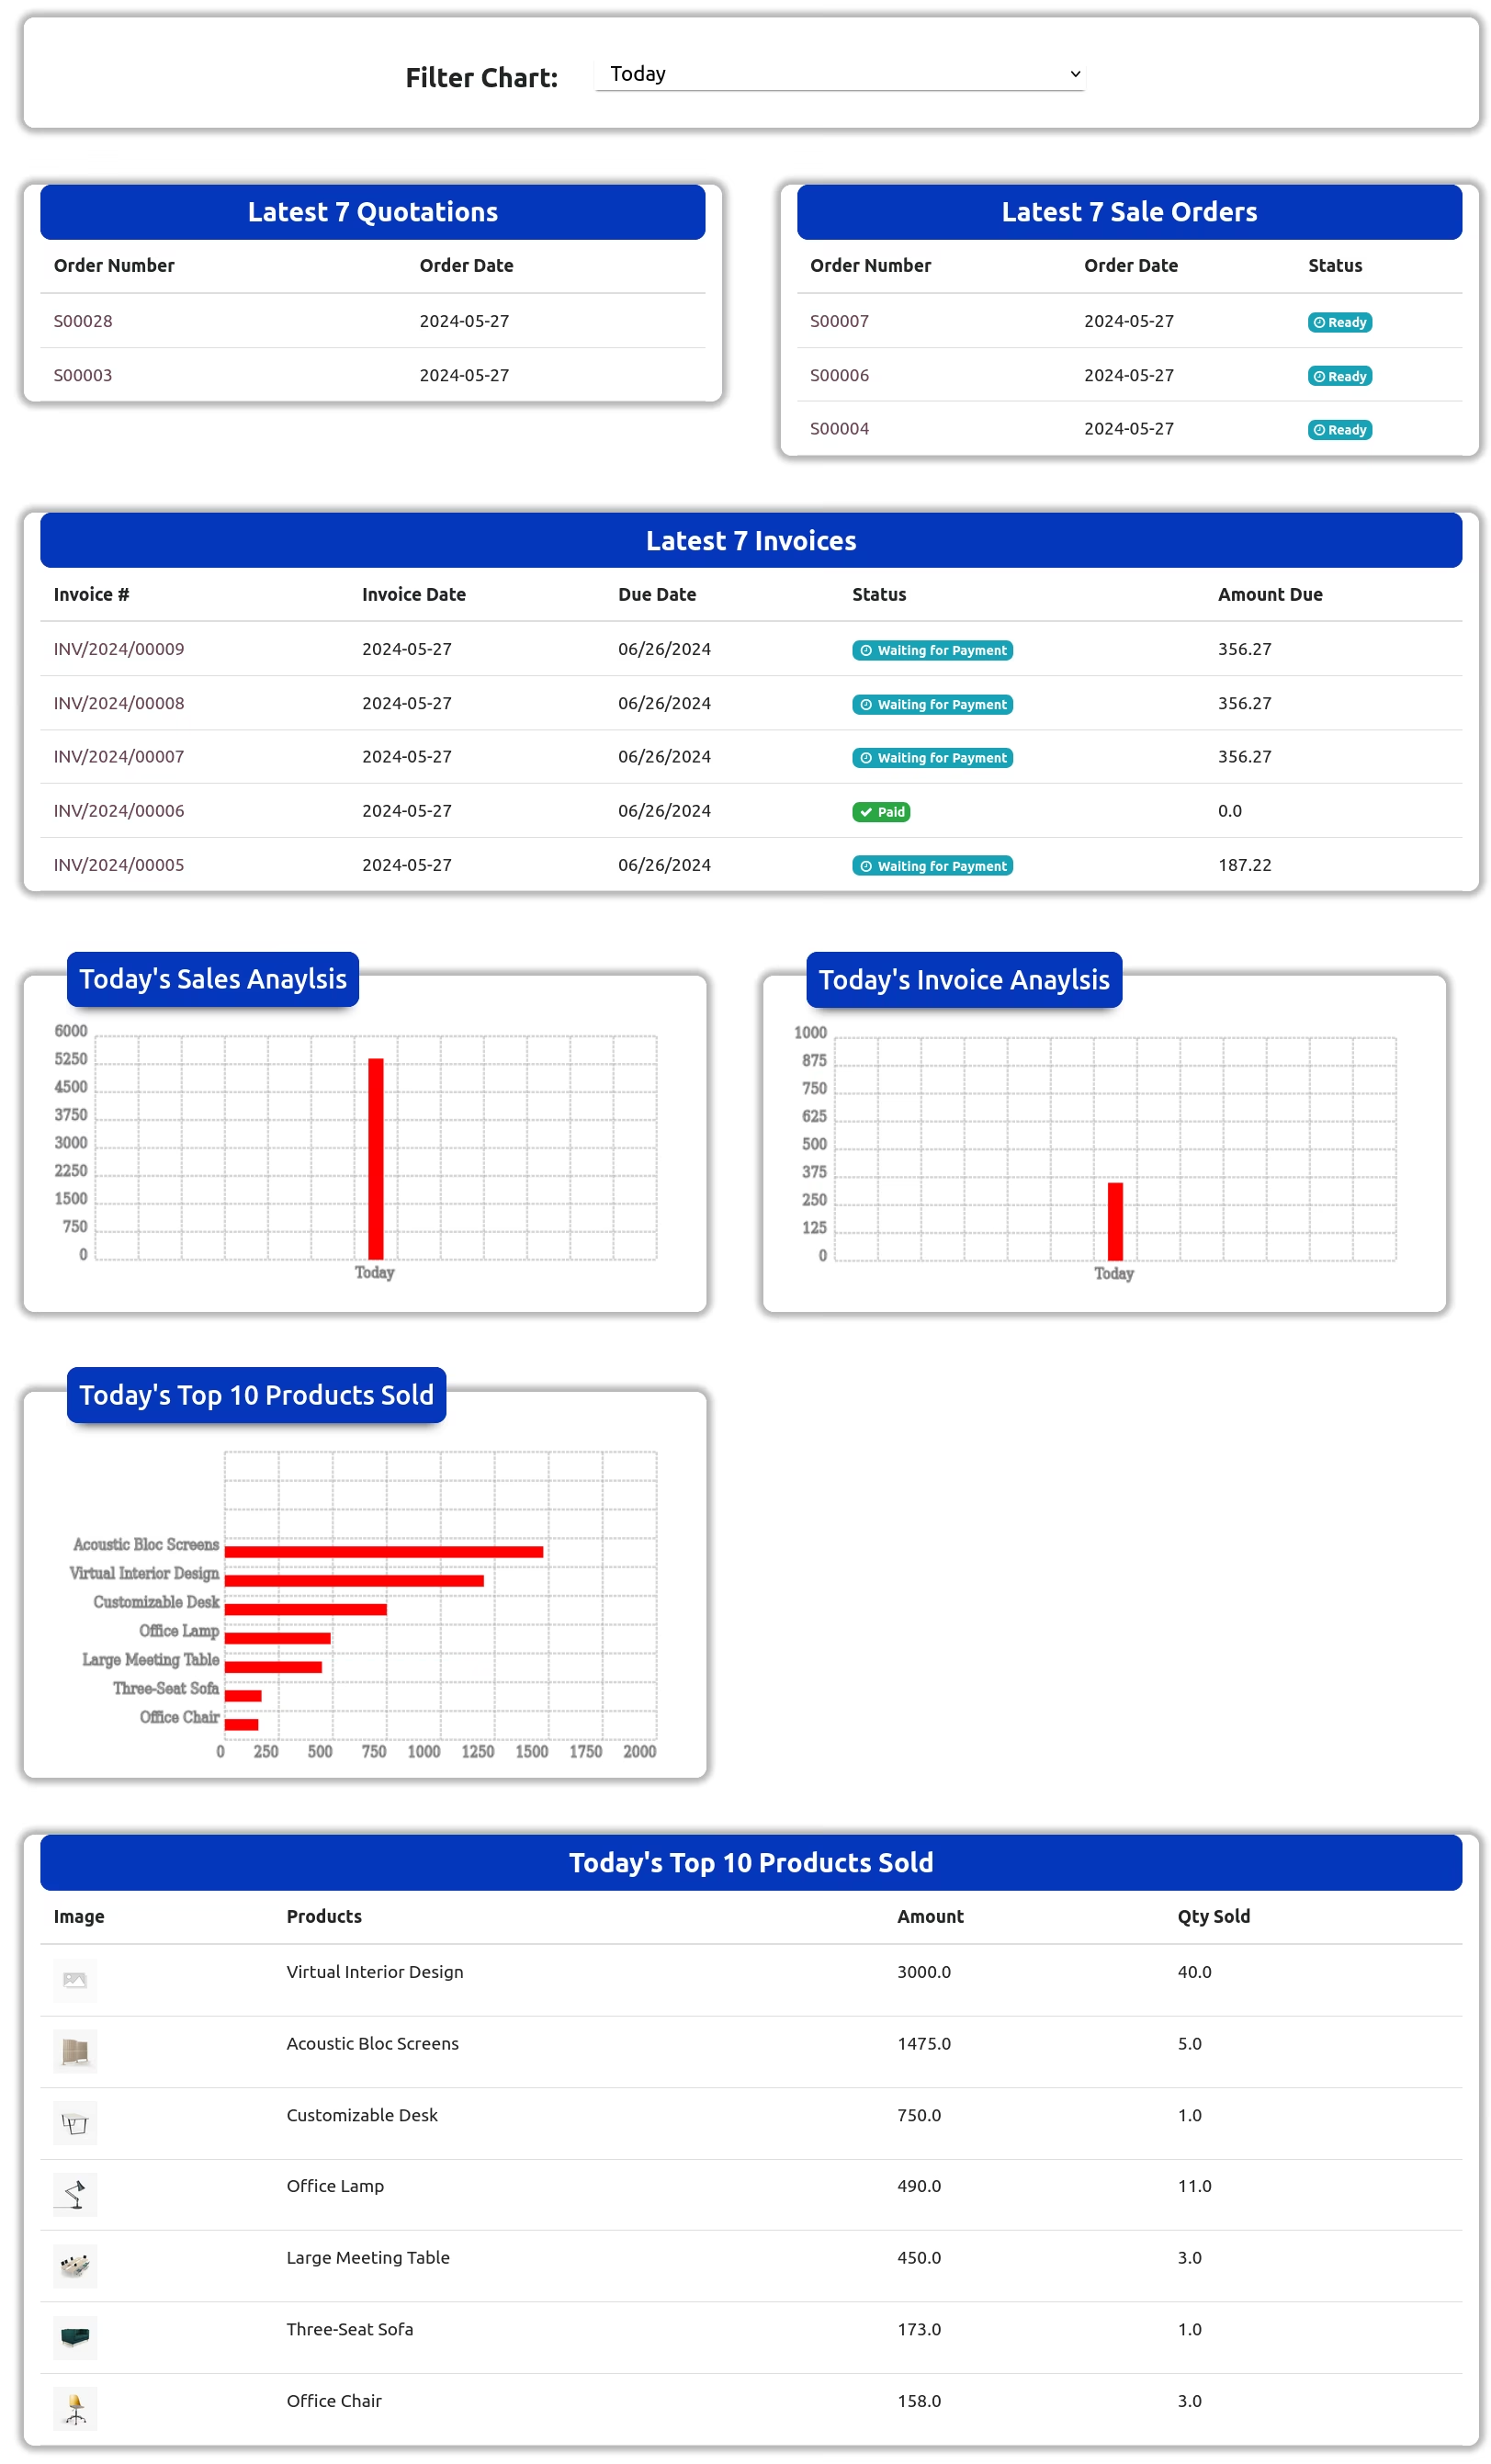
Dashboard Filter
User can filter dashboard chart and tables records with filter like : Today, Yesterday, Current Week, Current Month, Current Year.
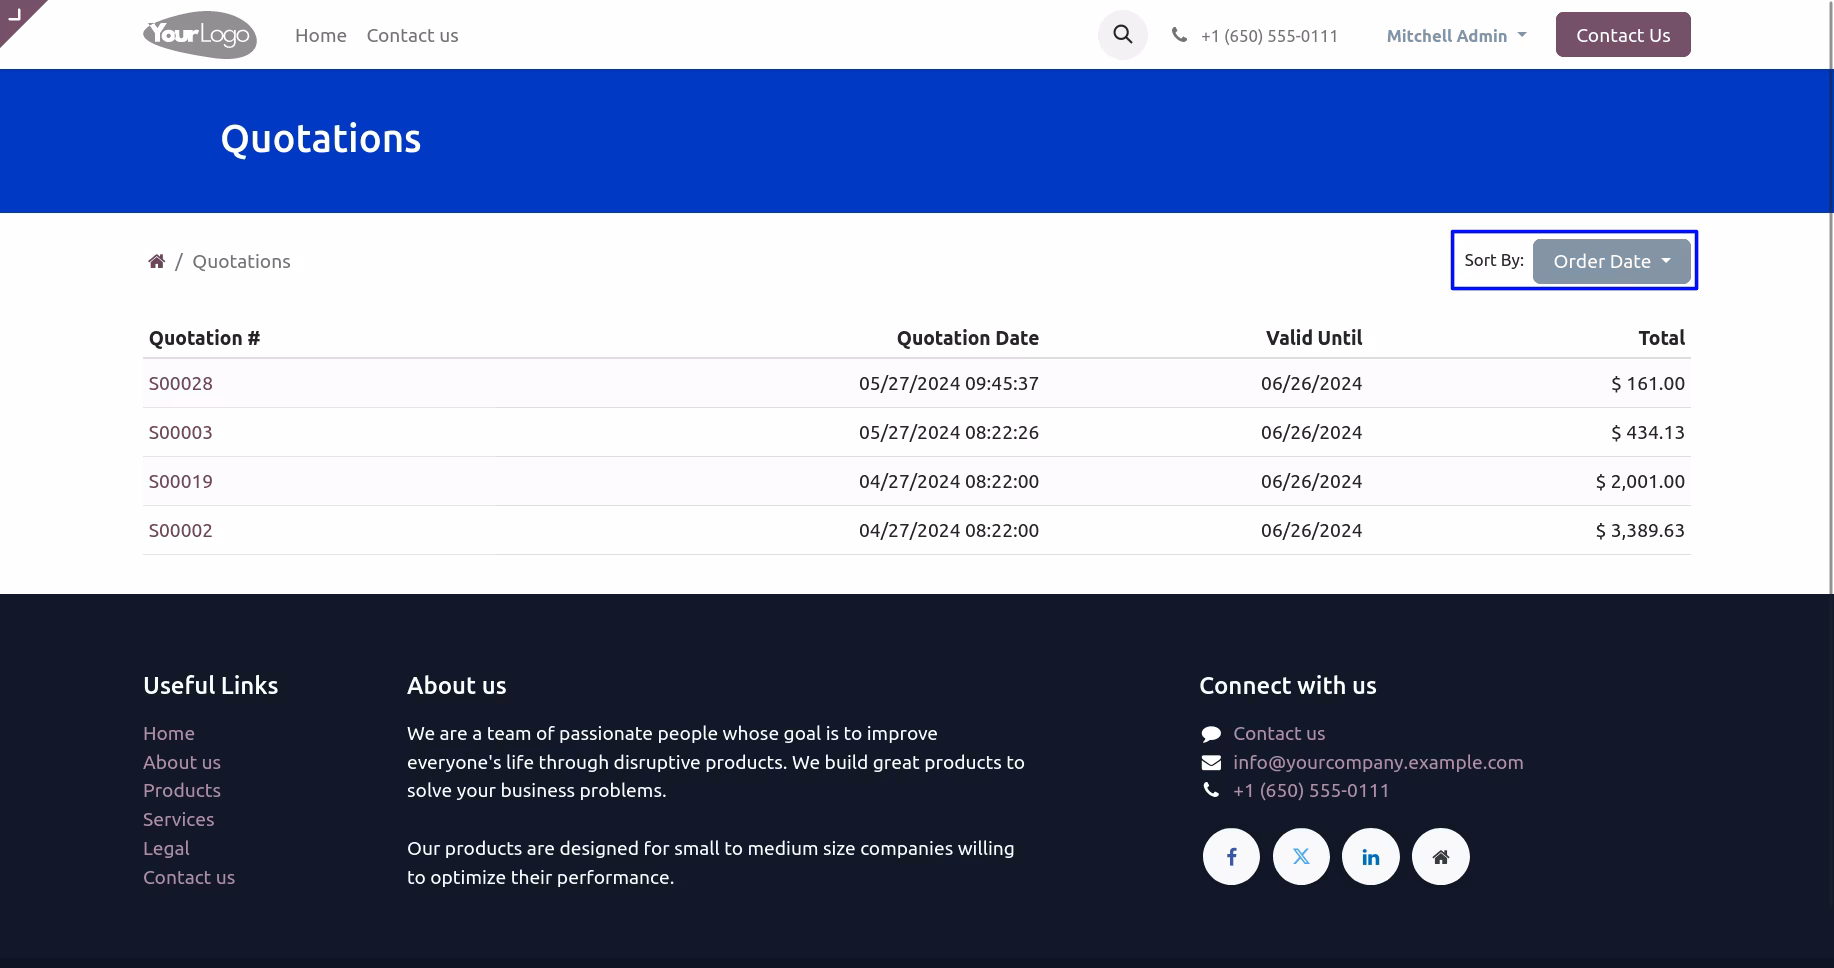
Latest Quotations & Sales Orders with Status
User can see all latest quotations and sales order filter by current week with order status.
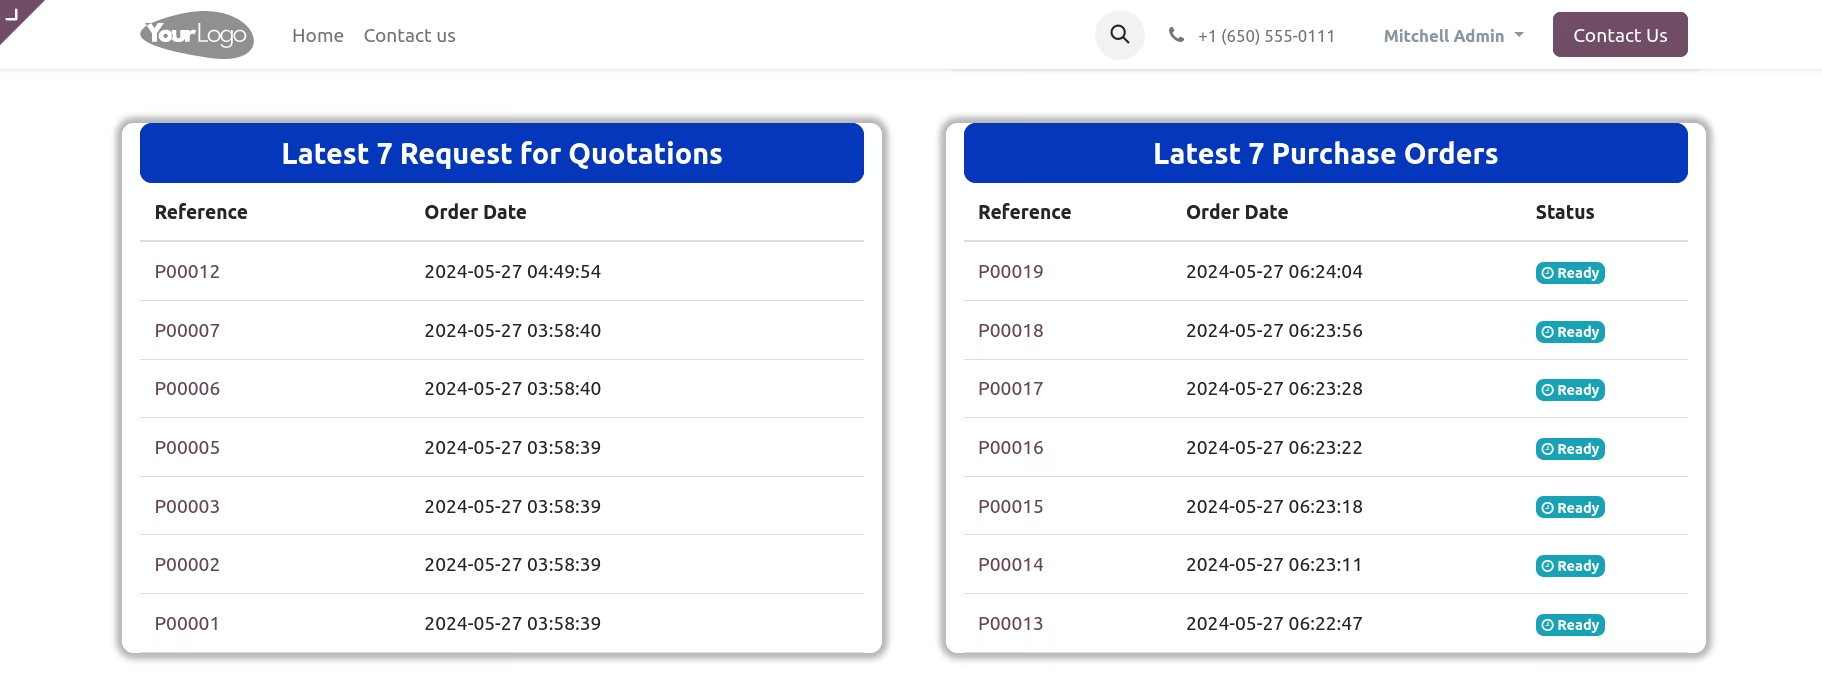
Latest RFQs & Purchase Orders with Status
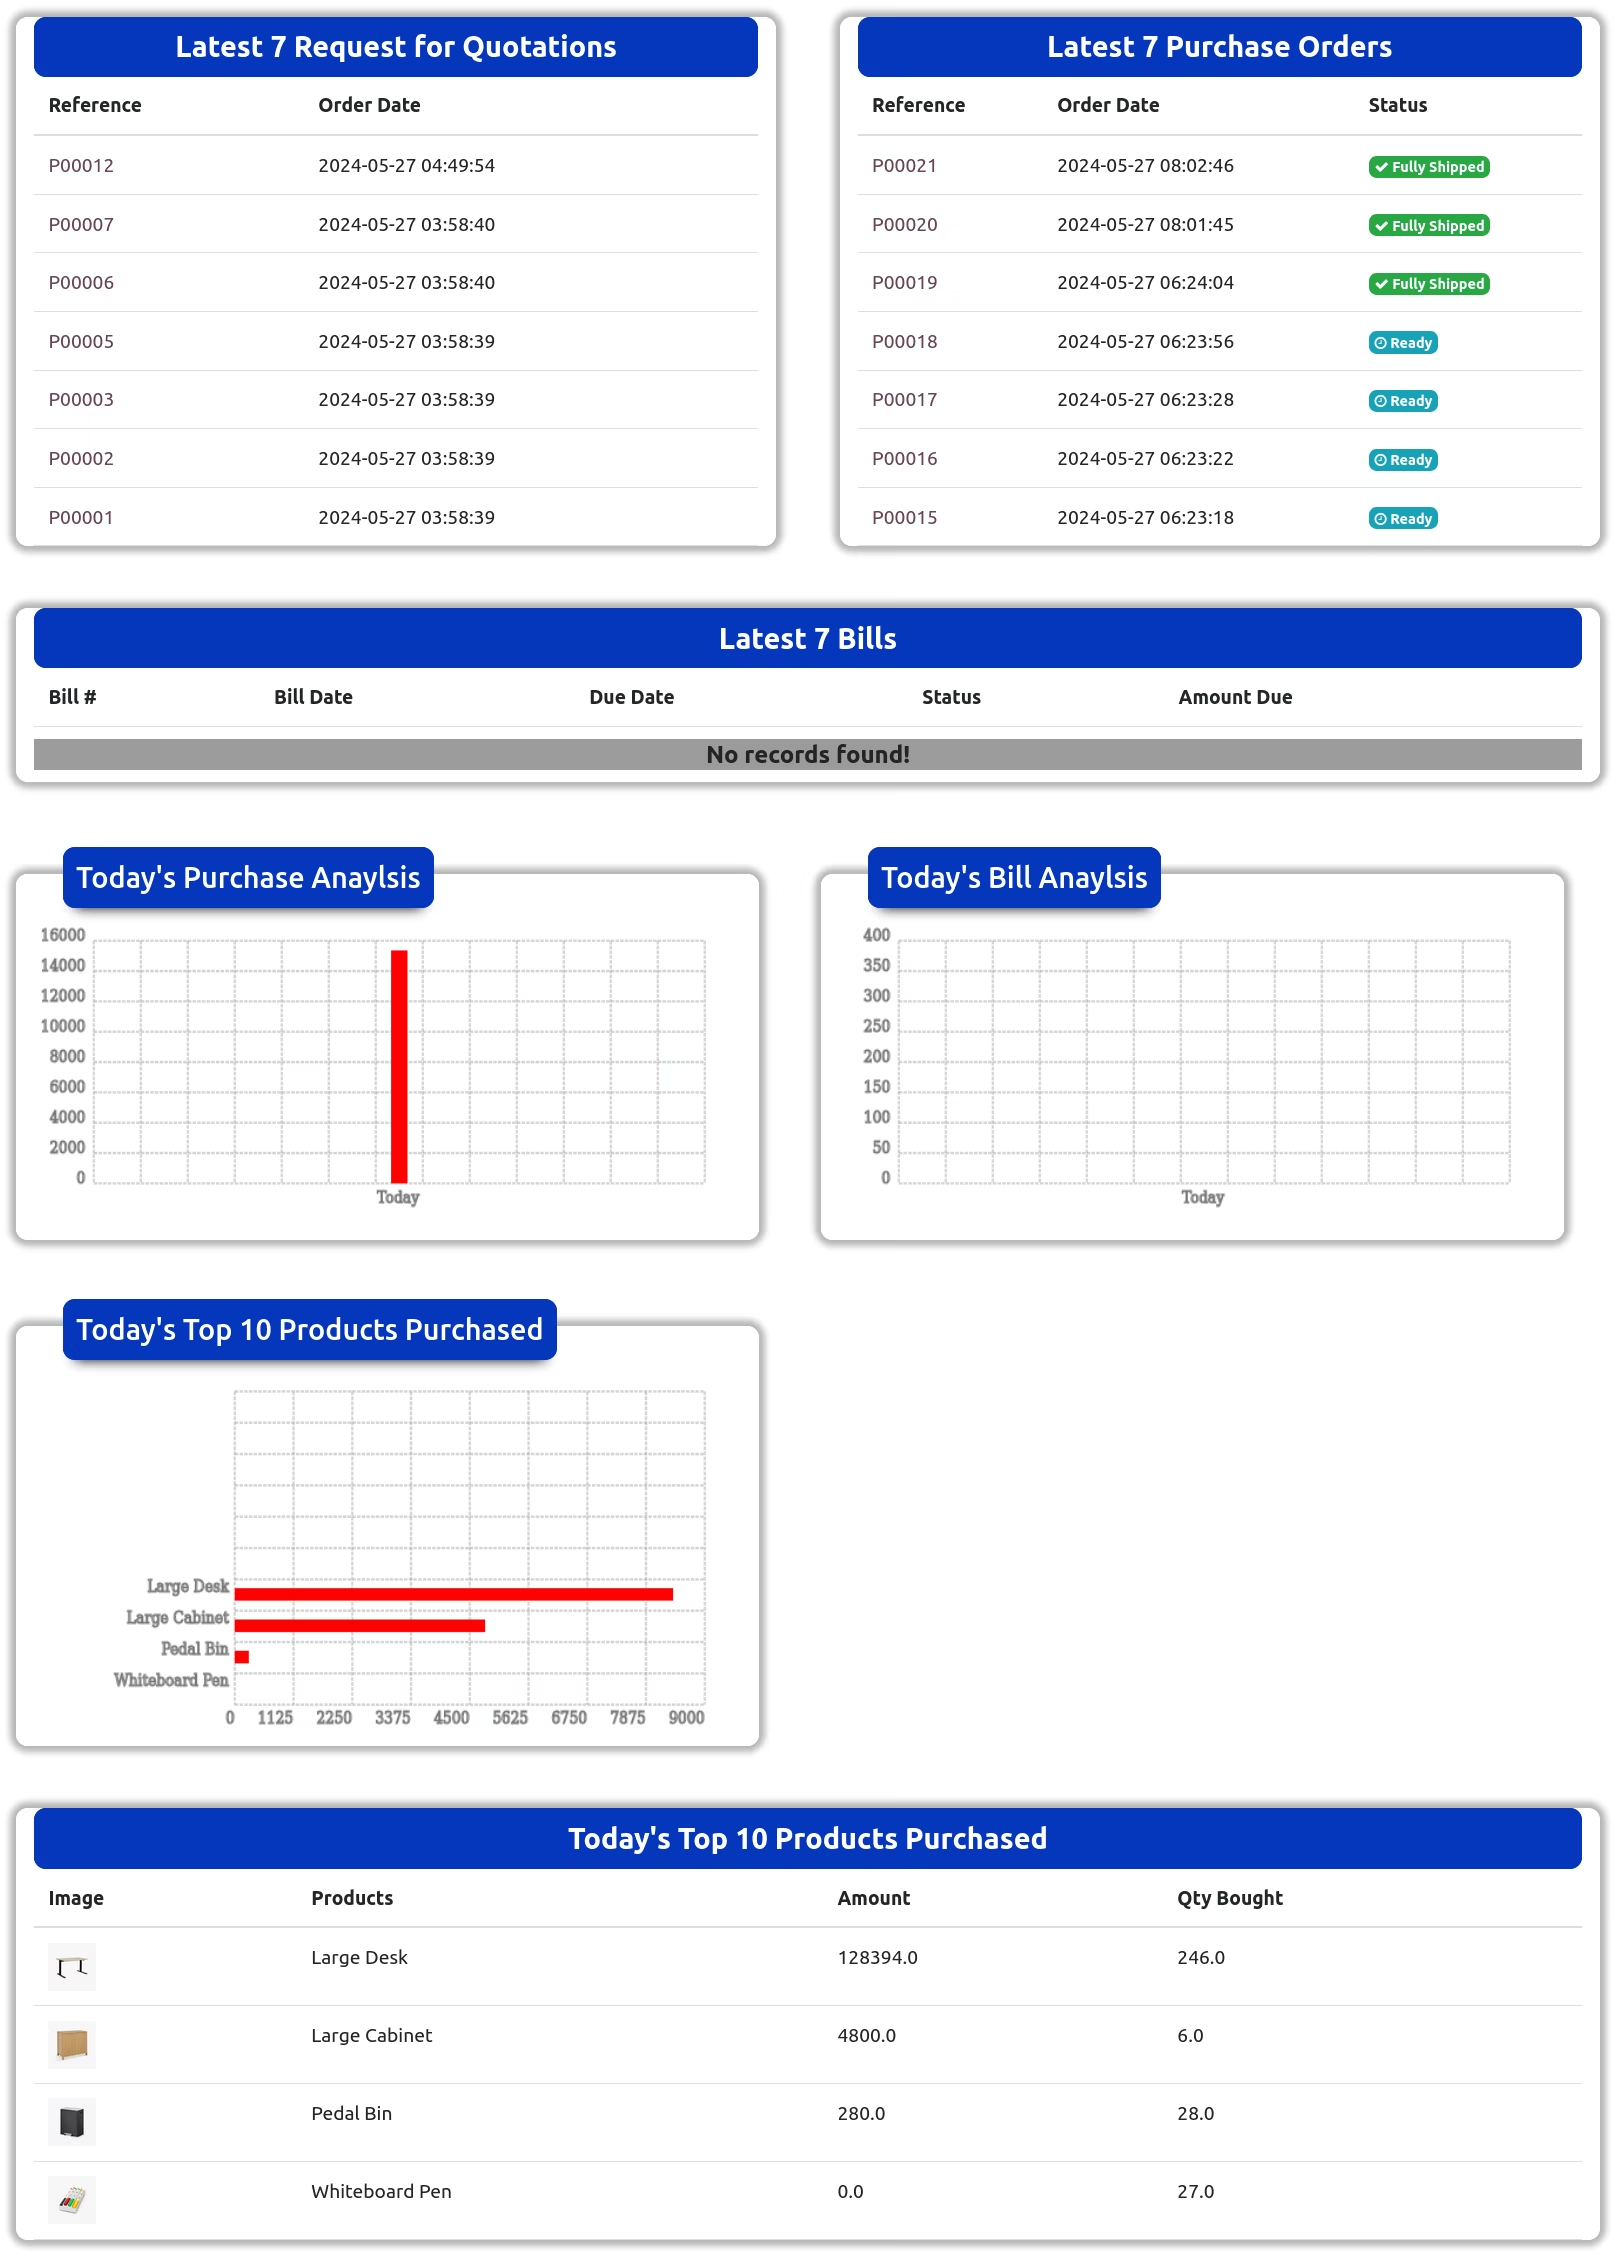
User can see latest request for quotations and purchase orders with order status.
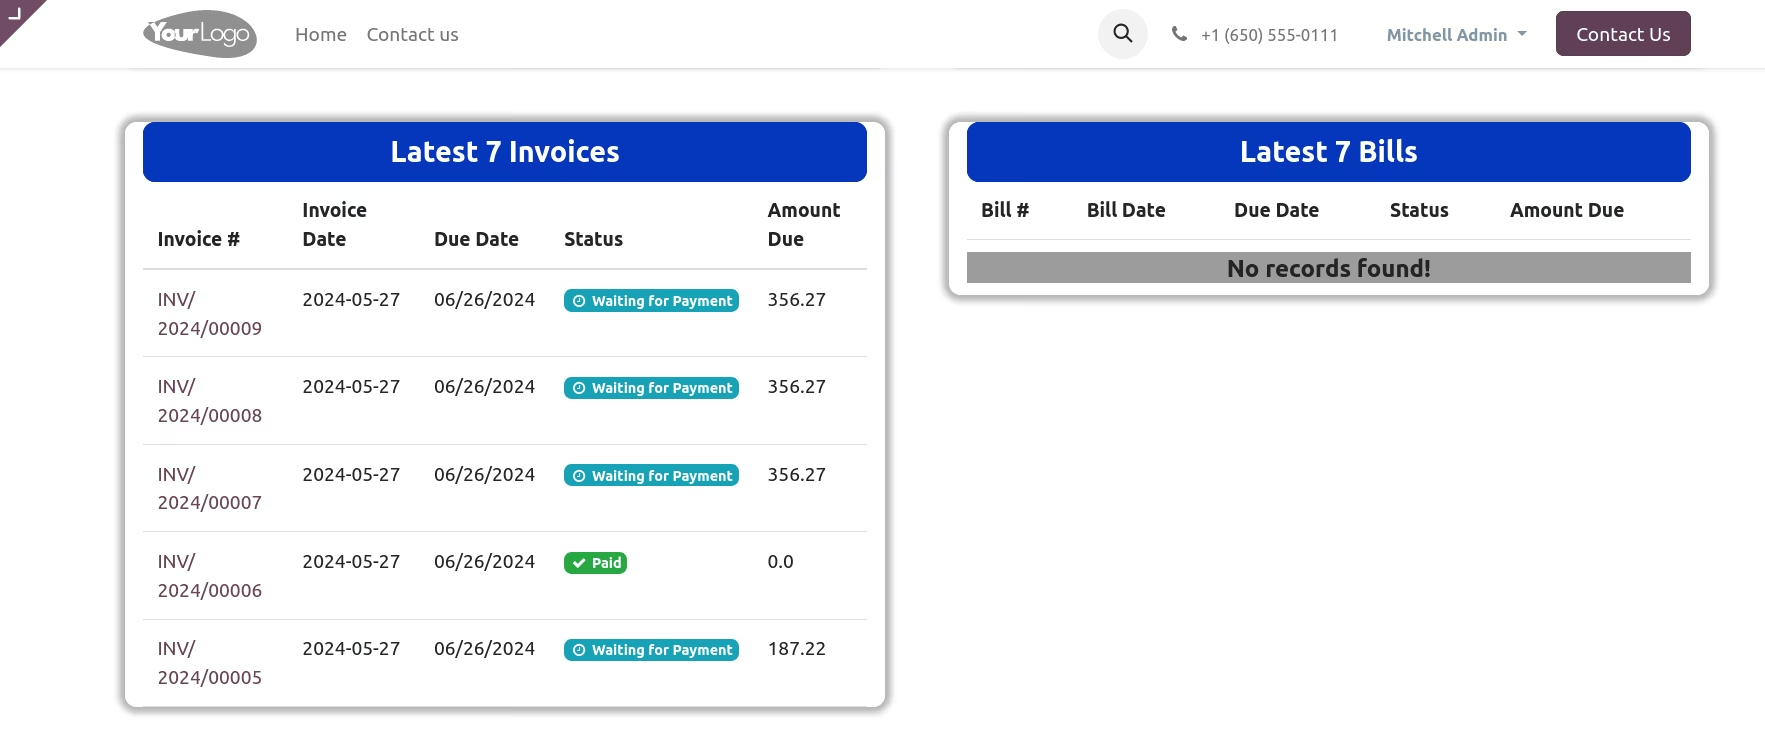
Latest Invoices & Bills with Status
User can see latest customer invoices and vendor bills with status.
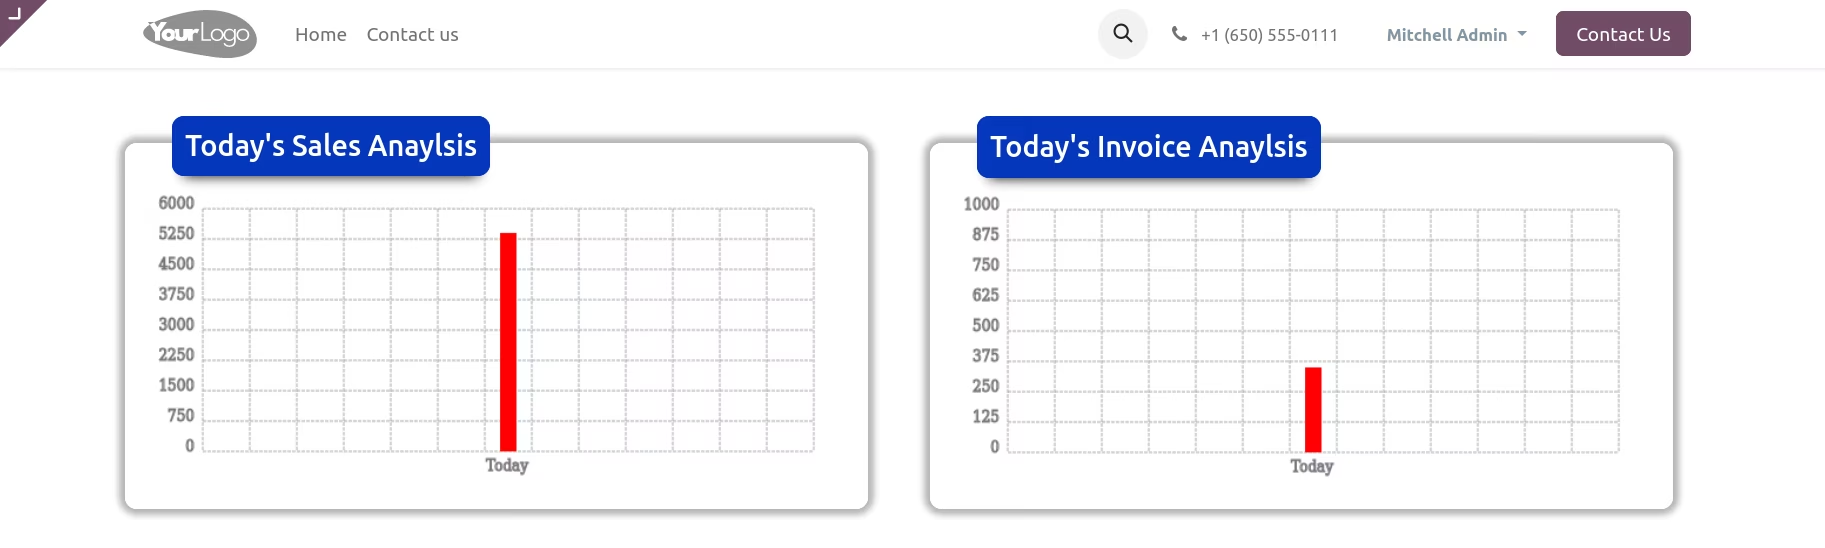
Sales & Invoice Analysis Filter By : Week
user can see sales and invoice analysis report filter by week.
Sales & Invoice Analysis Filter By : Week
user can see sales and invoice analysis report filter by week.
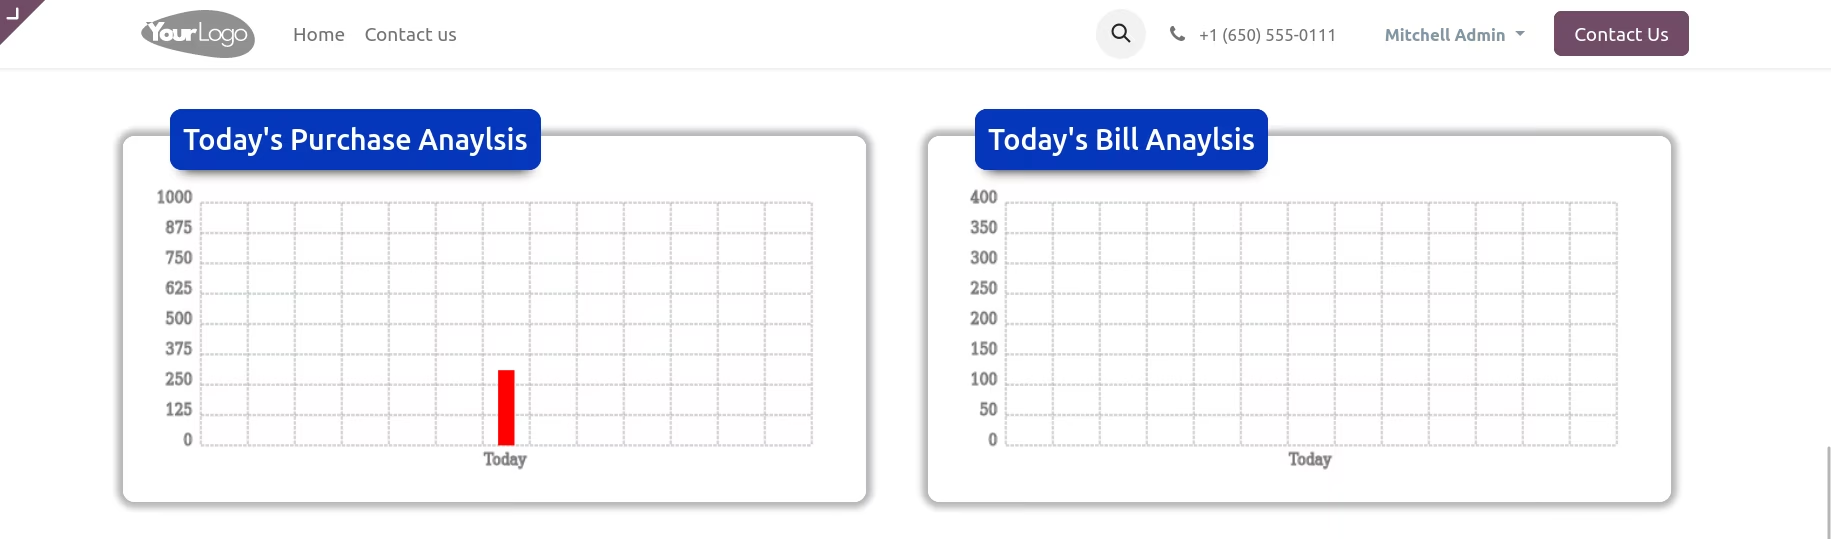
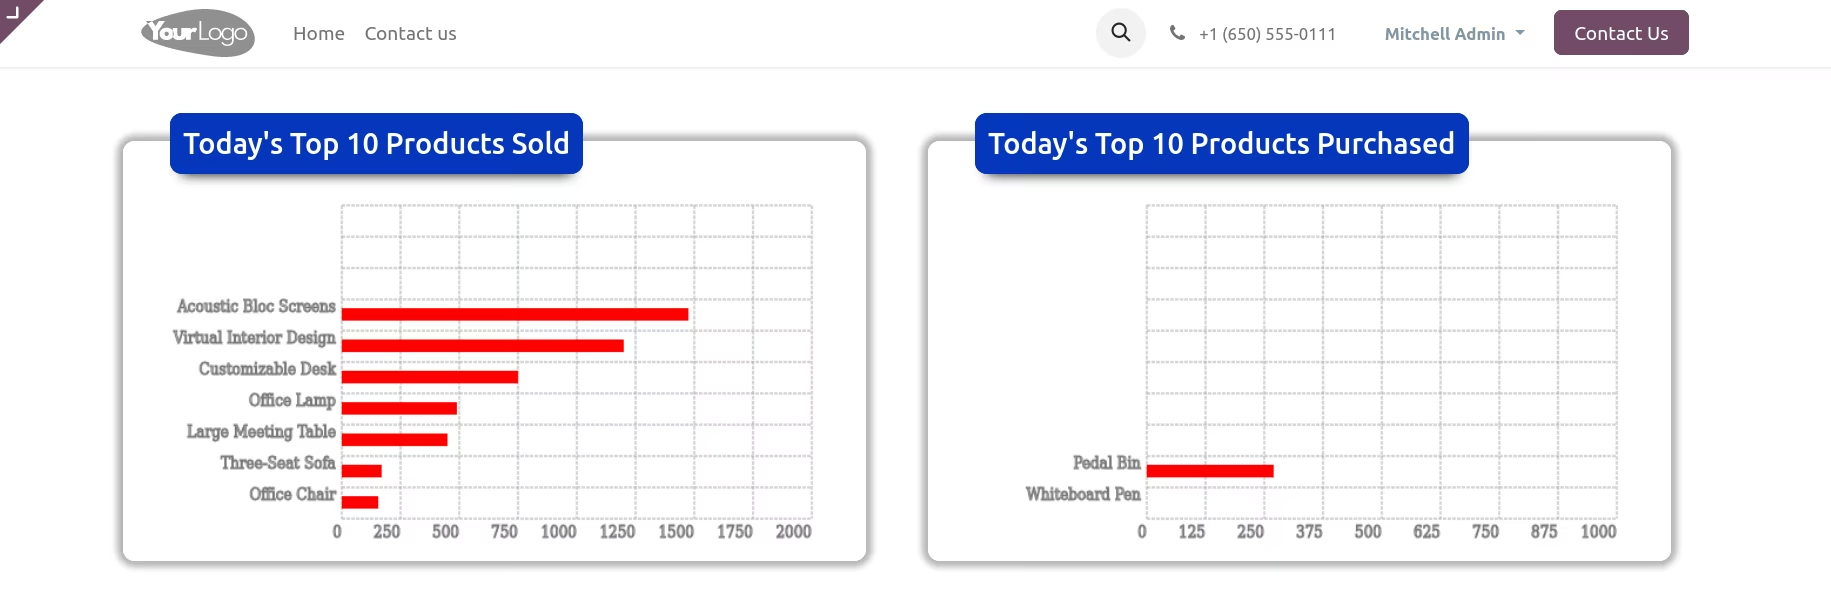
Top 10 Sold & Purchased Product Analysis
User can see top ten sold product and top 10 purchase product analysis chart.
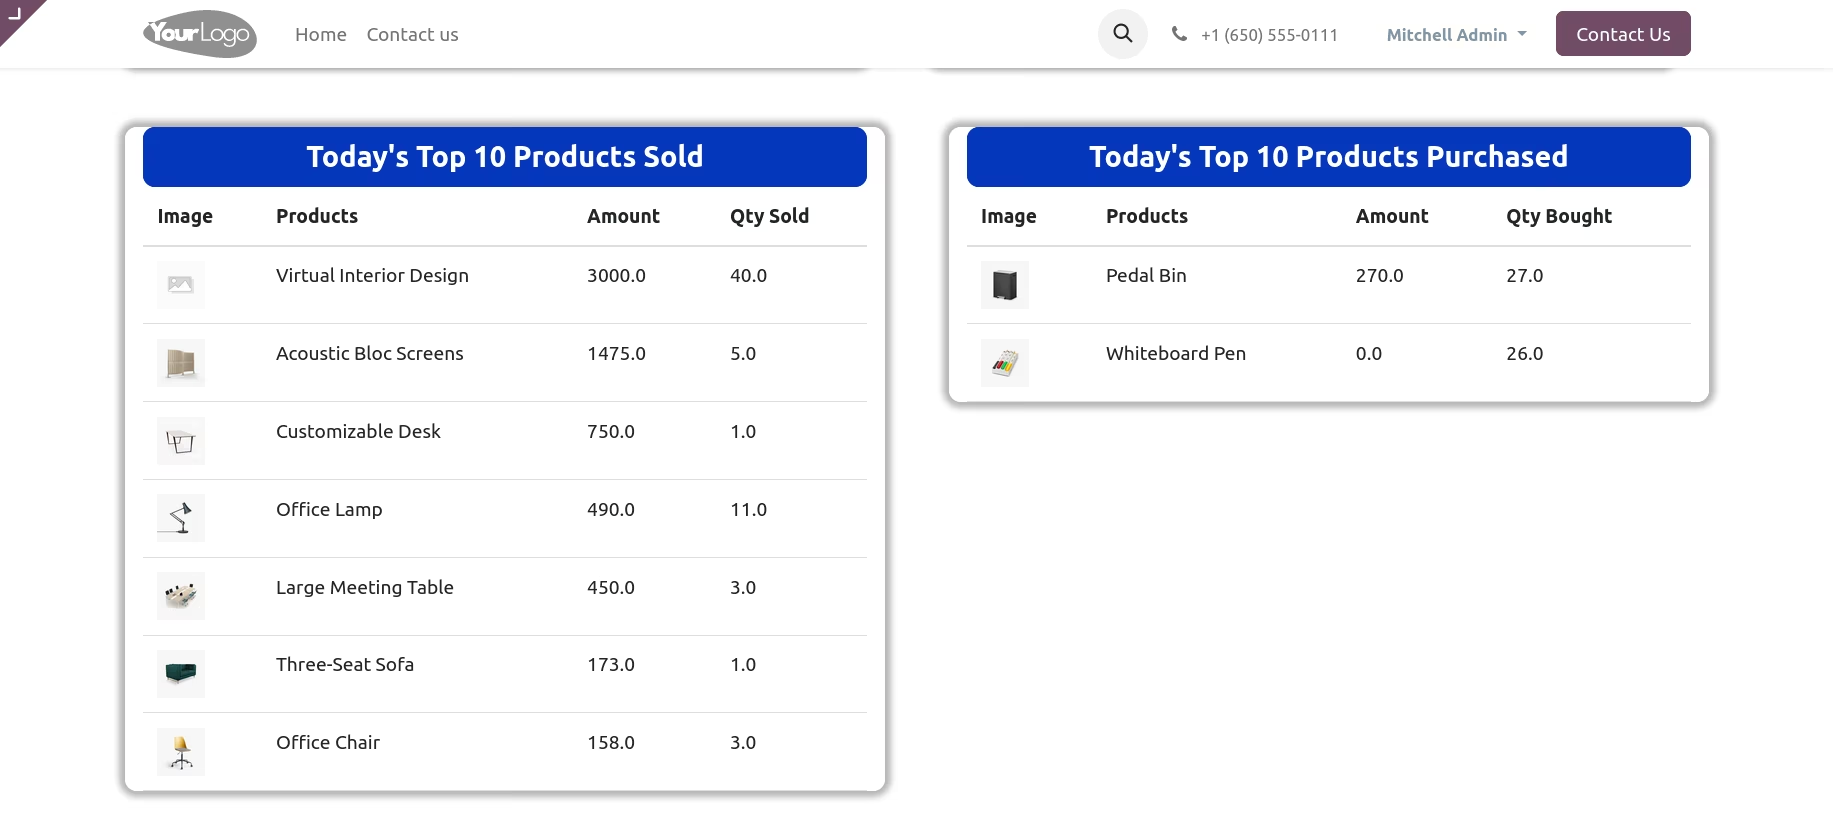
Top 10 Sold & Purchased Product
User can see top 10 sold and purchase product list.
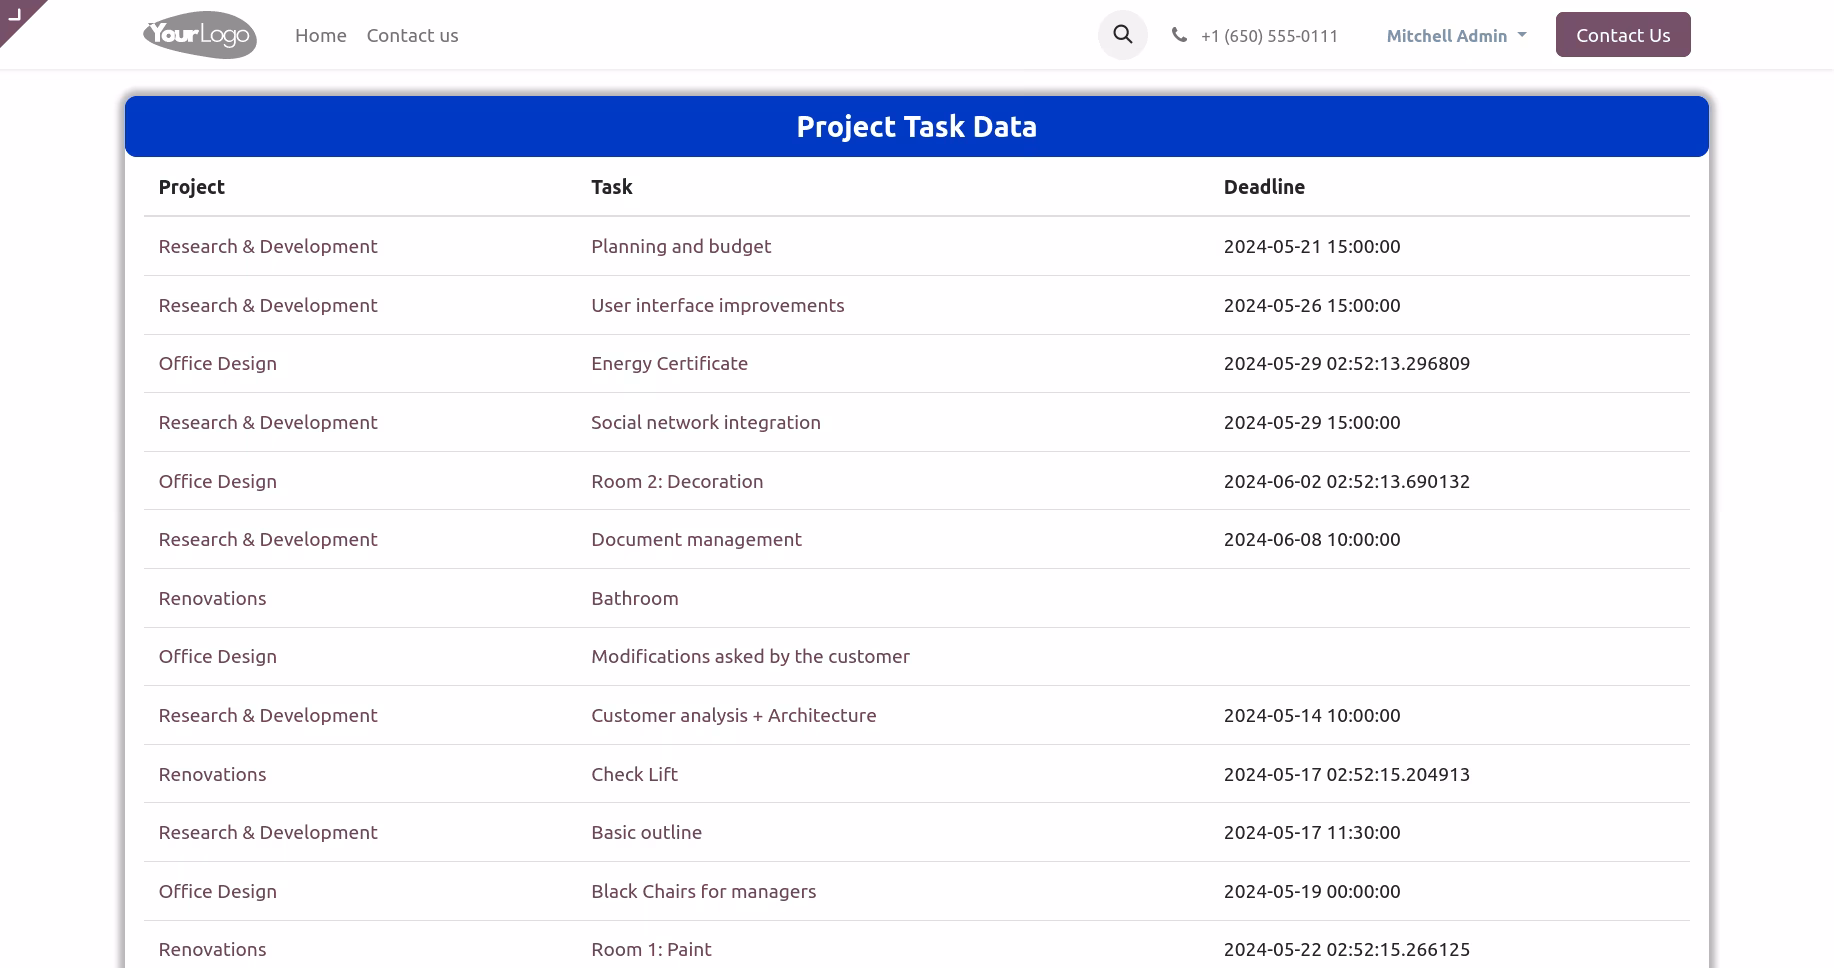
Projects and Tasks
User can see project and task on dashboard.
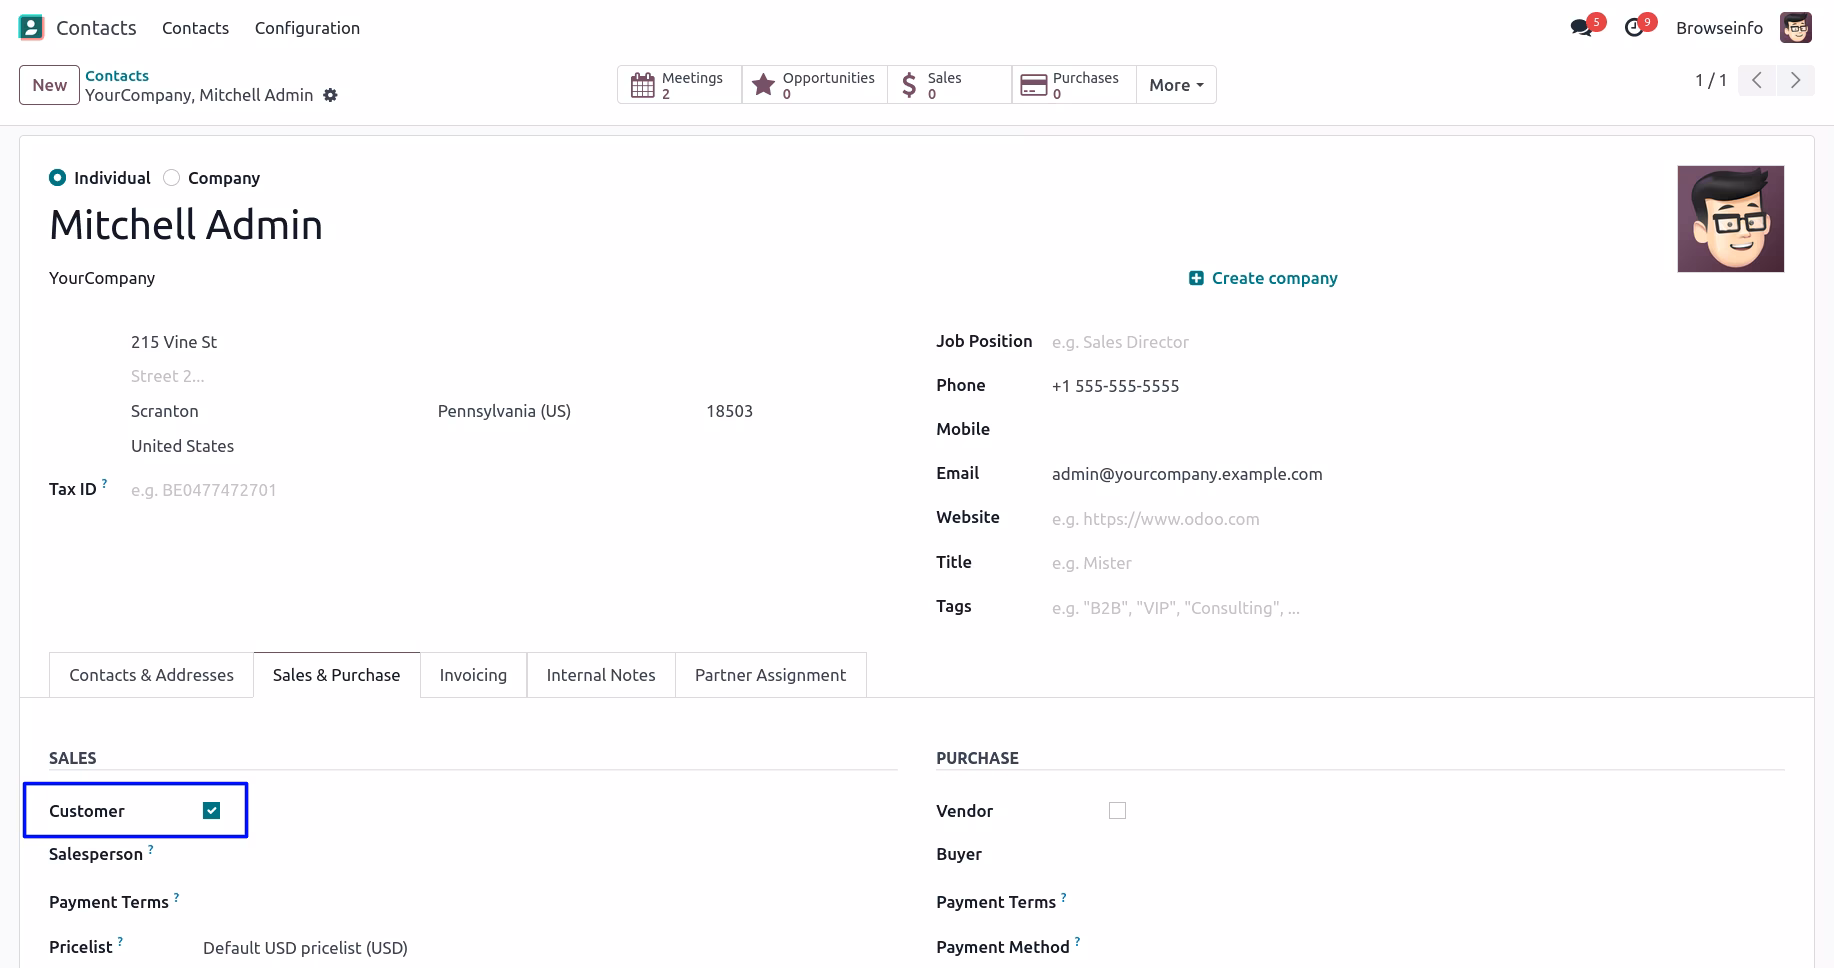
Customer Dashboard
User can see that "Customer" check box enables, so user can see that only sales data on dashboard.
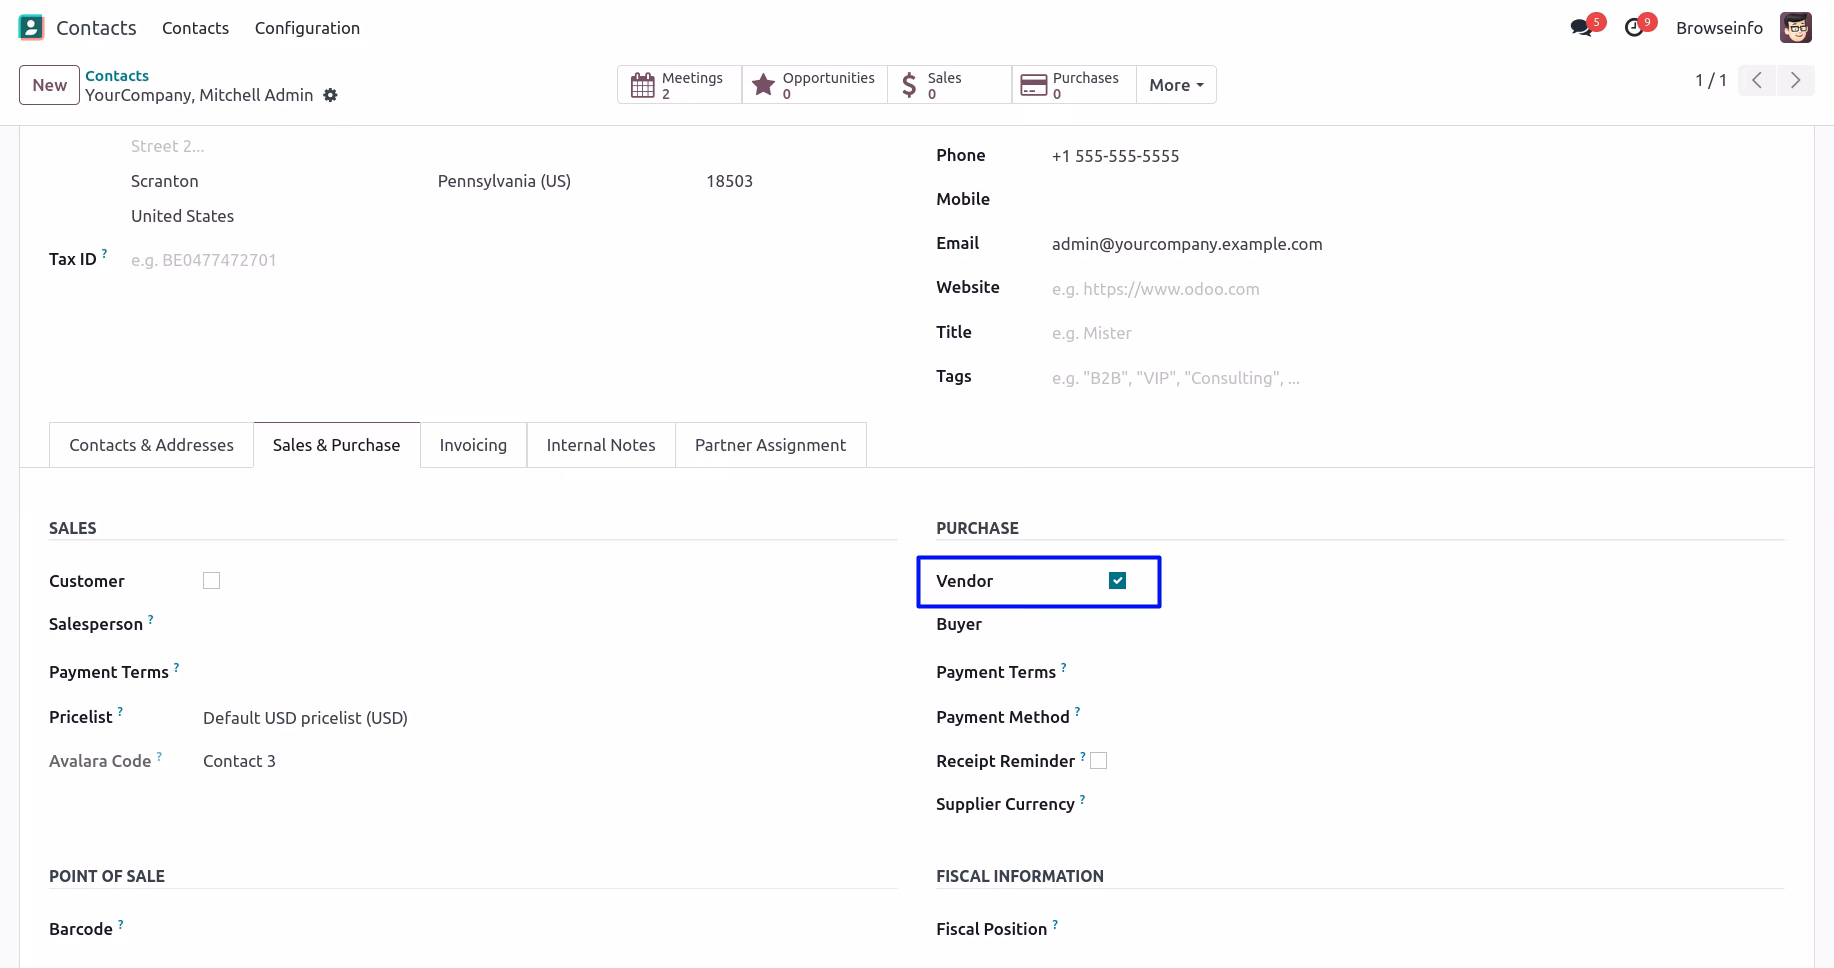
Vendor Dashboard
User can see that here "Vendor" check box enables so vendor can only see purchase data on dashboard.