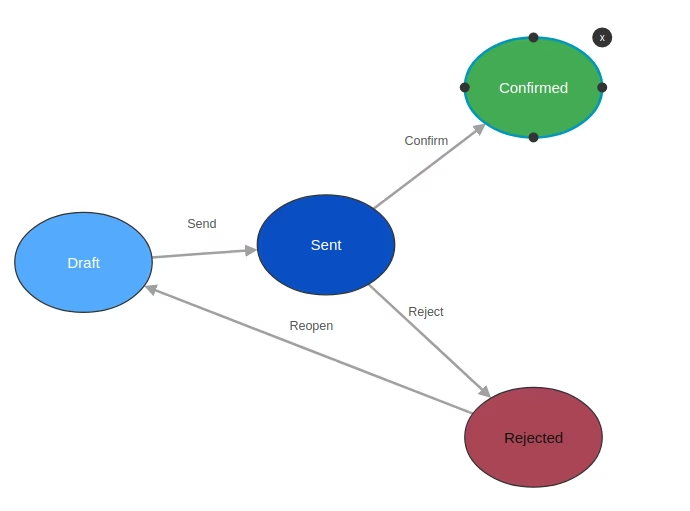
The module for enhances the standard diagram view by introducing customizable visual elements, allowing users to create detailed and color-coded workflow diagrams. This module is particularly beneficial for businesses seeking to visualize complex processes, such as service request flows, project stages, or approval hierarchies. By enabling the specification of background and foreground colors for nodes, CRnD Web Diagram Plus facilitates a clearer and more intuitive understanding of workflows, promoting efficiency and informed decision-making.
Customizable Node Colors: Define background and foreground colors for diagram nodes to represent different statuses or categories.
Enhanced Diagram Views: Improves upon the standard diagram view with additional customization options.
Integration with Models: Seamlessly integrates with existing models to visualize data relationships.
Arrow Customization: Customize arrows between nodes to indicate relationships and flow directions.
XML Configuration: Utilize XML to define diagram structures, including nodes and arrows.
Improved Workflow Visualization: Provides a clearer representation of workflows, aiding in process analysis and optimization.
User-Friendly Interface: Offers an intuitive interface for creating and managing diagrams without extensive technical knowledge.
Support for Multiple Nodes: Allows the inclusion of multiple nodes in a single diagram for comprehensive process mapping.
Dynamic Data Representation: Enables real-time data representation within diagrams for up-to-date insights.
Open Source Availability: Available as an open-source module, promoting transparency and community contributions.
Enhanced Process Understanding: Visual diagrams provide a clearer understanding of complex workflows.
Improved Decision-Making: Color-coded nodes and arrows aid in quick identification of process stages and statuses.
Increased Efficiency: Streamlined visualization of workflows leads to faster analysis and decision-making.
Customization Flexibility: Tailor diagrams to fit specific business processes and requirements.
Better Communication: Visual representations facilitate clearer communication among team members.
Enhanced Reporting: Incorporate diagrams into reports for comprehensive process documentation.
Simplified Training: Use diagrams as training tools to onboard new employees more effectively.
Scalability: Adapt diagrams to represent processes of varying complexity as the business grows.
Integration with Bureaucrat ITSM: Utilize diagrams within the Bureaucrat ITSM system for service request visualization.
Community Support: Benefit from community contributions and support through the open-source nature of the module.
web_diagram addon.
Changes:
- Applied the following Pull Request that fixes an error on the diagram view. It appears when the diagram object has 2 fields (one2many + many2one) that points to related nodes.
- Added possibility to specify background and foreground colors of nodes (via fields).
- Possible to store node position in database, thus there is no more need to rearrange flow manually each time you open diagram.
An example of internal usage:
<record id="some_id" model="ir.ui.view"> <field name="model">model.name</field> <field name="type">diagram_plus</field> <field name="arch" type="xml"> <diagram_plus> <node object="name.of.model" bgcolor="from_old_diagram_non_priority" bg_color_field="name_of_field_bg_color" fg_color_field="name_of_field_fg_color" d_position_field="name_of_field_to_store_position"> </node> <arrow object="name.of.model" source="source_field(from)" destination="destination_field(to)" label="['name_of_label_field']"> </arrow> </diagram_plus> </field> </record>