
The provides a powerful and customizable dashboard solution for CRM. It enables businesses to visualize sales performance, opportunities, revenue, and key metrics dynamically. With interactive dashboards and real-time insights, this module empowers managers and sales teams to make data-driven decisions, monitor progress, and improve overall efficiency.
Dynamic & Customizable Dashboards: Create dashboards with charts, tables, KPIs, lists, and other elements tailored to business needs.
Multi-Company Support: Manage and view data across multiple companies within a single interface.
TV Mode Display: Show dashboards on large screens for meetings or real-time performance monitoring.
List View: Display data in filterable and sortable lists for detailed analysis.
Custom SQL Queries: Create custom SQL queries to fetch precise data for in-depth analytics.
Global Filters: Apply filters across all dashboard elements for flexible data segmentation.
Sharing & Collaboration: Share dashboards with team members and collaborate on specific elements.
Import & Export Data: Import data from Excel/CSV and export dashboards or components as PDF, images, or JSON.
Interactive Visualizations: Engage with data through interactive charts and KPI widgets.
User-Friendly Interface: Intuitive navigation for easy dashboard creation and management.
Sales Performance Monitoring: Track metrics like total leads, opportunities, revenue, and conversion rates.
Data-Driven Decision Making: Access comprehensive insights to make informed business decisions.
Time Savings: Reduce time spent on manual report creation through automated dashboards.
Improved Team Collaboration: Collaborate directly on dashboards for better team communication.
Enhanced Analytics: Leverage advanced tools and custom queries for deeper data analysis.
Scalable & Flexible: Adapt dashboards to changing business requirements and multiple companies.
Real-Time Insights: Monitor KPIs and metrics in real-time to respond quickly to trends.
Customizable Interface: Tailor dashboards to reflect specific business processes and KPIs.
Centralized Data: View all critical CRM metrics in one consolidated interface.
Increased Efficiency: Enable managers and teams to act promptly based on accurate data.
-
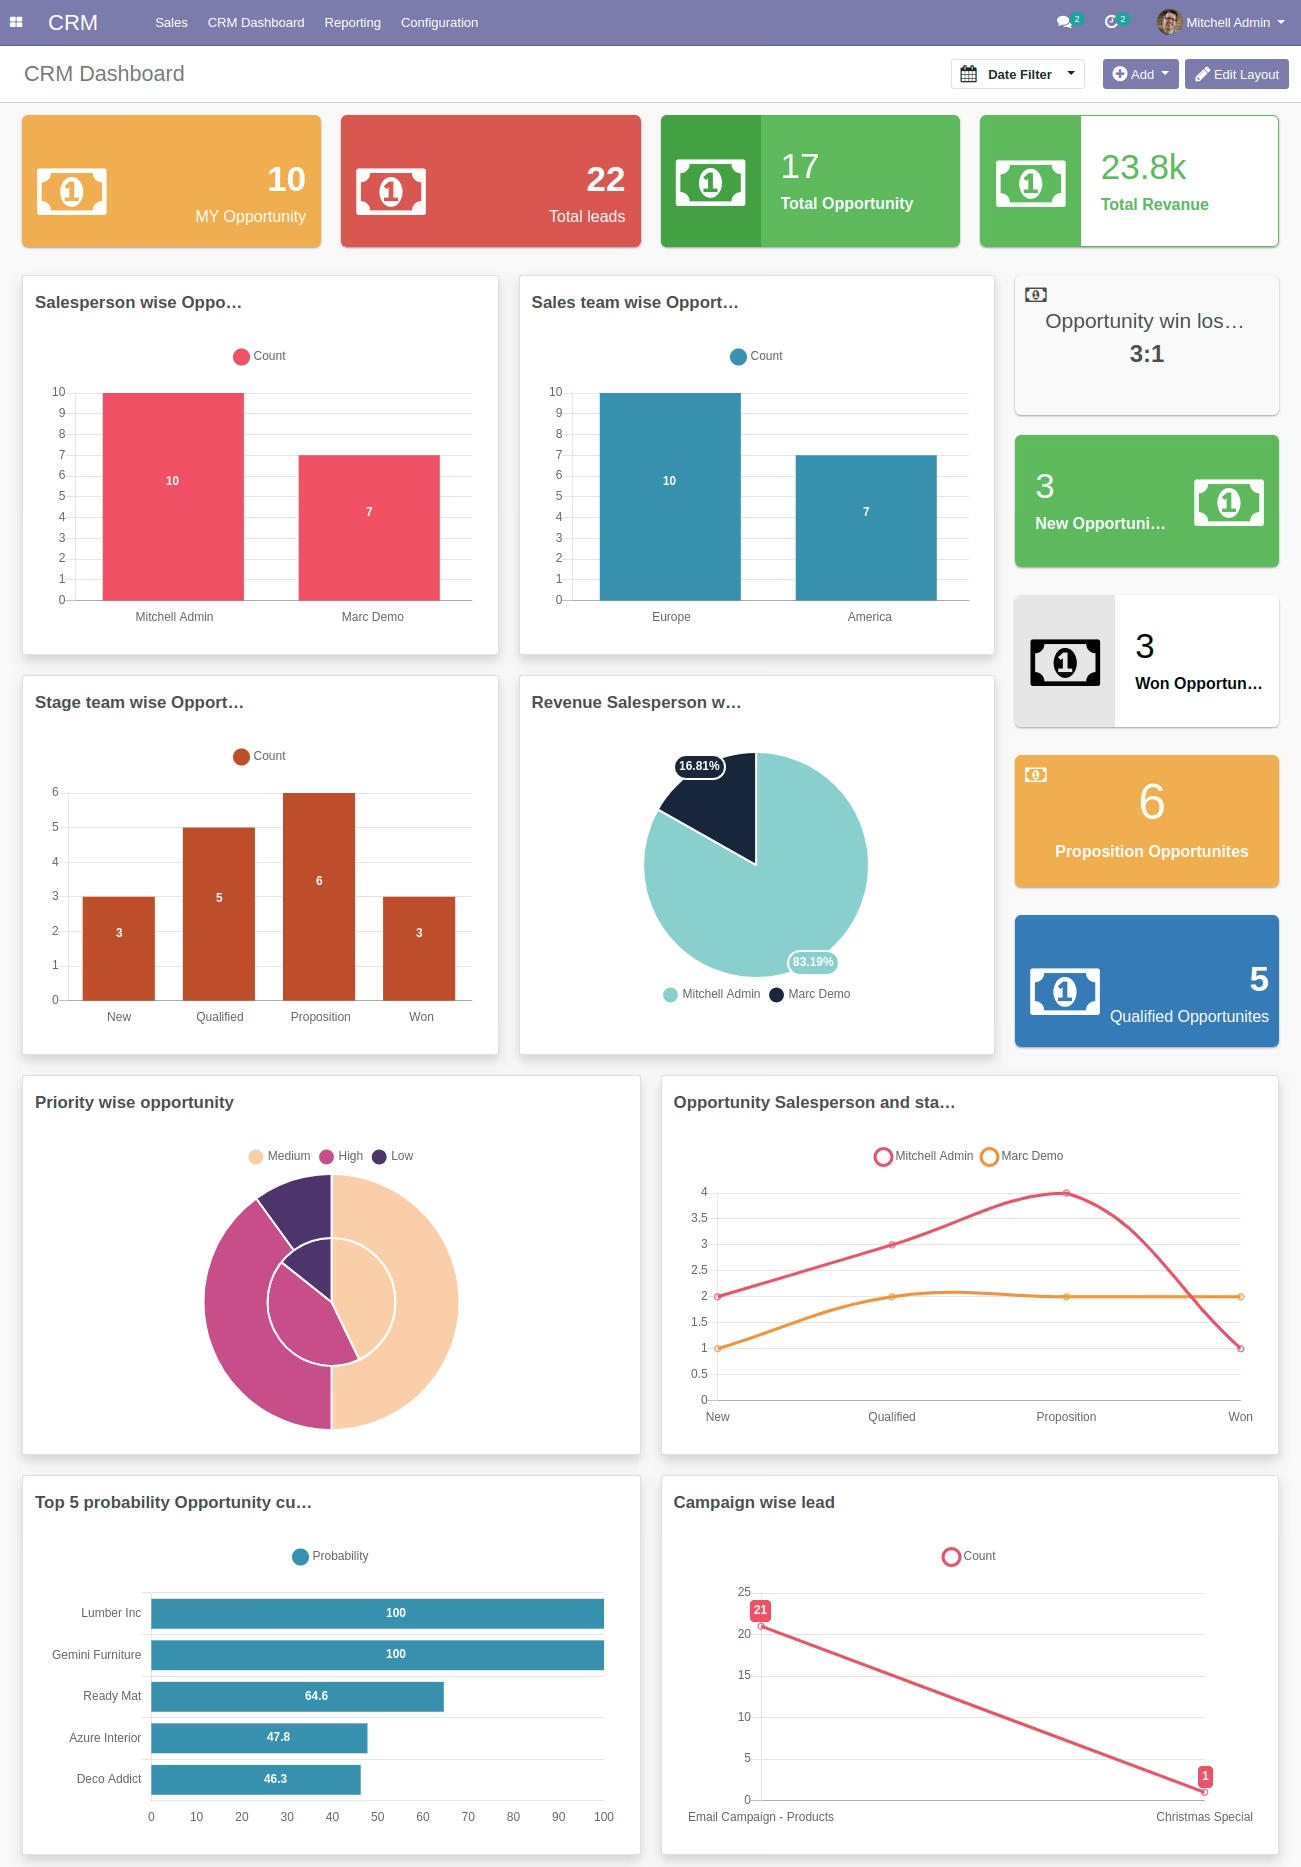
My Opportunity (Tile): Display count of user opportunities.e

-
Total Leads (Tile): Display Count of total leads.
-
Total Opportunity (Tile): Display Count of total opportunities.
-
Total Revanue (Tile): Display sum of total revenue.
-
New opportunities (Tile): Display count of new opportunities.
-
Won opportunities (Tile): Display count of won opportunities.
-
Proposition opportunities (Tile): Display count of proposition opportunities.
-
Qualified opportunities (Tile): Display count of Qualified opportunities.
-
Salesperson wise Opportunity (Bar Chart)
-
Sales team wise Opportunity (Bar chart)
-
Stage team wise Opportunity (Bar chart)
-
Priority wise opportunity (Pie Chart)
-
Revenue Salesperson wise (Pie Chart)
-
Opportunity Salesperson and stage wise (Line Chart)
-
Campaign wise lead(Line Chart)
-
Top 5 probability Opportunity customer wise (Horizontal Bar Chart)
-
Opportunity win lose ratio(KPI)