Unlock the full potential of your business data with the Analytix Dashboard, a cutting-edge business intelligence (BI) and data visualization module. Designed to make data analysis accessible to everyone in your organization, this intuitive tool allows you to create stunning, interactive dashboards with ease. Move beyond static reports and embrace a dynamic way of exploring your data. From sales and finance to inventory and operations, Analytix Dashboard transforms your raw data into clear, actionable insights, empowering you to navigate your business landscape with confidence.
Dynamic Dashboard Builder: Create custom dashboards with a user-friendly drag-and-drop interface.
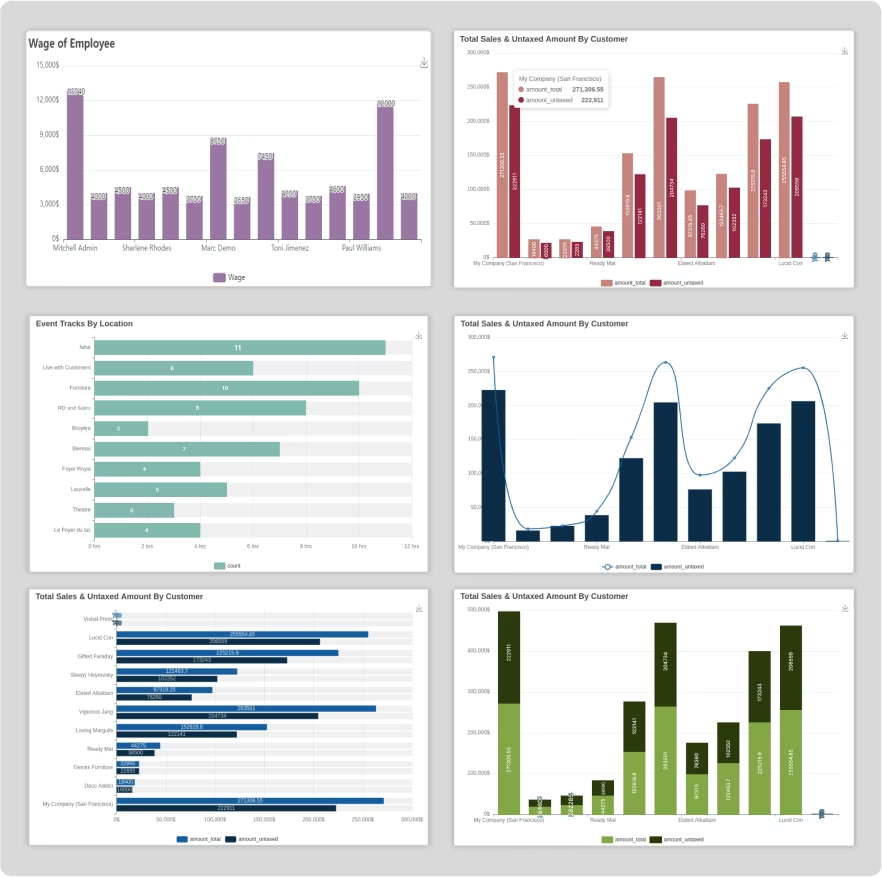
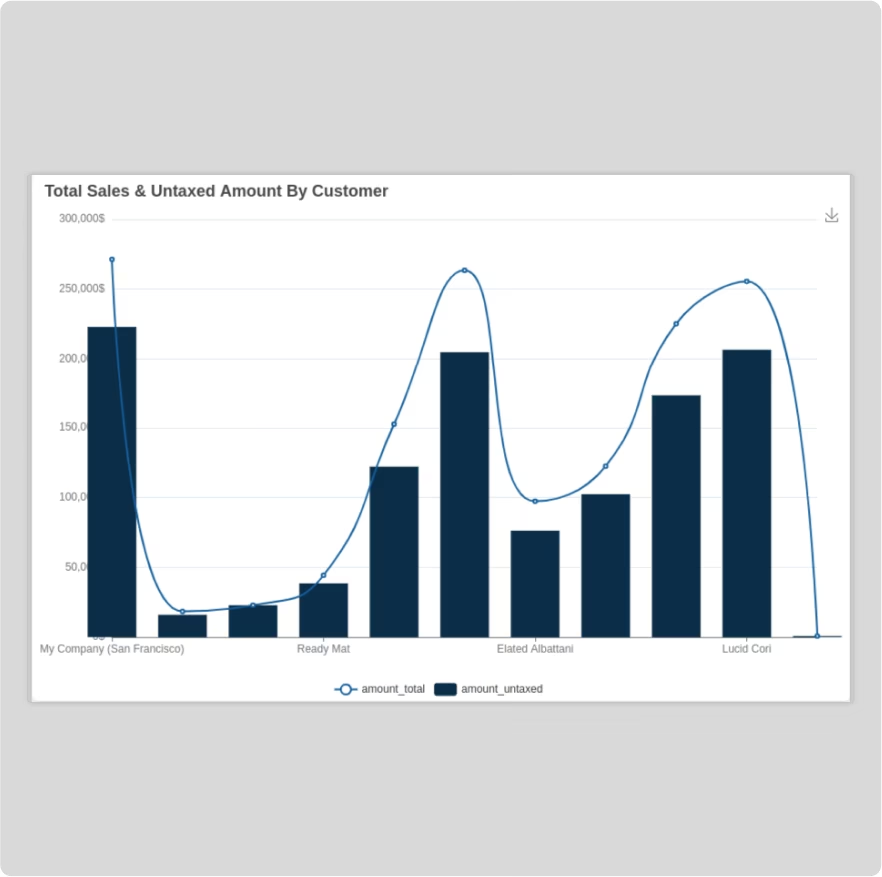
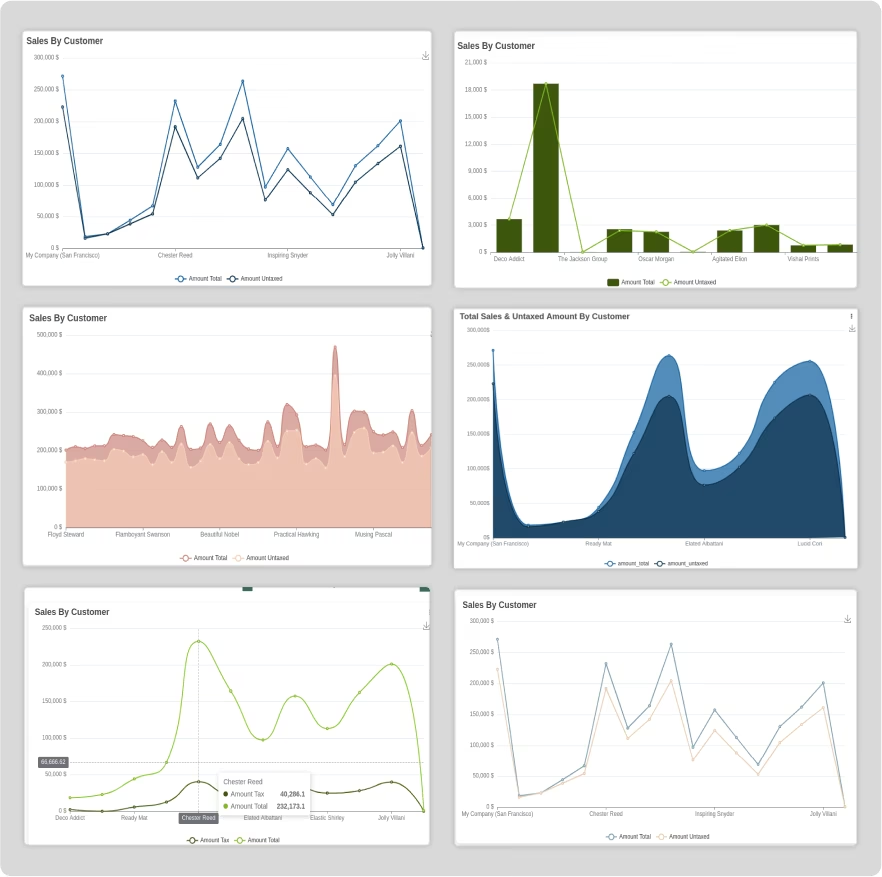
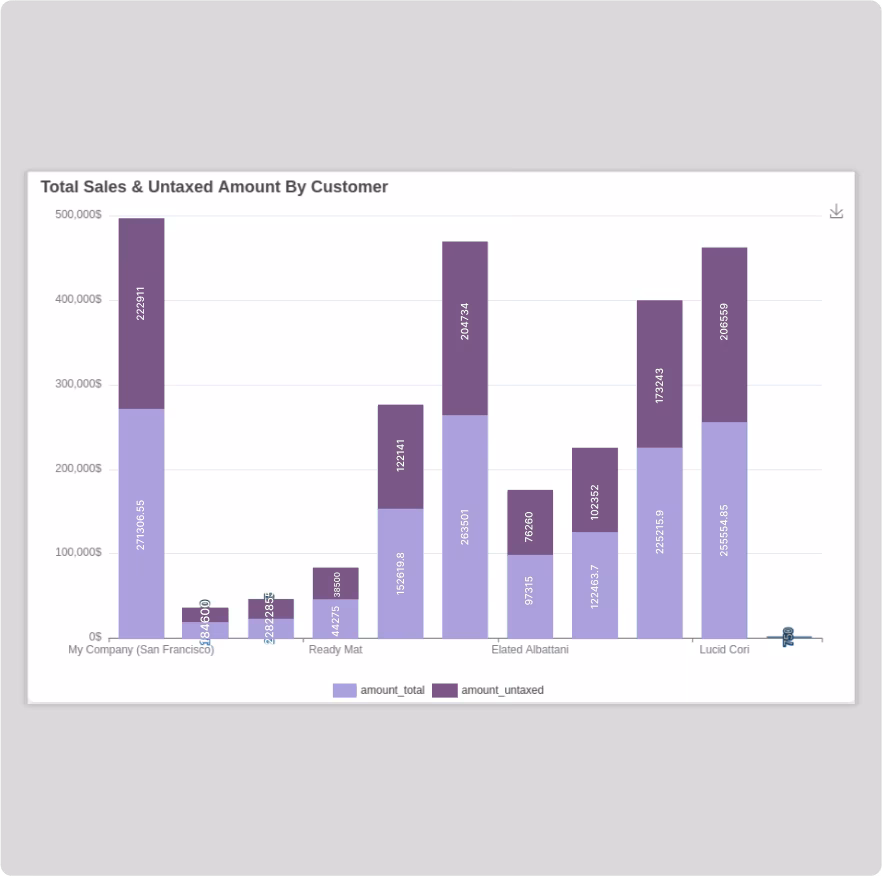
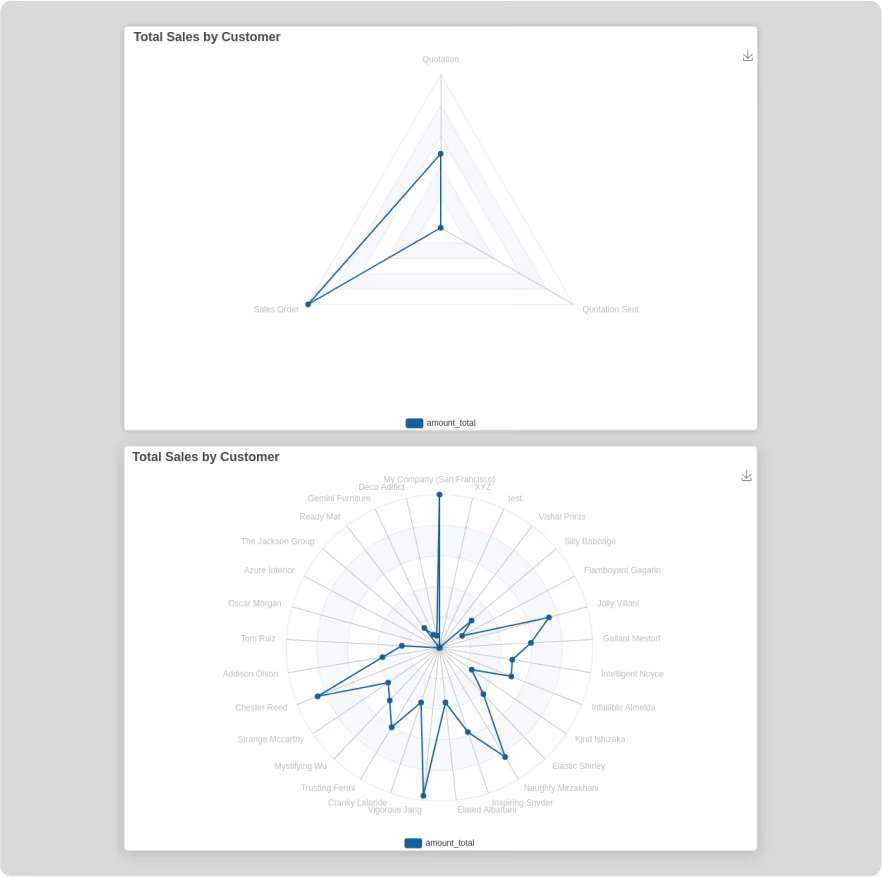
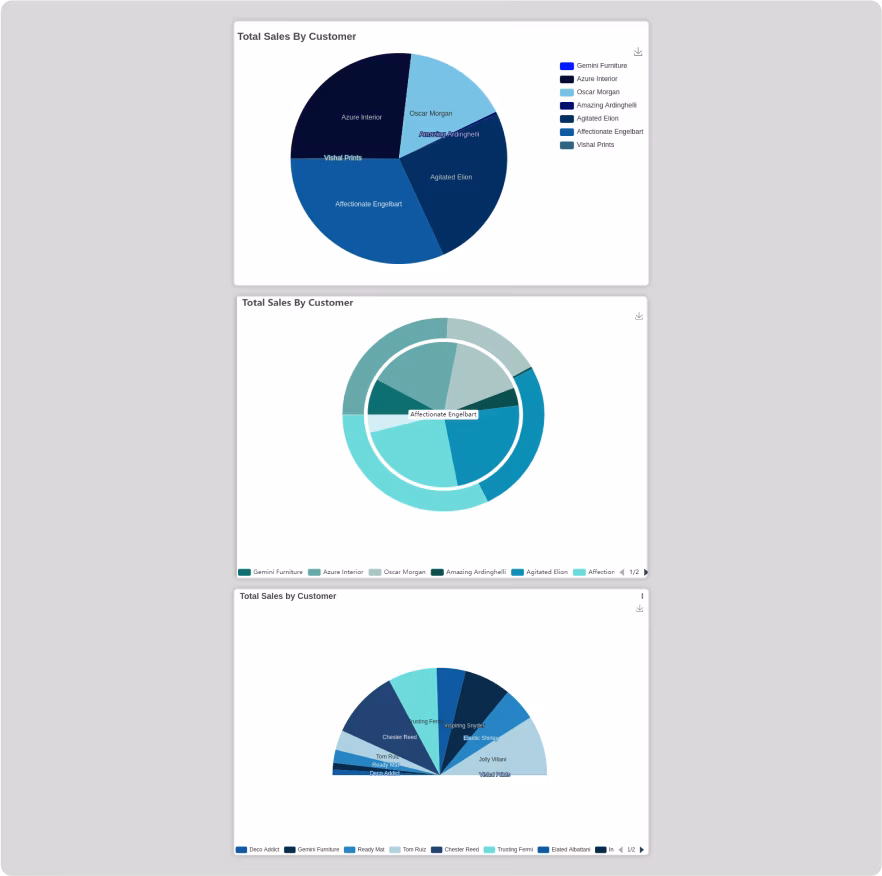
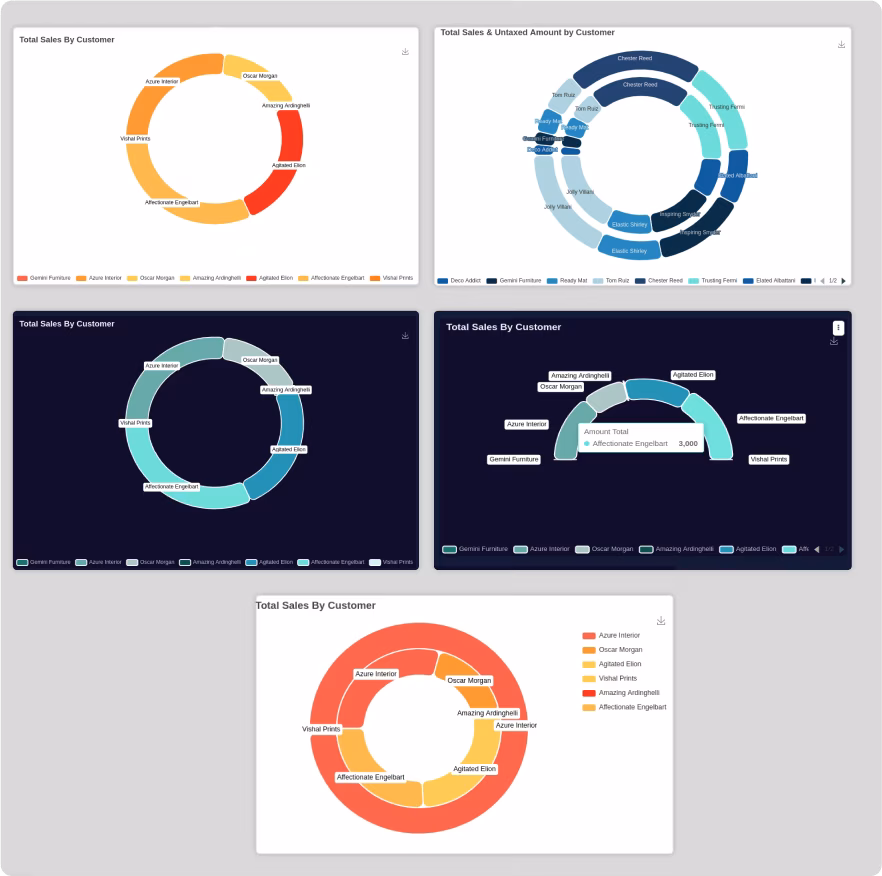
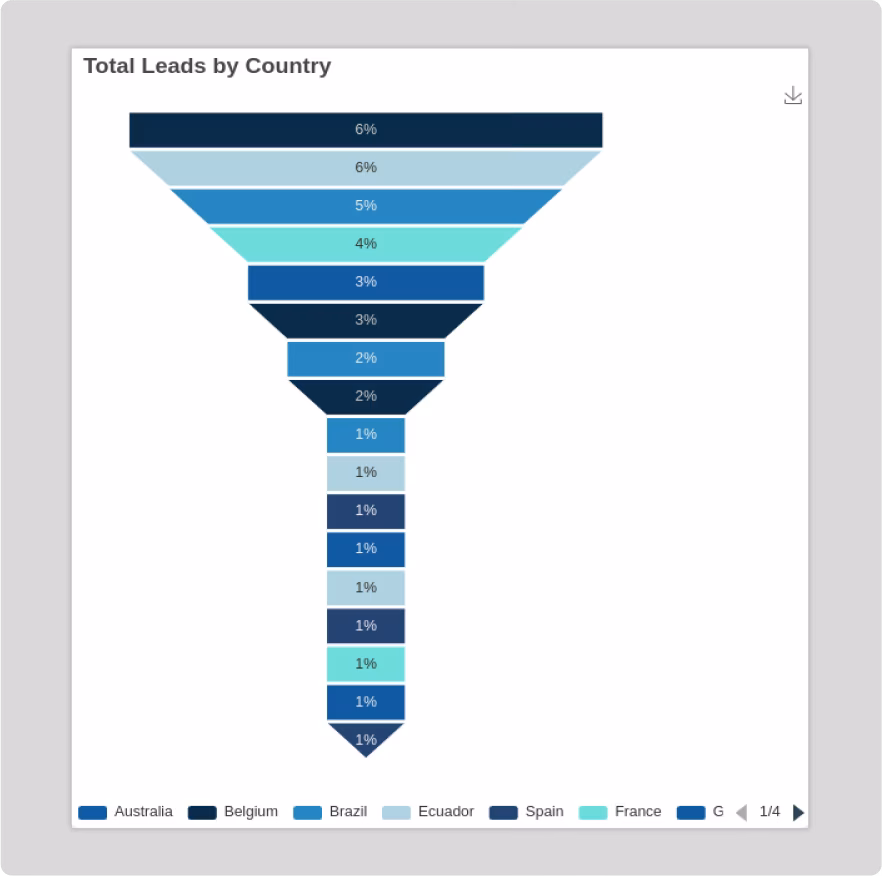
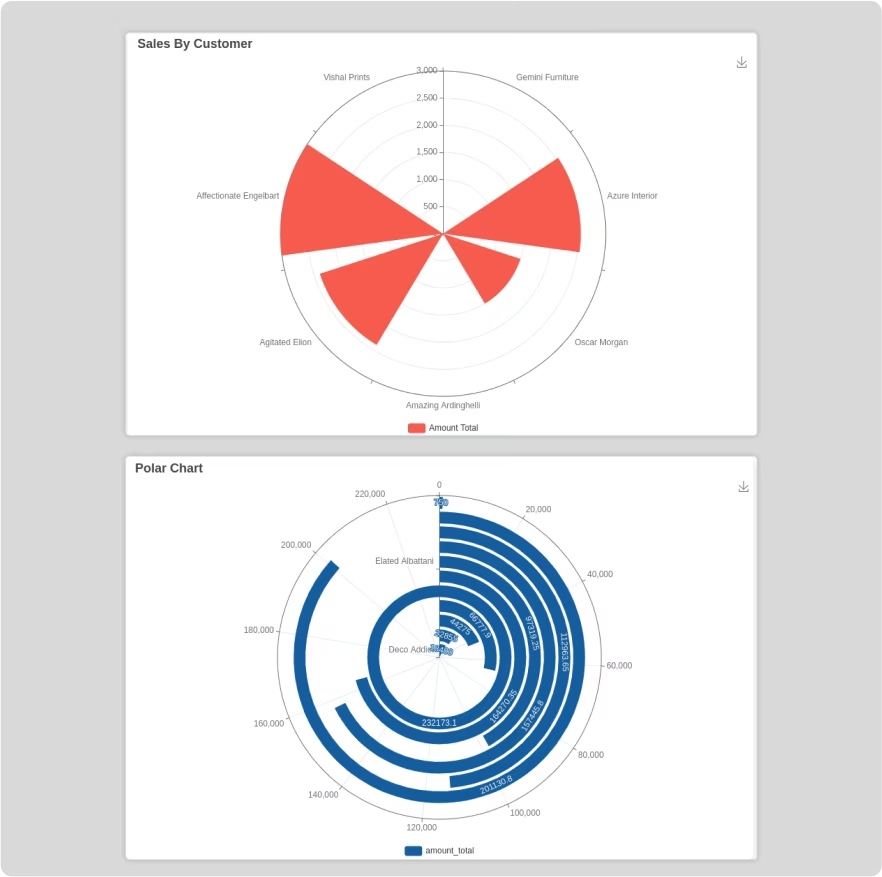
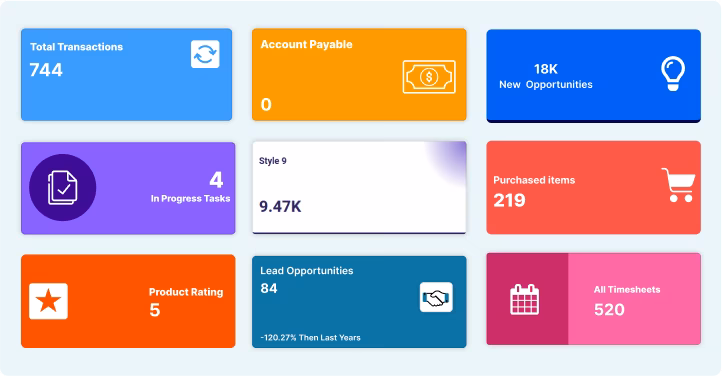
Smart Data Visualization: Choose from a wide range of chart types, including bar, line, pie, scatter, and KPI cards, to represent your data effectively.
Real-Time Analytics: Access up-to-the-minute data and monitor your business performance in real time.
Interactive Drill-Down & Filters: Explore your data in depth with interactive drill-down capabilities and dynamic filters.
Customizable Layouts & Themes: Personalize your dashboards with responsive layouts, various tile styles, and multiple color themes, including a dark mode.
Multiple Data Source Support: Connect to and visualize data not only but also from external PostgreSQL and MySQL databases.
Embed Views: Integrate standard views like list, form, kanban, and pivot directly into your dashboards.
Secure Sharing & Access Control: Share your dashboards with your team and control data visibility with user-based access rights.
Data-Driven Decision-Making: Empower your team with the insights they need to make smarter, more informed decisions.
Improved Business Visibility: Gain a 360-degree view of your business performance with a centralized and comprehensive dashboard.
Increased Efficiency: Save time and eliminate the need for manual data extraction and report generation.
Enhanced Collaboration: Easily share dashboards and insights with your team to foster a data-driven culture.
User-Friendly Analytics: An intuitive and easy-to-use interface makes data analysis accessible to users of all technical levels.
Visually Stunning Reports: Create professional and visually appealing dashboards that are easy to understand and interpret.

Unlock the true potential of your data with AnalytiX Dashboard, a cutting- edge Odoo
dashboard module designed to revolutionize the way you visualize & analyze information.
Elevate your decision-making process with intuitive, interactive, & insightful dashboards
that empower you to confidently navigate your business landscape.
Smart Data Visualization
Real-time Analytics
Customizable Dashboard
User-Friendly Interface

Why AnalytiX Dashboard

Real-Time update without setting time intervals.
Shareable dashboard link
and embed link
Embed base module view
in the dashboard
Import/Export dashboard
& dashboard items
Predefined
date filter
Preset 10+ color theme with Odoo default theme
Quickly explore
your data
Interactive
Charts
Simple Interface
Share your
findings
Smart Data
Detection
Attractive and fully
responsive layout
Group access
control
All dashboards
view
Predefined dashboard
templates
Attractive
dark mode
Automatic generate colors theme from your brand logo.

Dashboard at lightning speed
An enterprise-ready dashboard builder and visualizer that
makes data analytics accessible to everyone in your company.
This will makes it easy to create charts from raw odoo data.
Suitable for Analysts, Teams, Small Business & Developers
looking for quick insights.

AnalytiX Dashboard
An enterprise-ready dashboard builder and visualizer that makes data analytics accessible to everyone in your company. This will makes it easy to
create charts from raw odoo data. Suitable for analysts, teams, small business & developers looking for quick insights.

Empower yourself and your business
Whether you are in the data team or a business unit, regardless of your industry, AnalytiX Dashboard can help you leverage data of your company and have the right input at the right moment.
Visualize your
answers
Get interactive and visual answers in the form of different charts that will help you easily read the story behind the data.
Insights you can
share
Easily save and share your dashboards with a link that your team can open and explore themselves.

AnalytiX Dashboard: Your Next-Generation
Data Visualization
Download AnalytiX Dashboard today and experience firsthand how these features will revolutionize your data
visualisation journey. Say hello to a brighter more efficient future in data analysis.

For everyday decision-making
AnalytiX Dashboard alleviates the complexities often
associated with data analysis in Odoo. You don't have to
worry about exporting records, selecting columns, chart
types or creating pivot tables.
For your analysis
The immediate visual understanding through charts and
insights saves data analysts valuable time. It also prevents
the loss of opportunities that might otherwise be spent sifting
through complex data or engineering new features.

For your business
AnalytiX Dashboard enables business owners to gather data
and insights independently, without the need for external
consultants or complex analytical platforms. The app provides
immediate insights that help drive better decision-making by
understanding key data drivers and offering quick forecasts.
Why choose AnalytiX Dashboard?
AnalytiX Dashboard alleviates the complexities often
associated with data analysis in Odoo. You don't have to
worry about exporting records, selecting columns, chart
types or creating pivot tables.


Real-time updated dashboard
Say goodbye to manual refreshes as 'AnalytiX Dashboard' seamlessly updates your dashboard at regular intervals. Stay ahead of the curve with the latest insights, enabling swift decision-making and ensuring that your data is always current
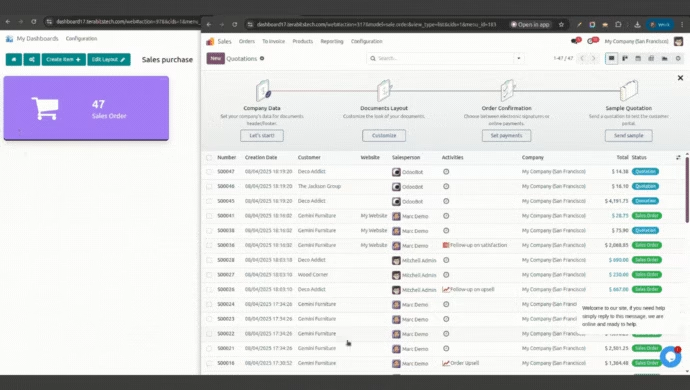

Embed base view into dashboard
Embed base module's view (form, tree, kanban, calender, pivot, etc) into your dashboard with applied filter.

Embade code from other sources
You can load other sources data(website, youtube video, other plateform videos, tutorials) by loading embade iframe code.


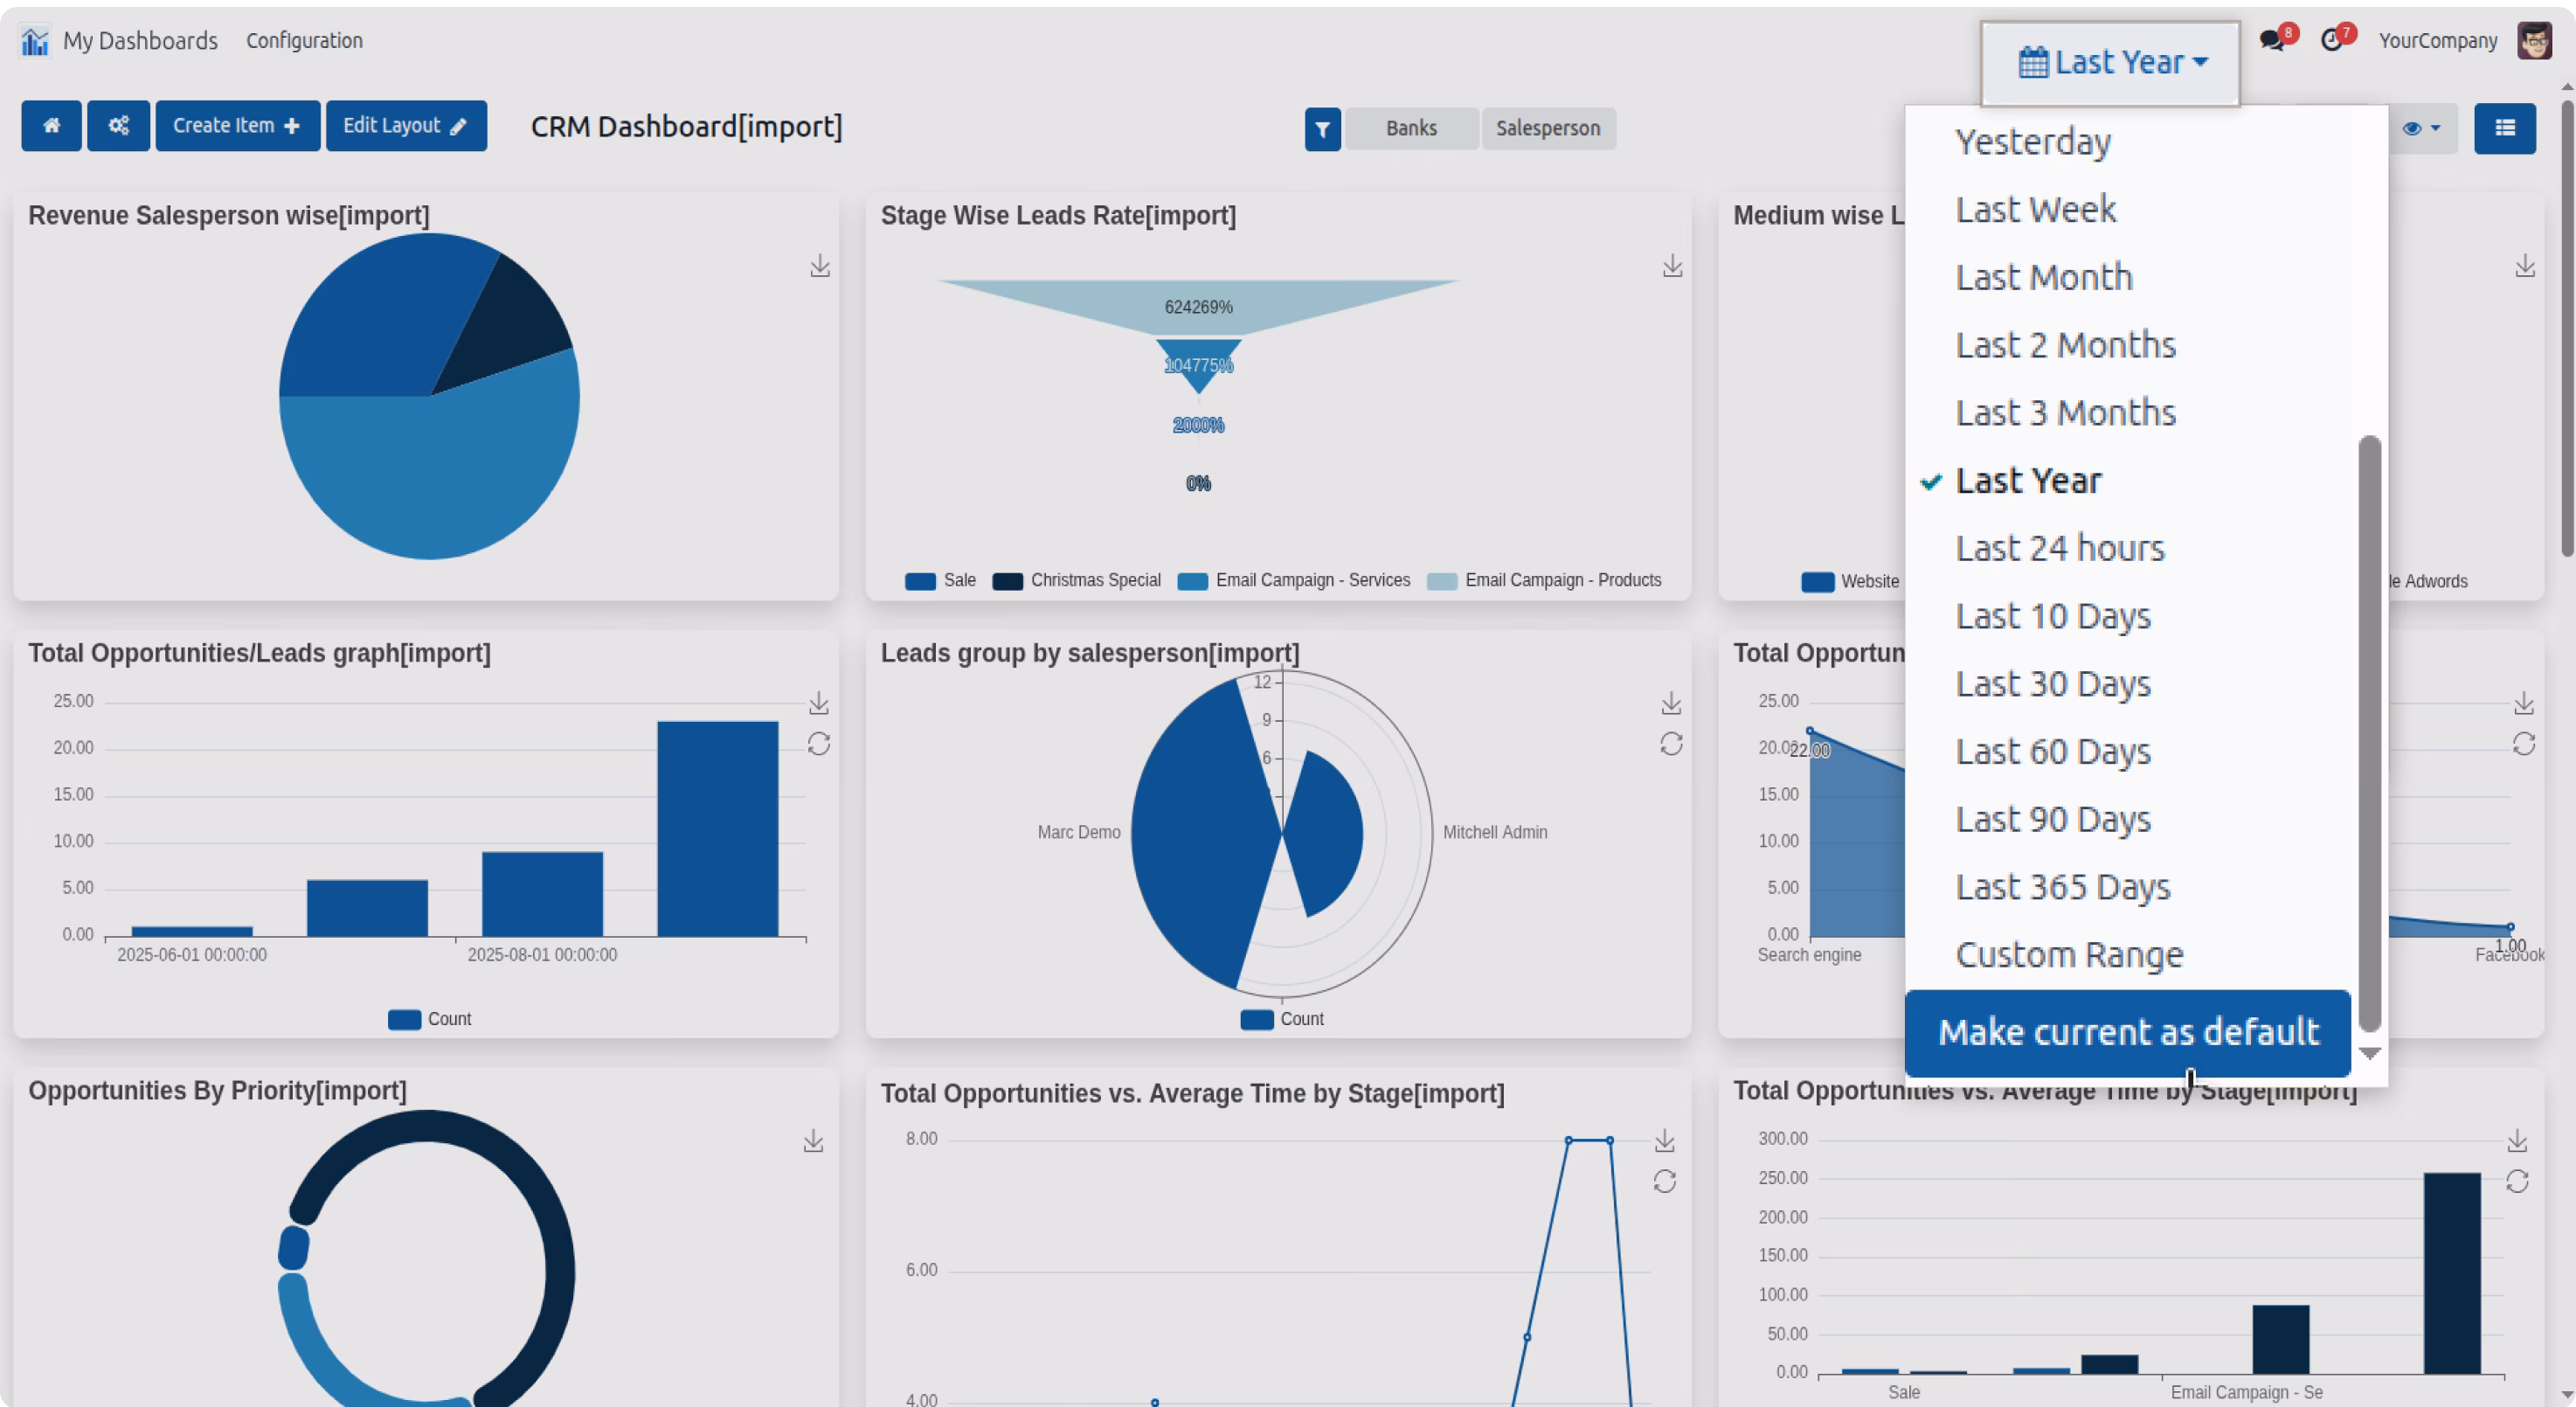
Advance date filters
Load your dashboard data with the types of predefined filters.


Retrive data by SQL query.
Seamlessly access and analyze specific data sets by crafting custom queries tailored to your business needs. Whether you're seeking detailed insights, filtering information, or conducting targeted analysis, this feature puts the power of data retrieval in your hands.
Automatic generate colors theme from your brand logo.
After uploading the logo, the System will generate all the colors from the logo's colors.
Then you can see those color themes in your dashboard.

Option to create a custom filter
You can create custom filters from the dashboard. After adding the filter added filters will show automatically.

Import and export the dashboard
Need to migrate or collaborate? Importing is just as seamless, ensuring your dashboards are portable and adaptable to your evolving business needs. Effortlessly transport your customized dashboards by exporting them in JSON format, making backup and sharing a breeze.
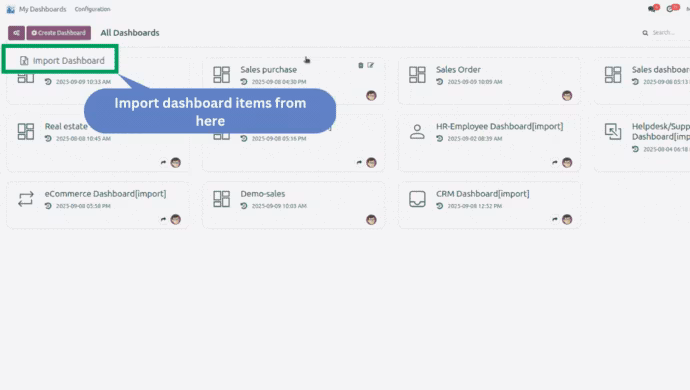
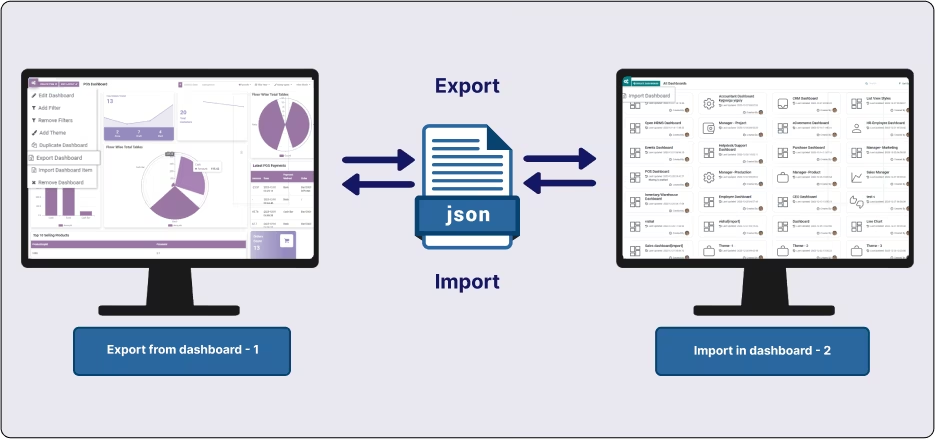

Import and export dashboard items
Import and export the dashboard items in json format.
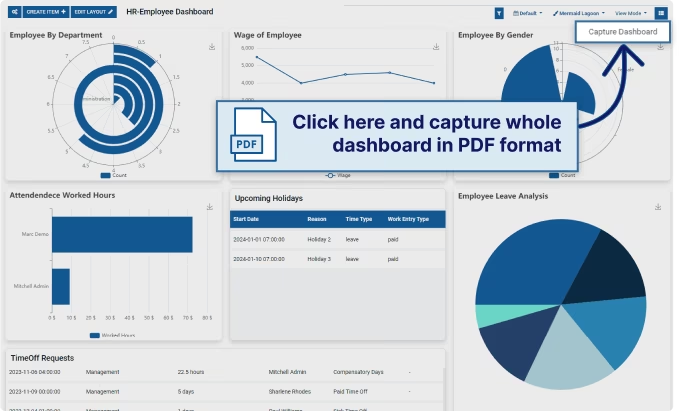
Download dashboard to PDF with items
You can share your business statistics with your customers and business groups by downloading dashboard items and the full dashboard in PDF format.

Embed Dashboard link on other websites
You can embed the customized dashboard into your website pages and website blogs by generating the embedded dashboard content with just one click.
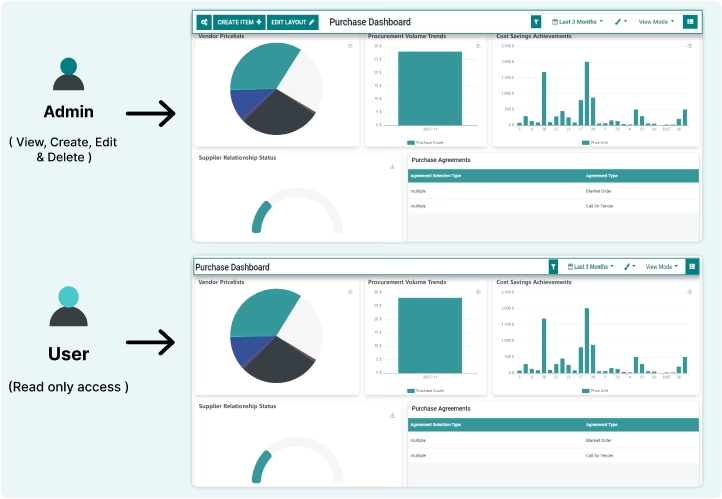
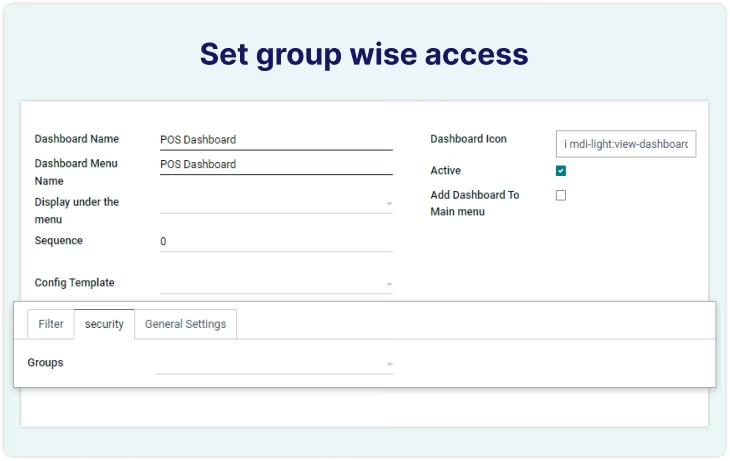
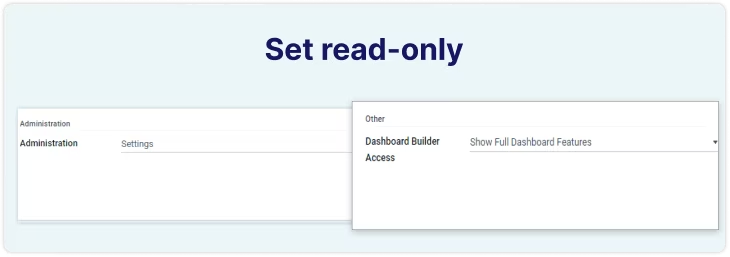
Simplify access control
Effortlessly manage user permissions by applying user groups, and granting read-only or full access to dashboards. Whether collaborating with teams or sharing insights selectively, our streamlined access controls empower you to tailor data visibility, ensuring a secure and personalized dashboard experience for every user.
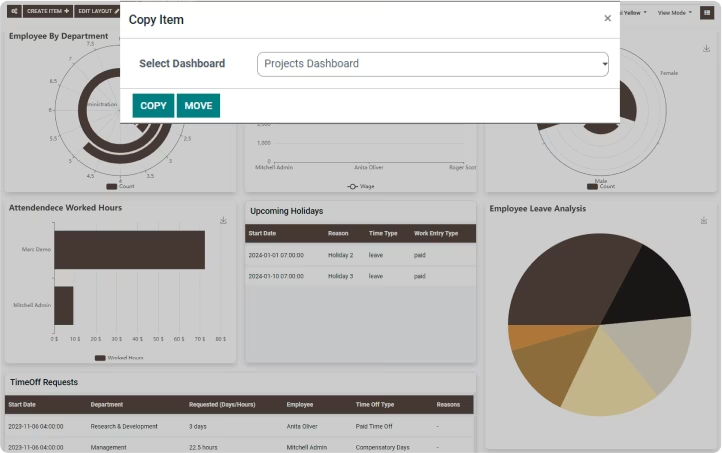
Move & copy dashboard items
Effortlessly rearrange and duplicate items between dashboards, empowering you to tailor your data presentation dynamically. Elevate your dashboard management with the freedom to move and copy items effortlessly.
Dark Mode
Experience the allure of our AnalytiX Dashboard enhanced aesthetics with the all-new dark mode.


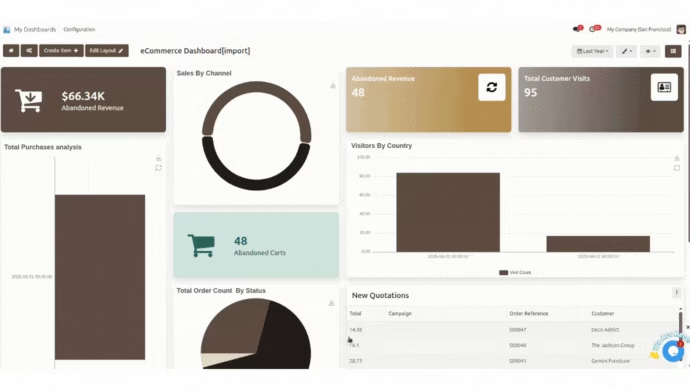
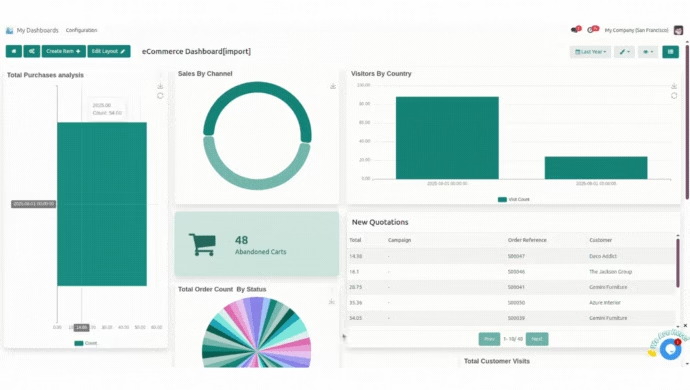
Get free predefined odoo dashboard
Get paid predefined main odoo modules(sales, POS, HR, employee, helpdesk, website, etc) dashboard templates.
Set the dashboard as main menu.
You can set the dashboard as a menu item of any menu's child relation, As well you can set the dashboard as a main menu item with its icon.

Easy measure data format option
You can set any measure after {value}. like {value} qty, {value} Days, {value} hours, {value} INR, and many more you want.
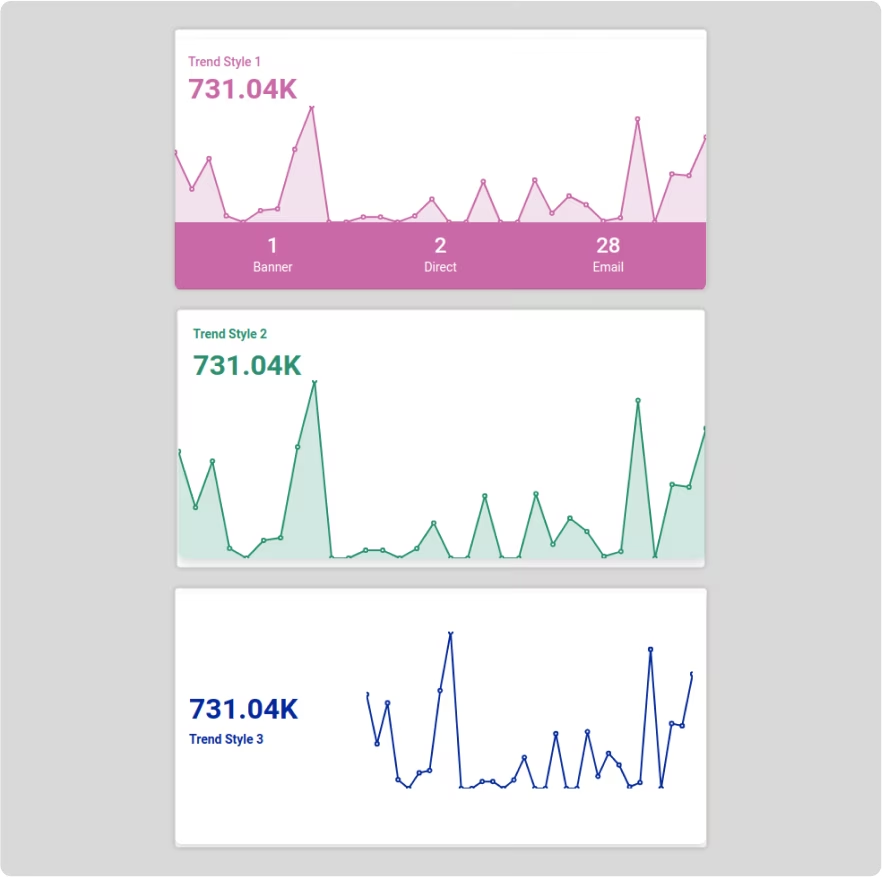
3 Trend chart designs with statistics data.
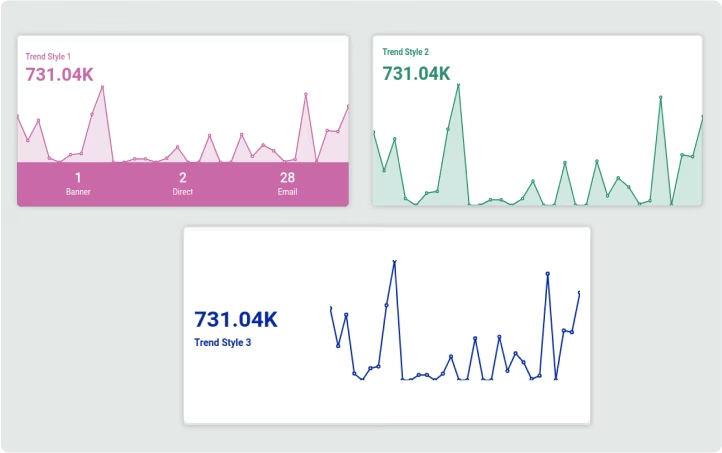

Trend chart with stats values of selected entities.
You can make trend chart which will show trend line and statistics. And at the bottom of trend you can show the stats values of selected entities.
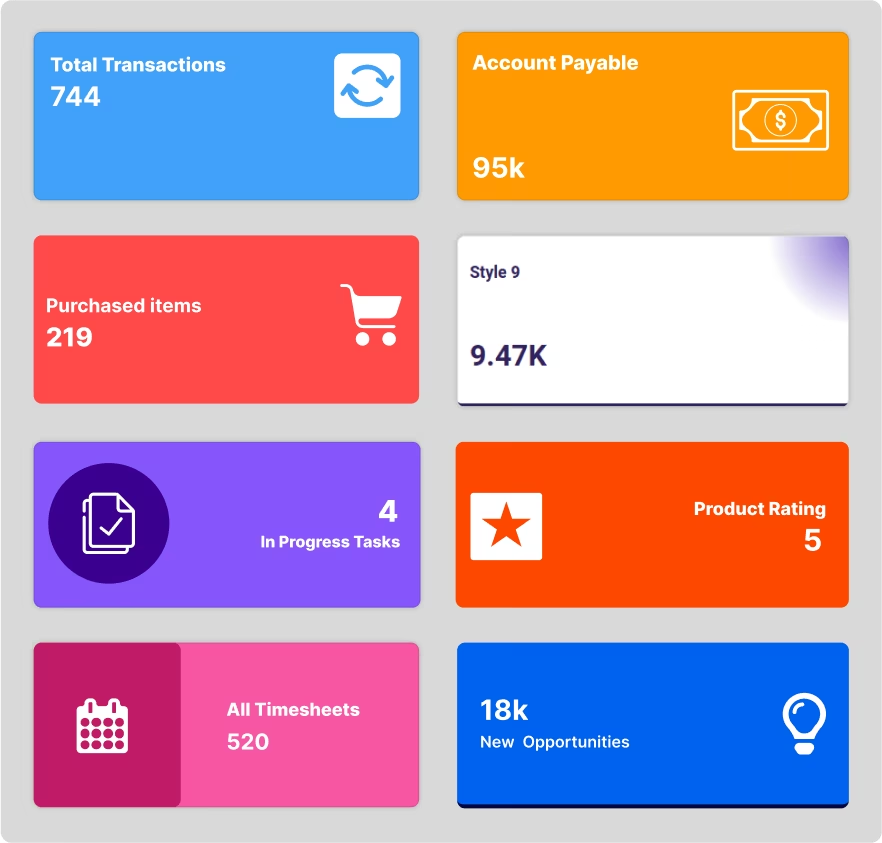
9 statistic item styles
9 attractive statistic item designs And the option to set action on statistic item click.
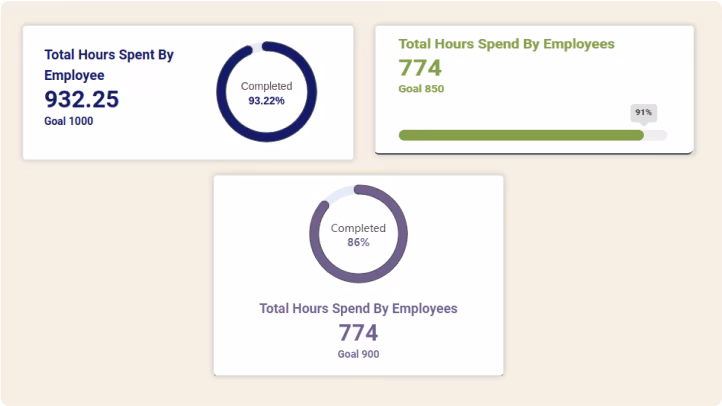
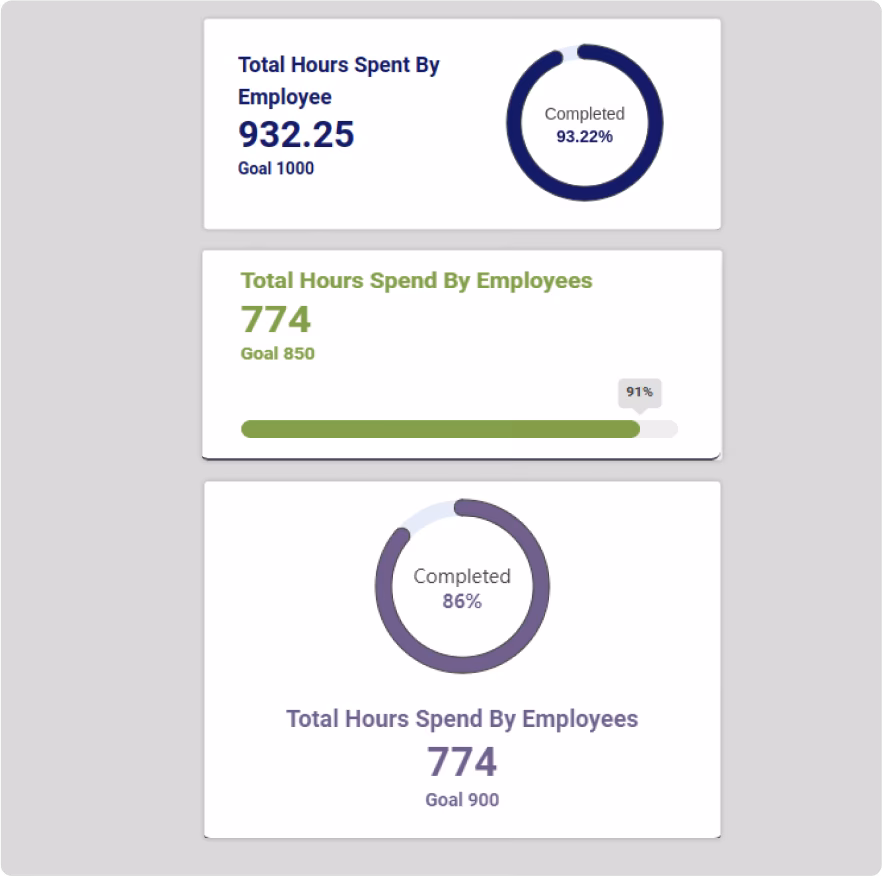
3 attractive KPI progress designs.
4 beautiful list view designs.


Get 10+ ready-to-use modern theme color palettes.
The option to make a custom palette. Generate a color palette from your brand logo.
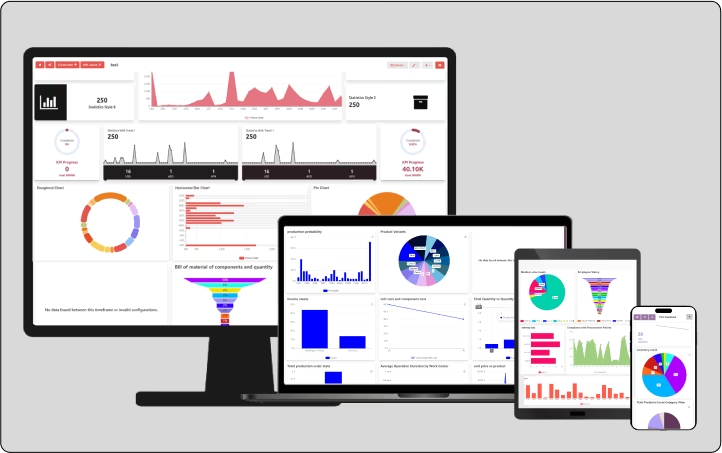
Responsive layout
Editable dashboard layout.
RTL support

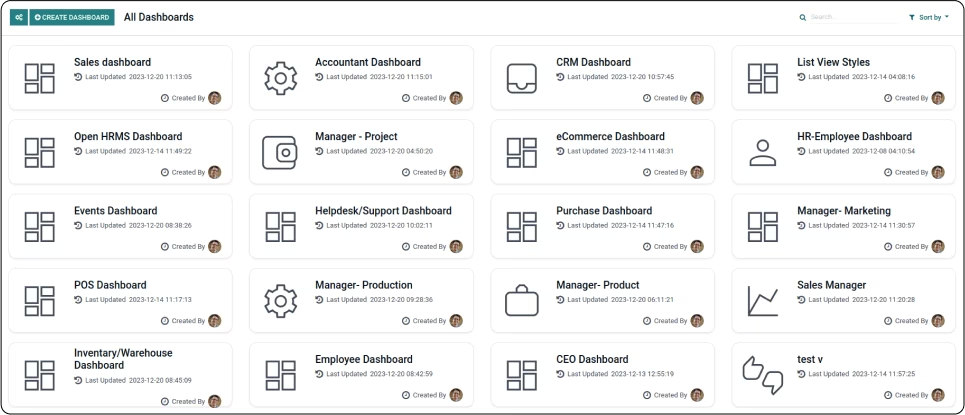
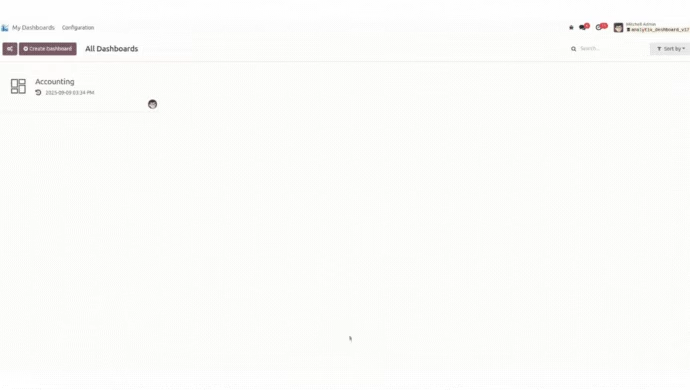
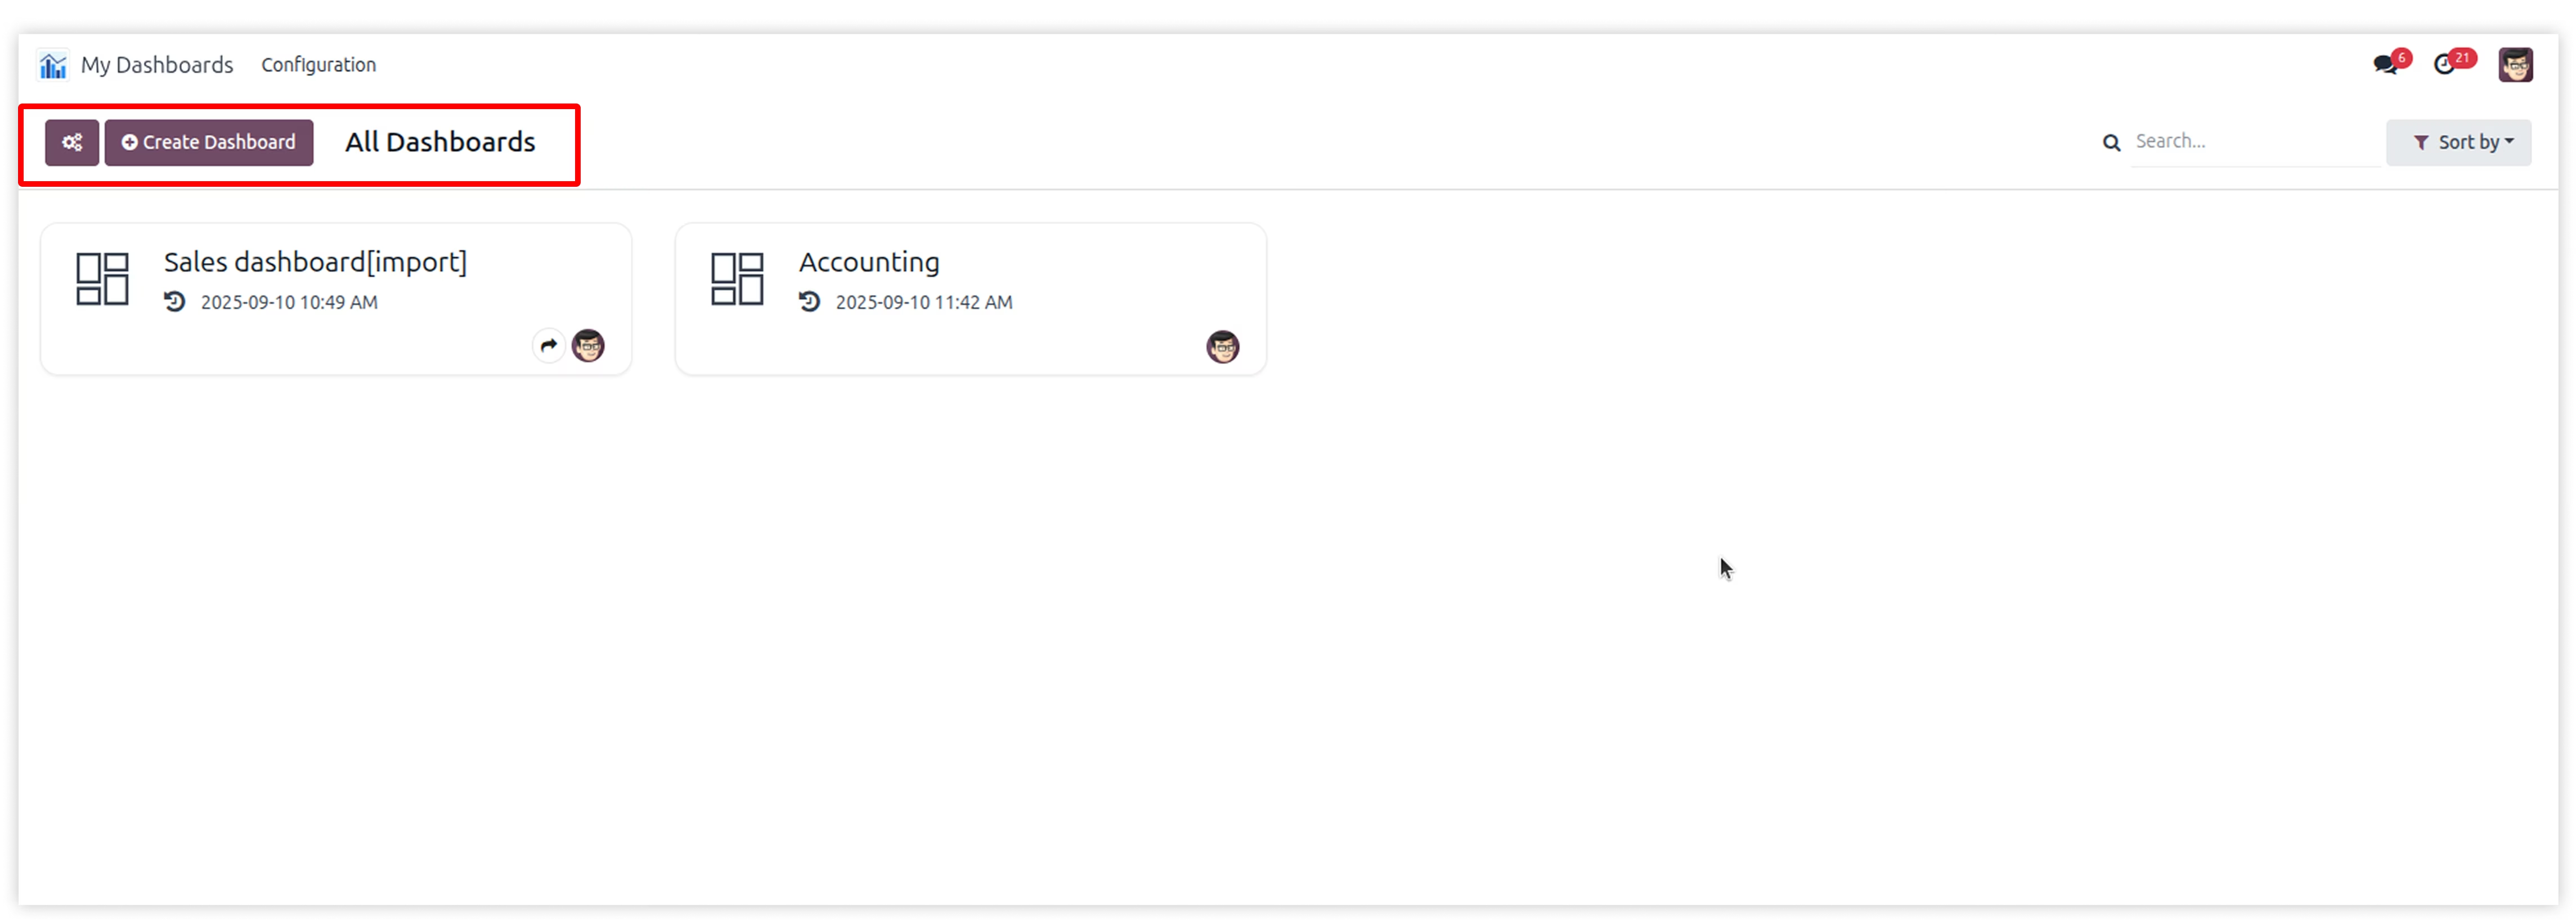
All dashboards view where you can explore all your dashboards.

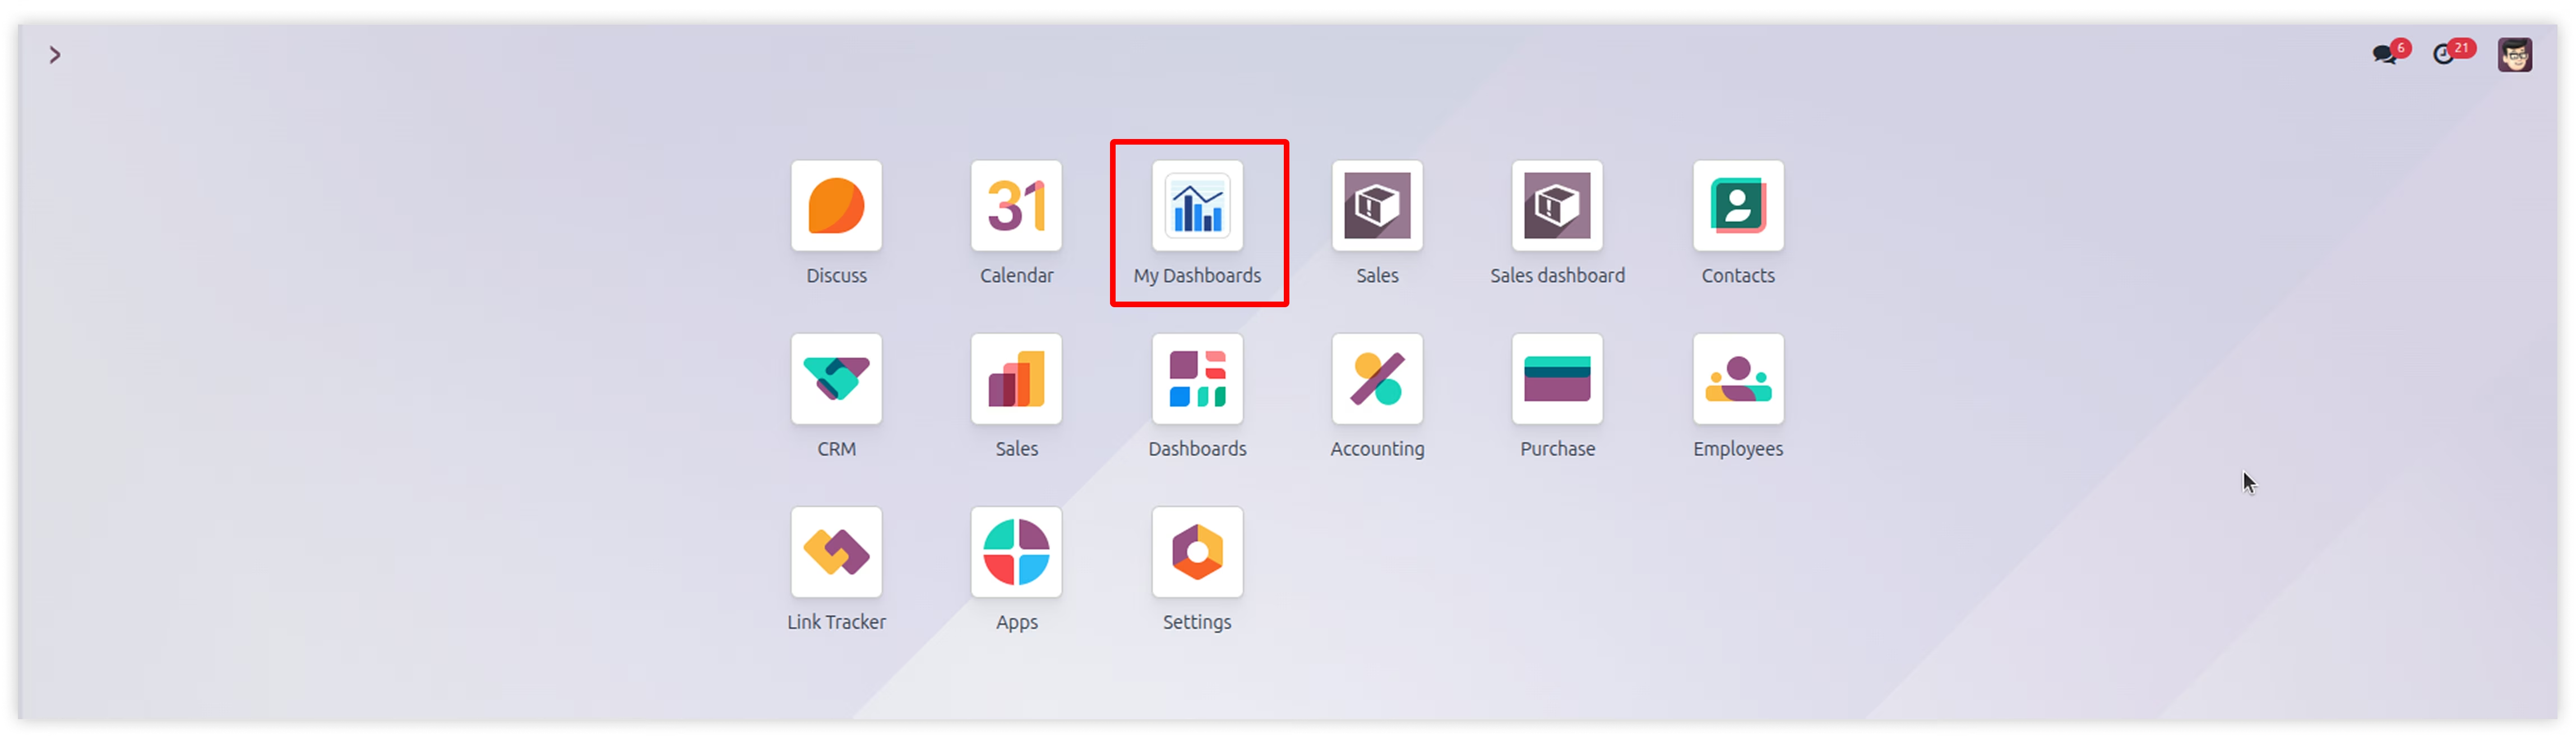
Go to apps and install the AnalytiX dashboard module.
After installing the module, you can see the AnalytiX dashboard menu
in the main menus.
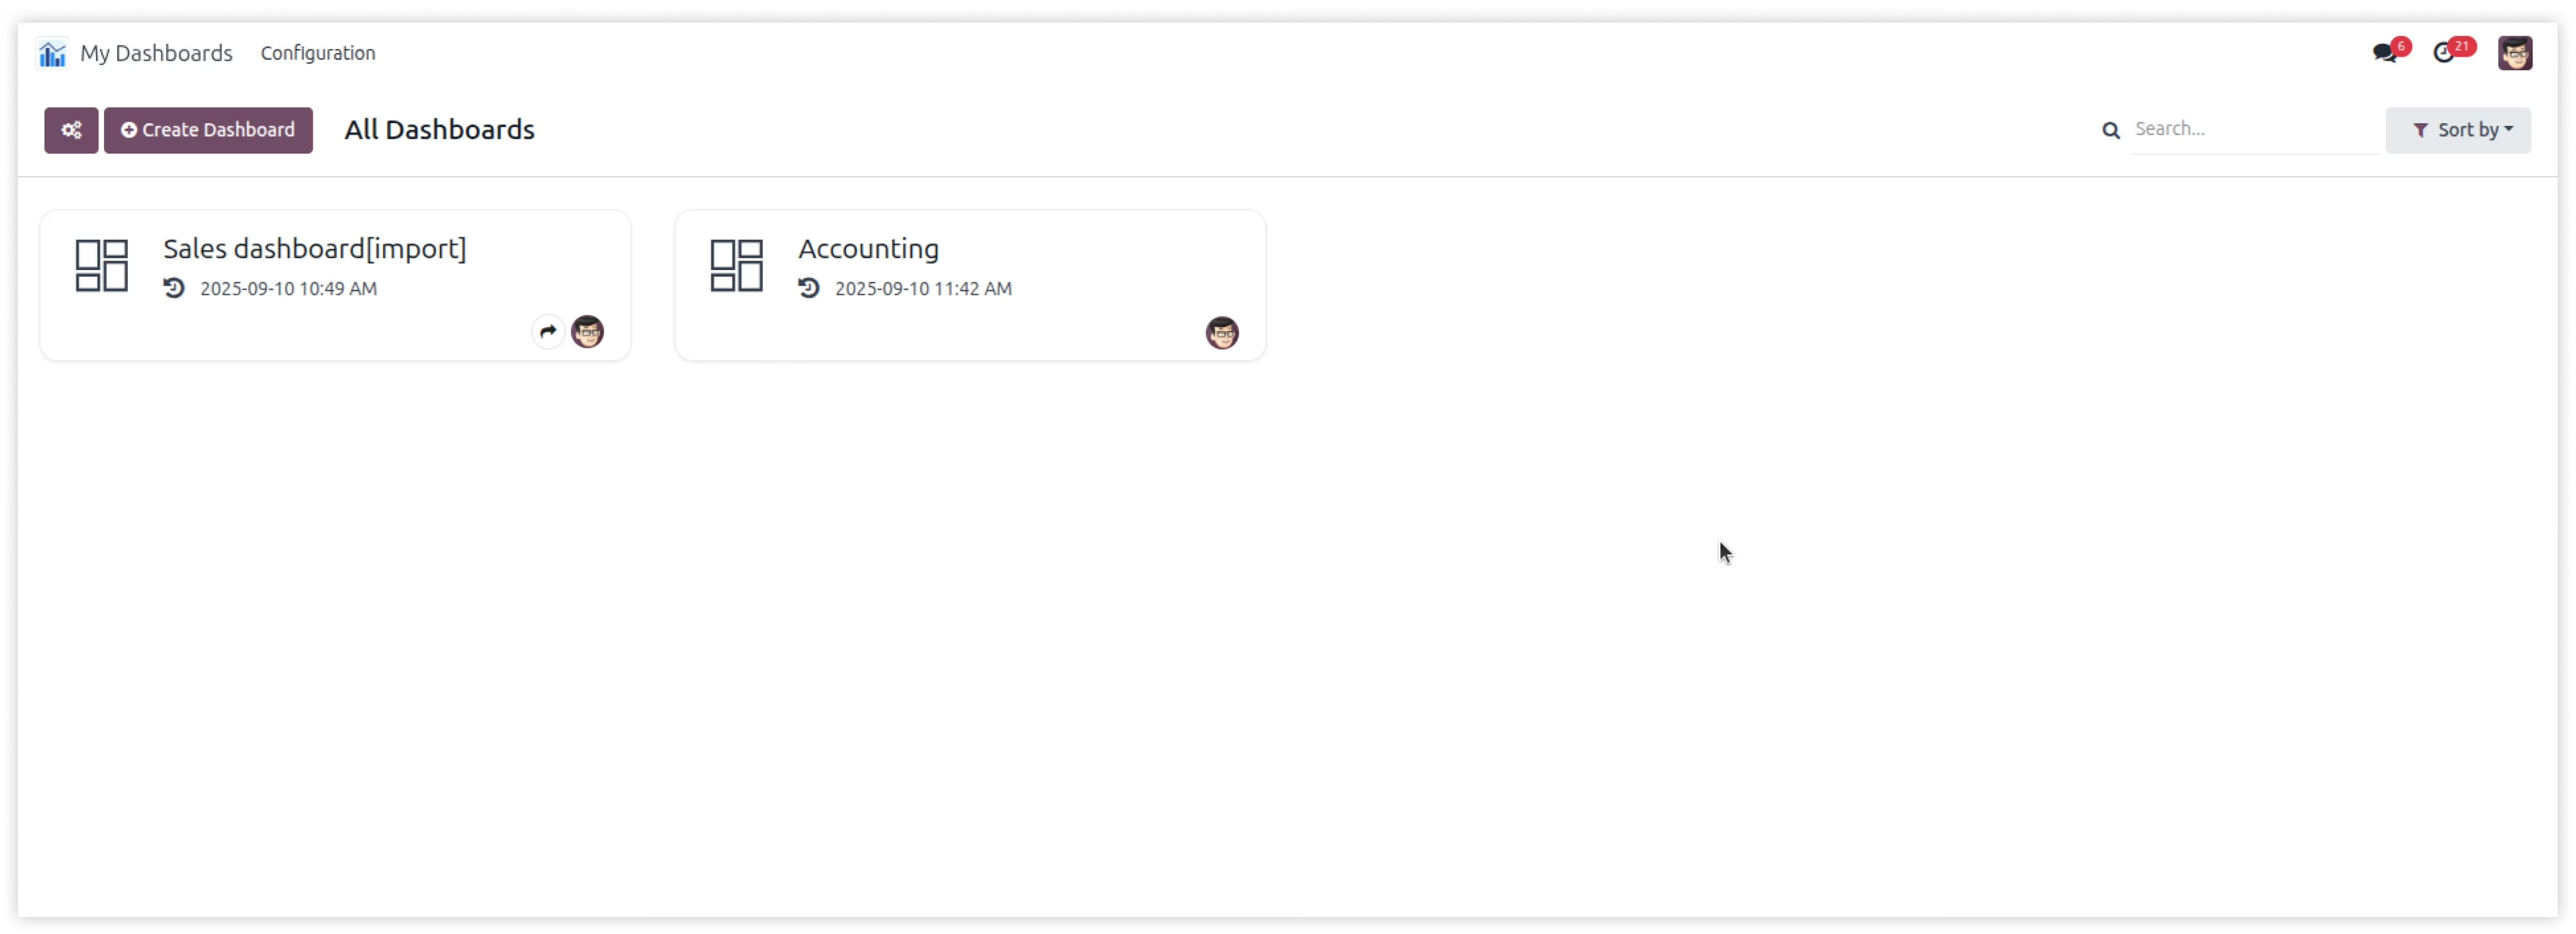
Now you just see only those dashboards which has access group assigned
to you and with readonly permissions.
With readonly permission you can't able to Add/Update/Delete dashboards.
To get full permissions, you have to grant permission in category AnalytiX Dashboard Access with group Show Full Dashboard Features
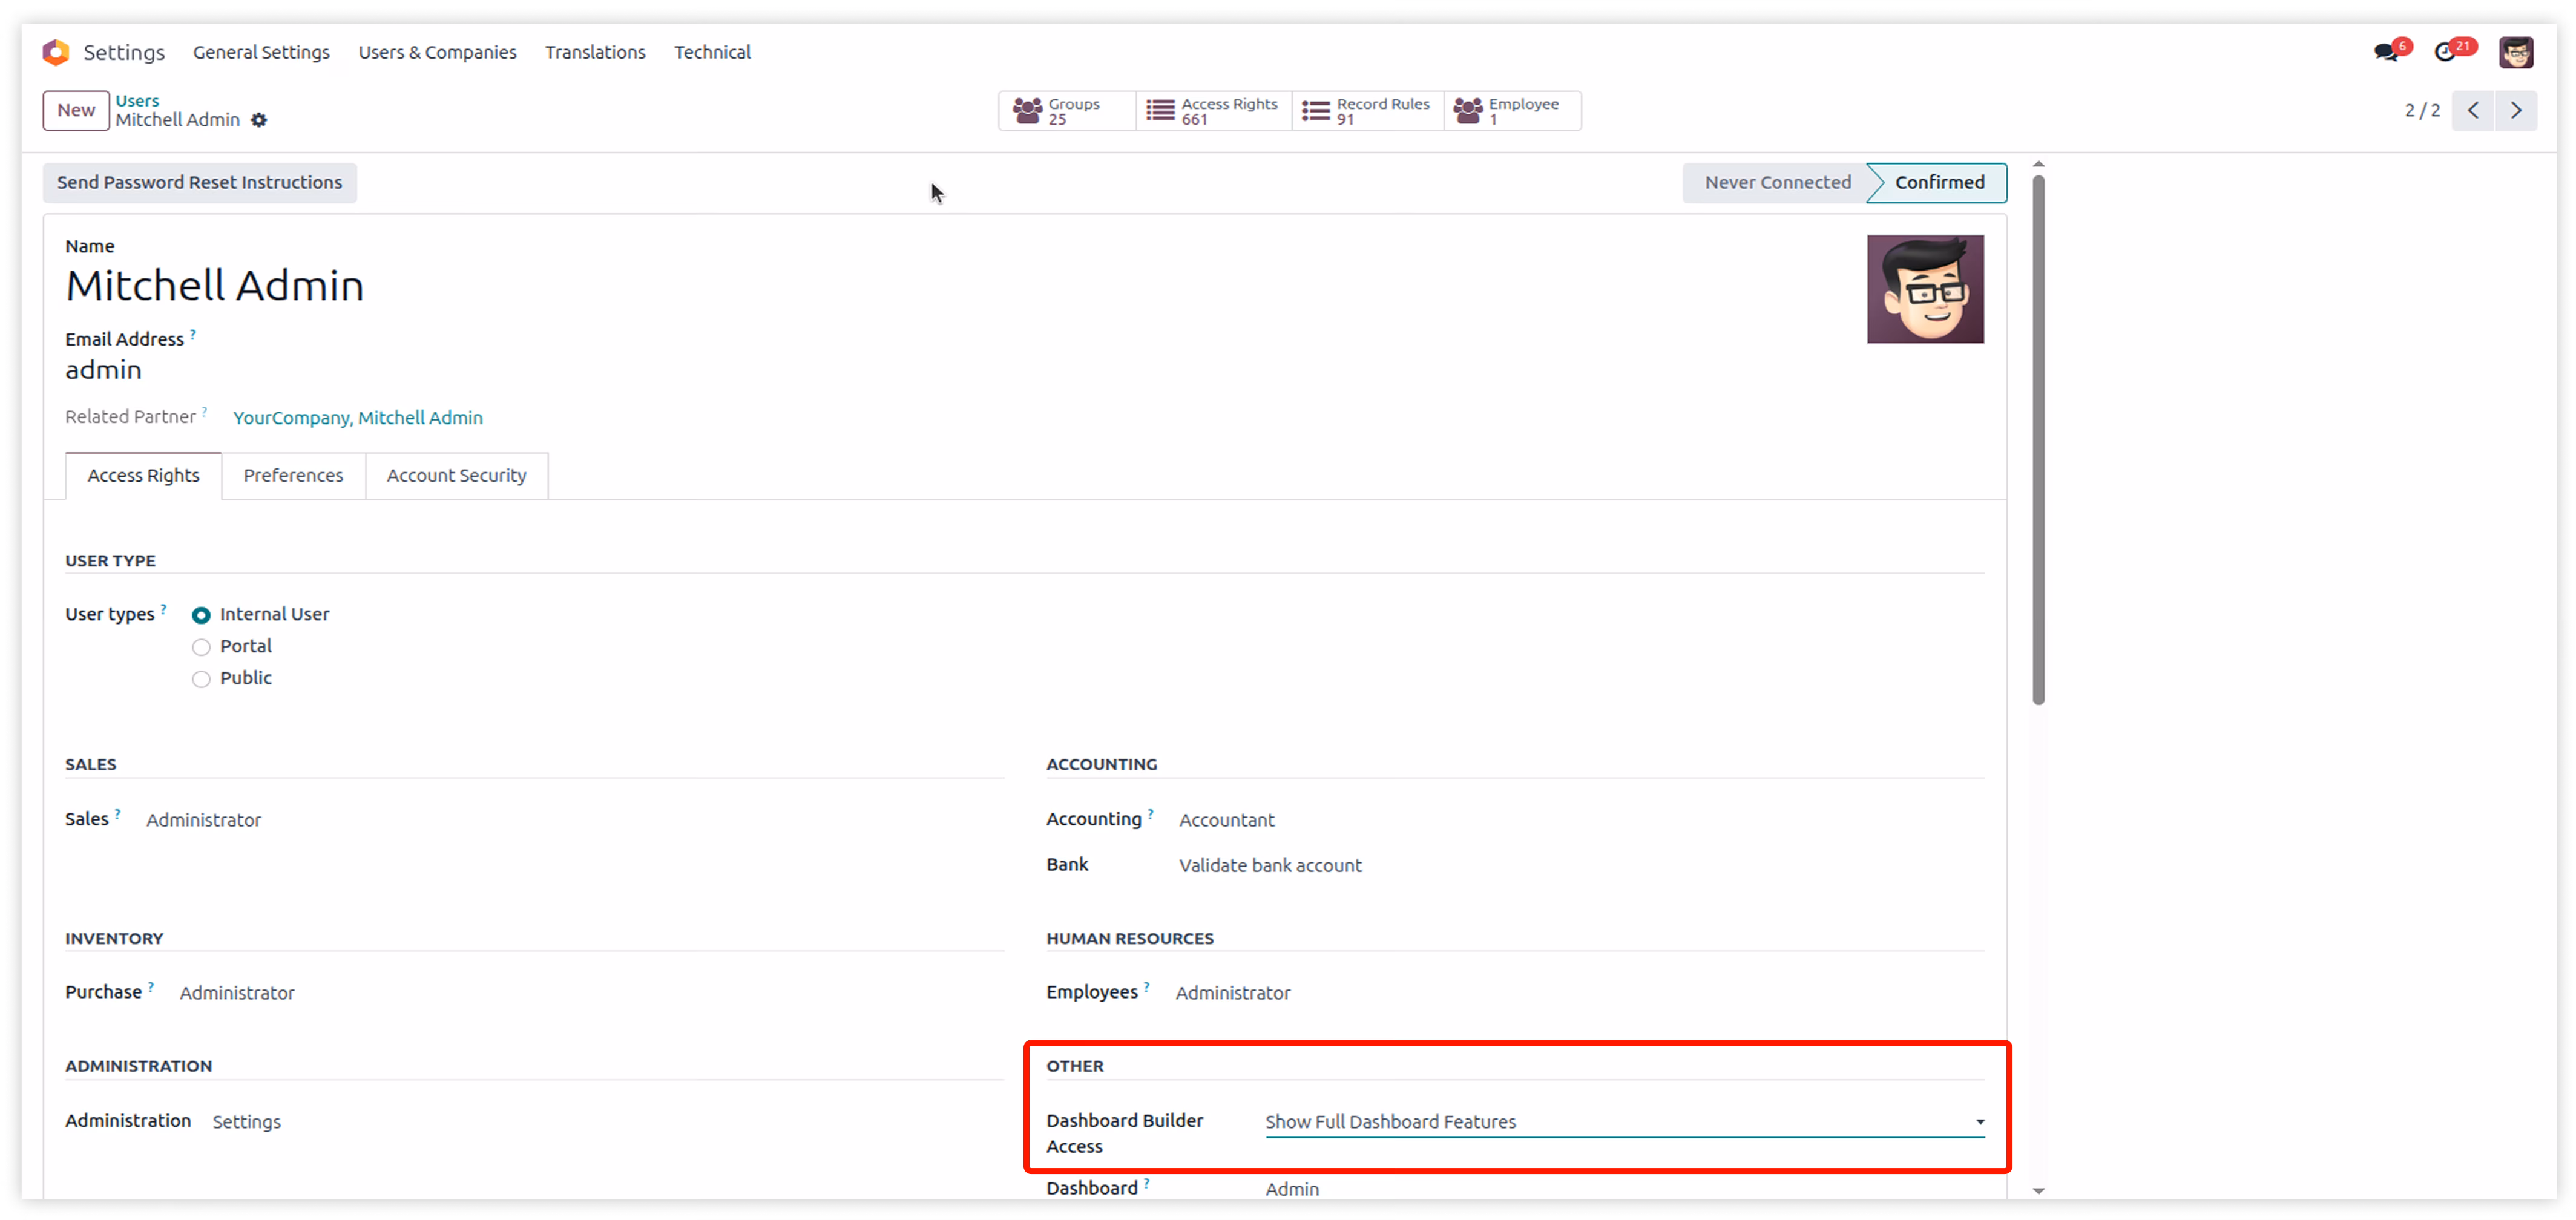
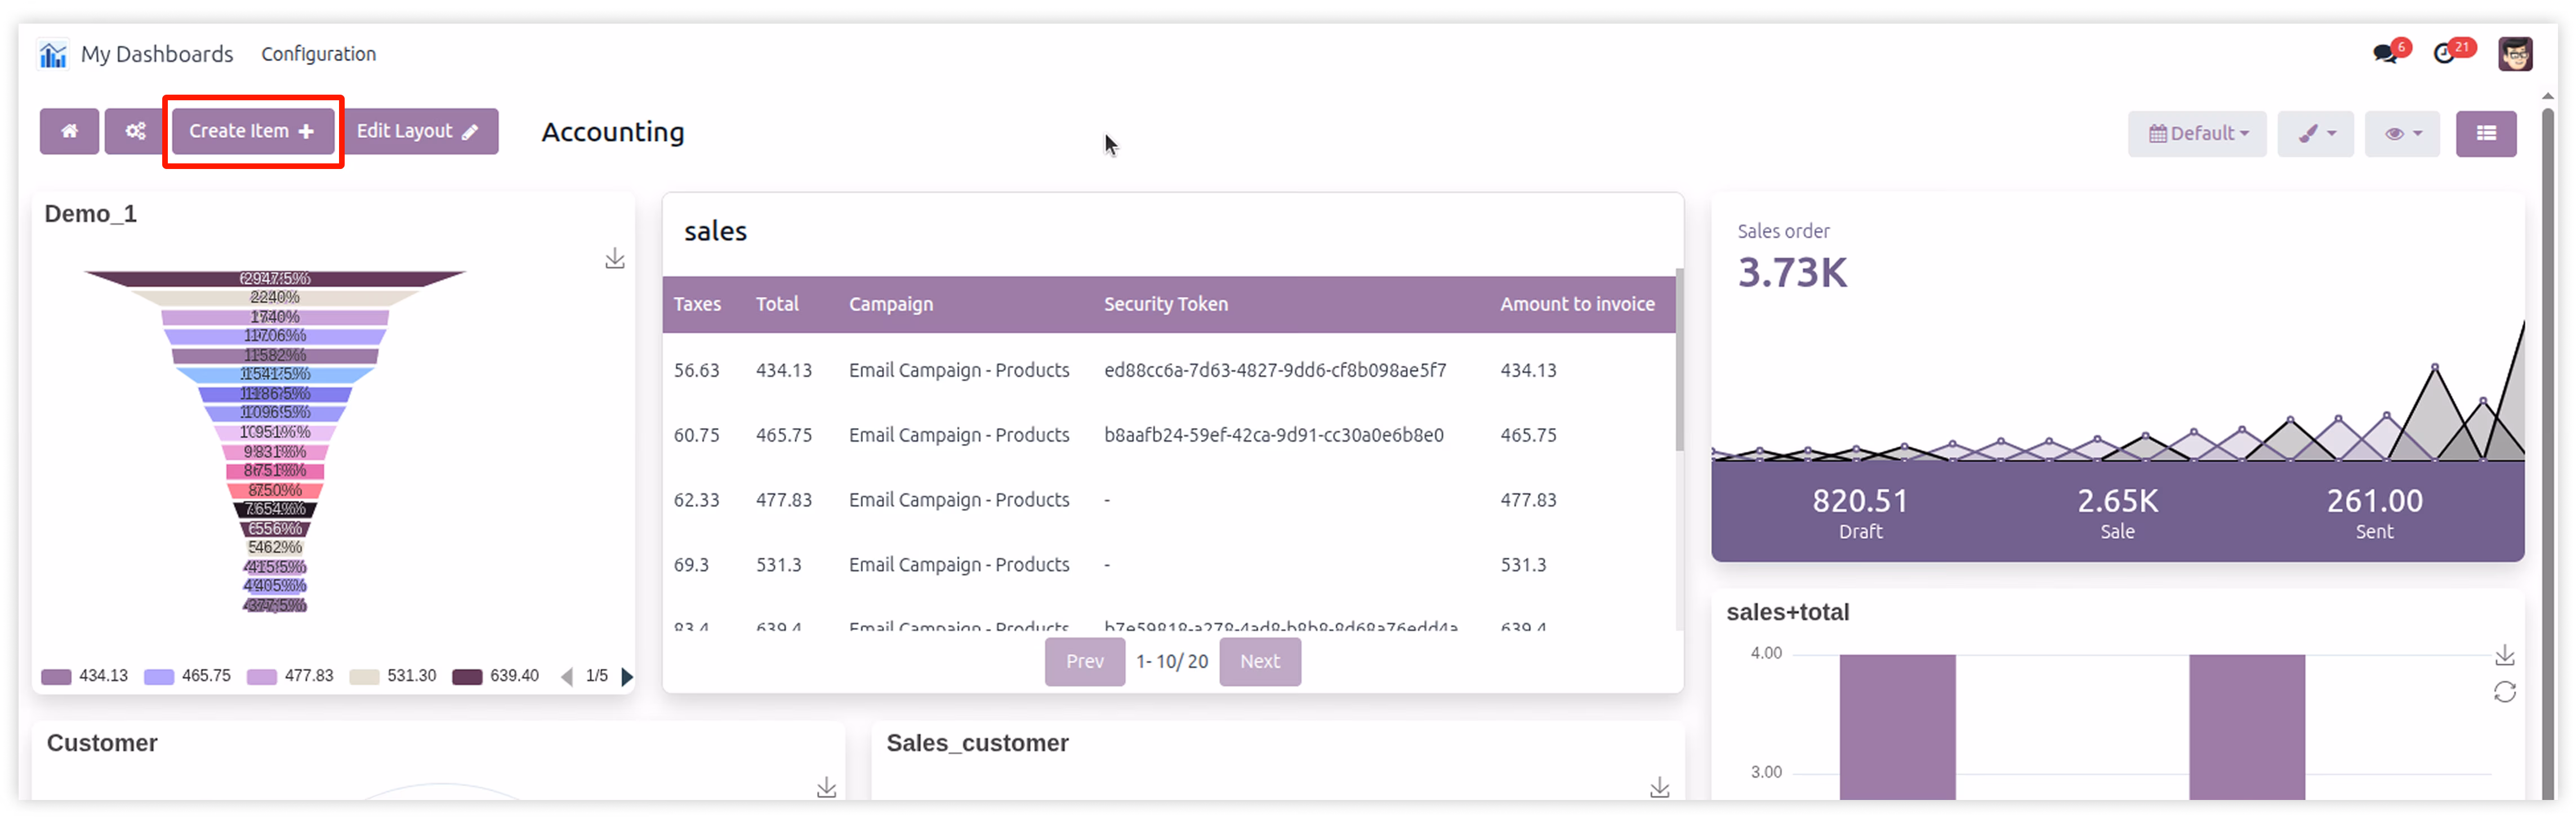
Now you have full permission of Create/Edit/Delete dashboard. You can see the button to create the dashbsaord.
After opening the created dashboard you can see the Create Item button. You can create dashboard items from there. And edit the dashboard layout by clicking on Edit layout button.