The Analytic Dashboard Template: Sale offers prebuilt templates for visualizing sales data. These templates are designed to help businesses monitor sales performance, track key metrics, and make informed decisions based on real-time data. By integrating with the IZ Analytics Dashboard, this module enhances the analytical capabilities, providing users with intuitive and interactive visualizations.
Prebuilt Sales Templates: Access ready-to-use templates for visualizing sales data.
Interactive Dashboards: Engage with dynamic charts and graphs for deeper insights.
Customizable Visualizations: Tailor visual elements to meet specific business needs.
Real-Time Data Integration: Ensure dashboards reflect up-to-date sales information.
User-Friendly Interface: Navigate through intuitive dashboards without the need for technical expertise.
Enhanced Sales Monitoring: Easily track sales performance and identify trends.
Informed Decision Making: Make data-driven decisions with comprehensive visual insights.
Improved Efficiency: Save time with prebuilt templates and automated data integration.
Scalable Solution: Adapt the dashboard to accommodate business growth and changing needs.
Analytics Dashboard
Ways to Accelerate
Your Business Insights
Upgrade your Odoo to the next level with Analytics Dashboard.Make analysis accessible with interactive and customizable data visualizations.
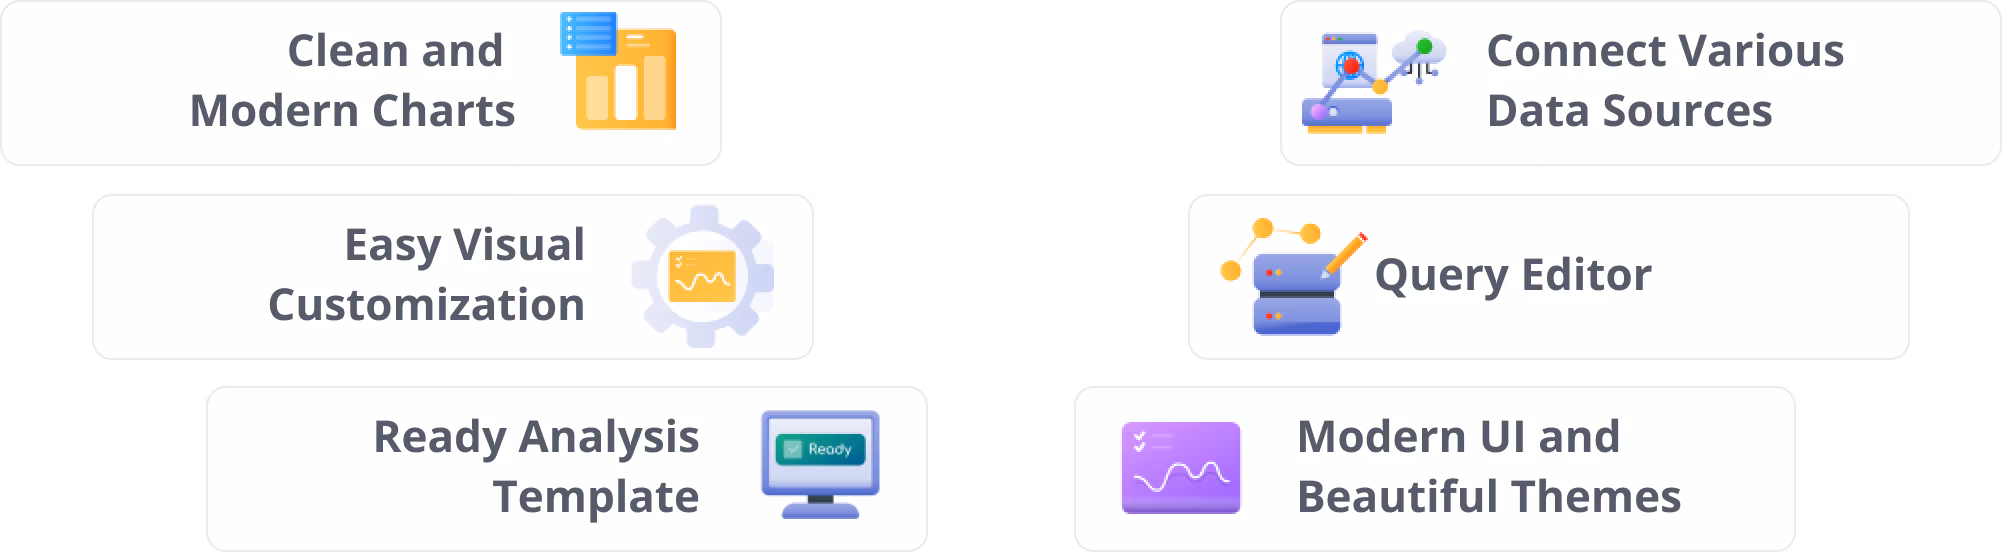
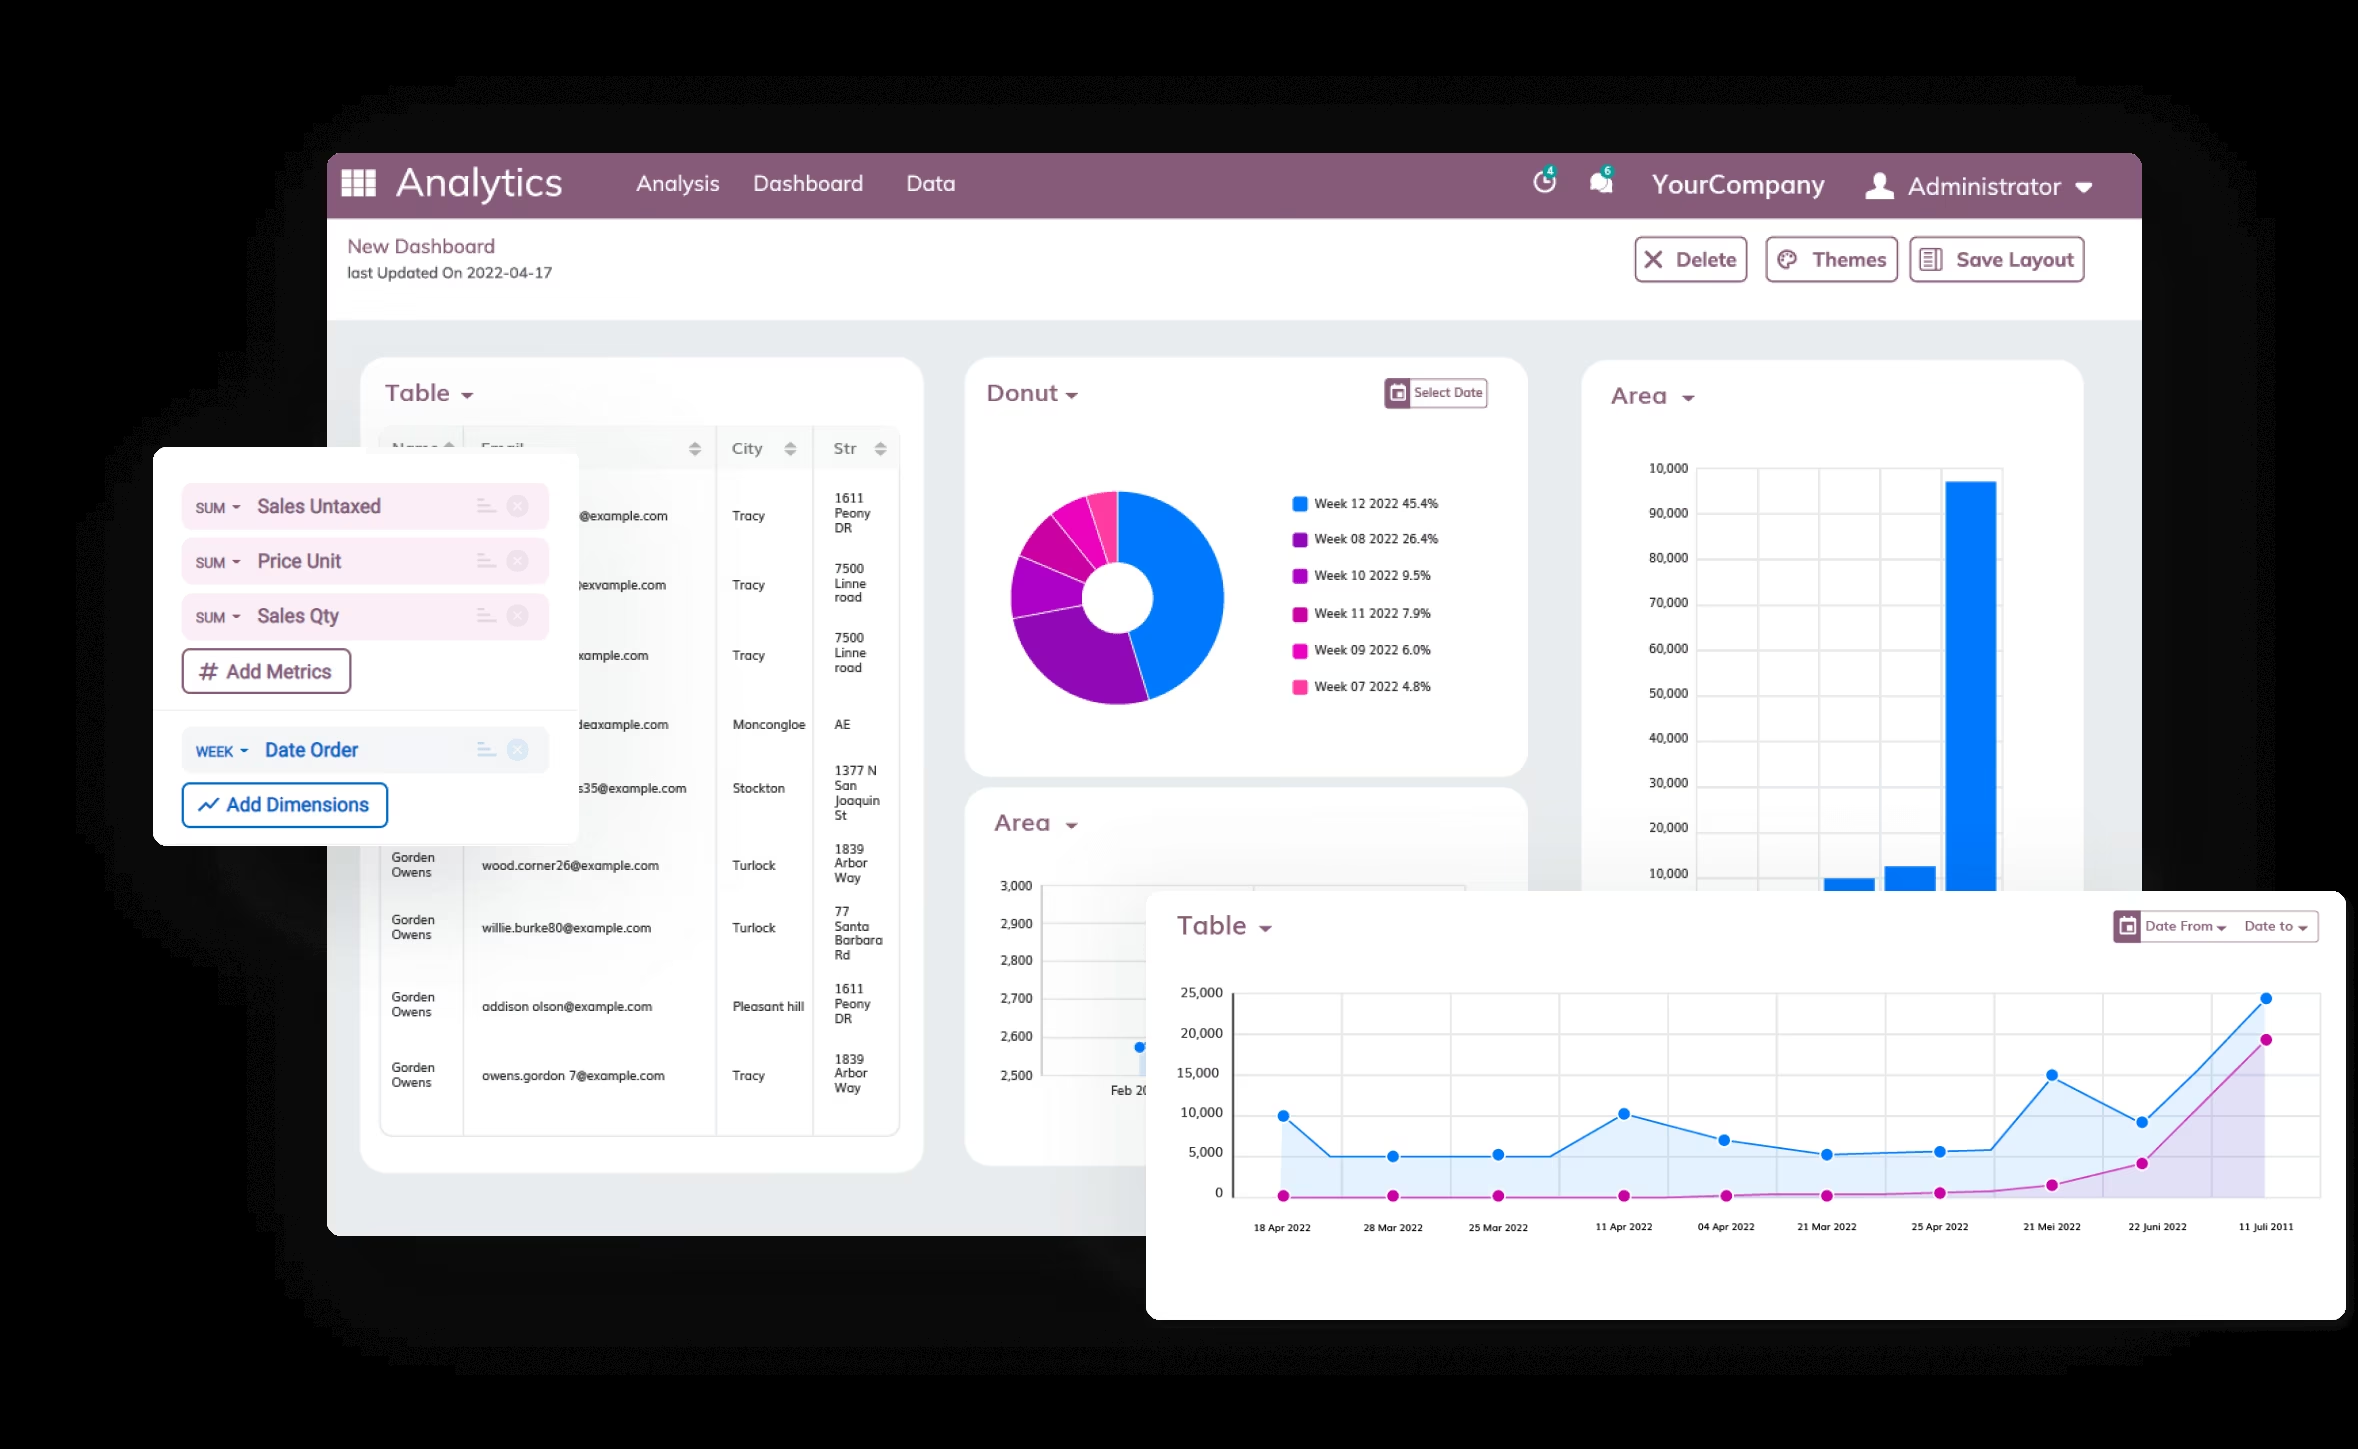
Clean & Modern Charts
for Your Business
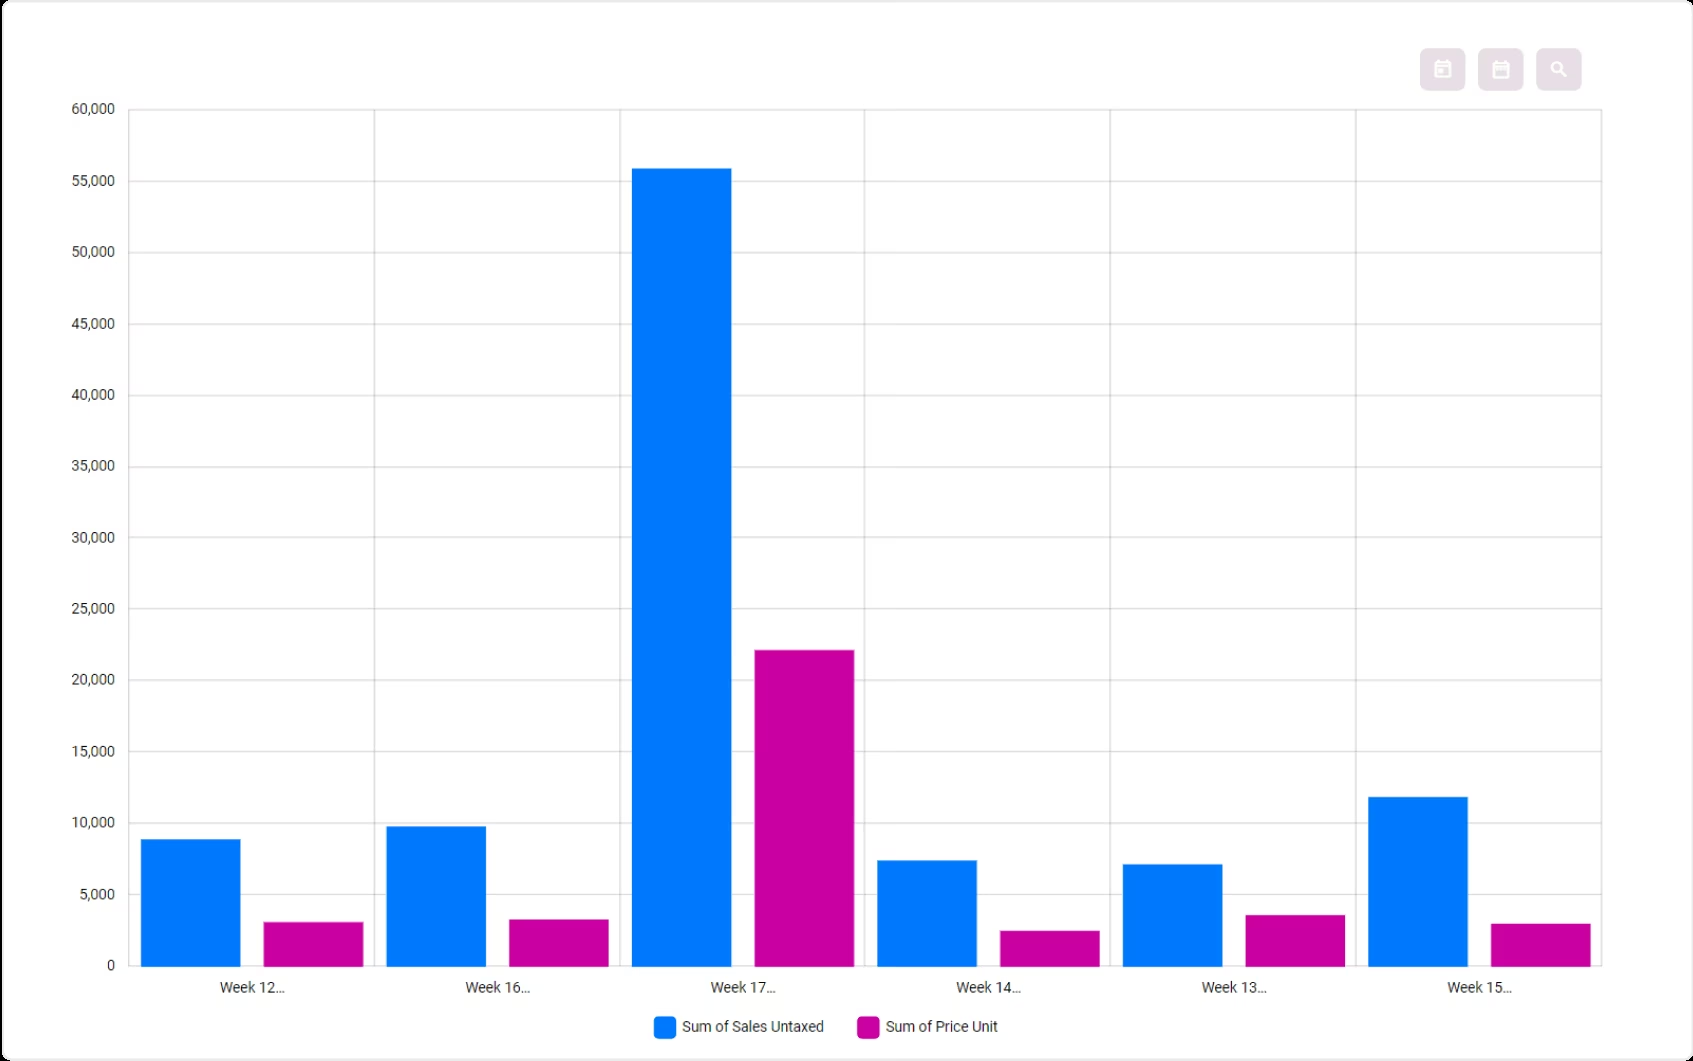
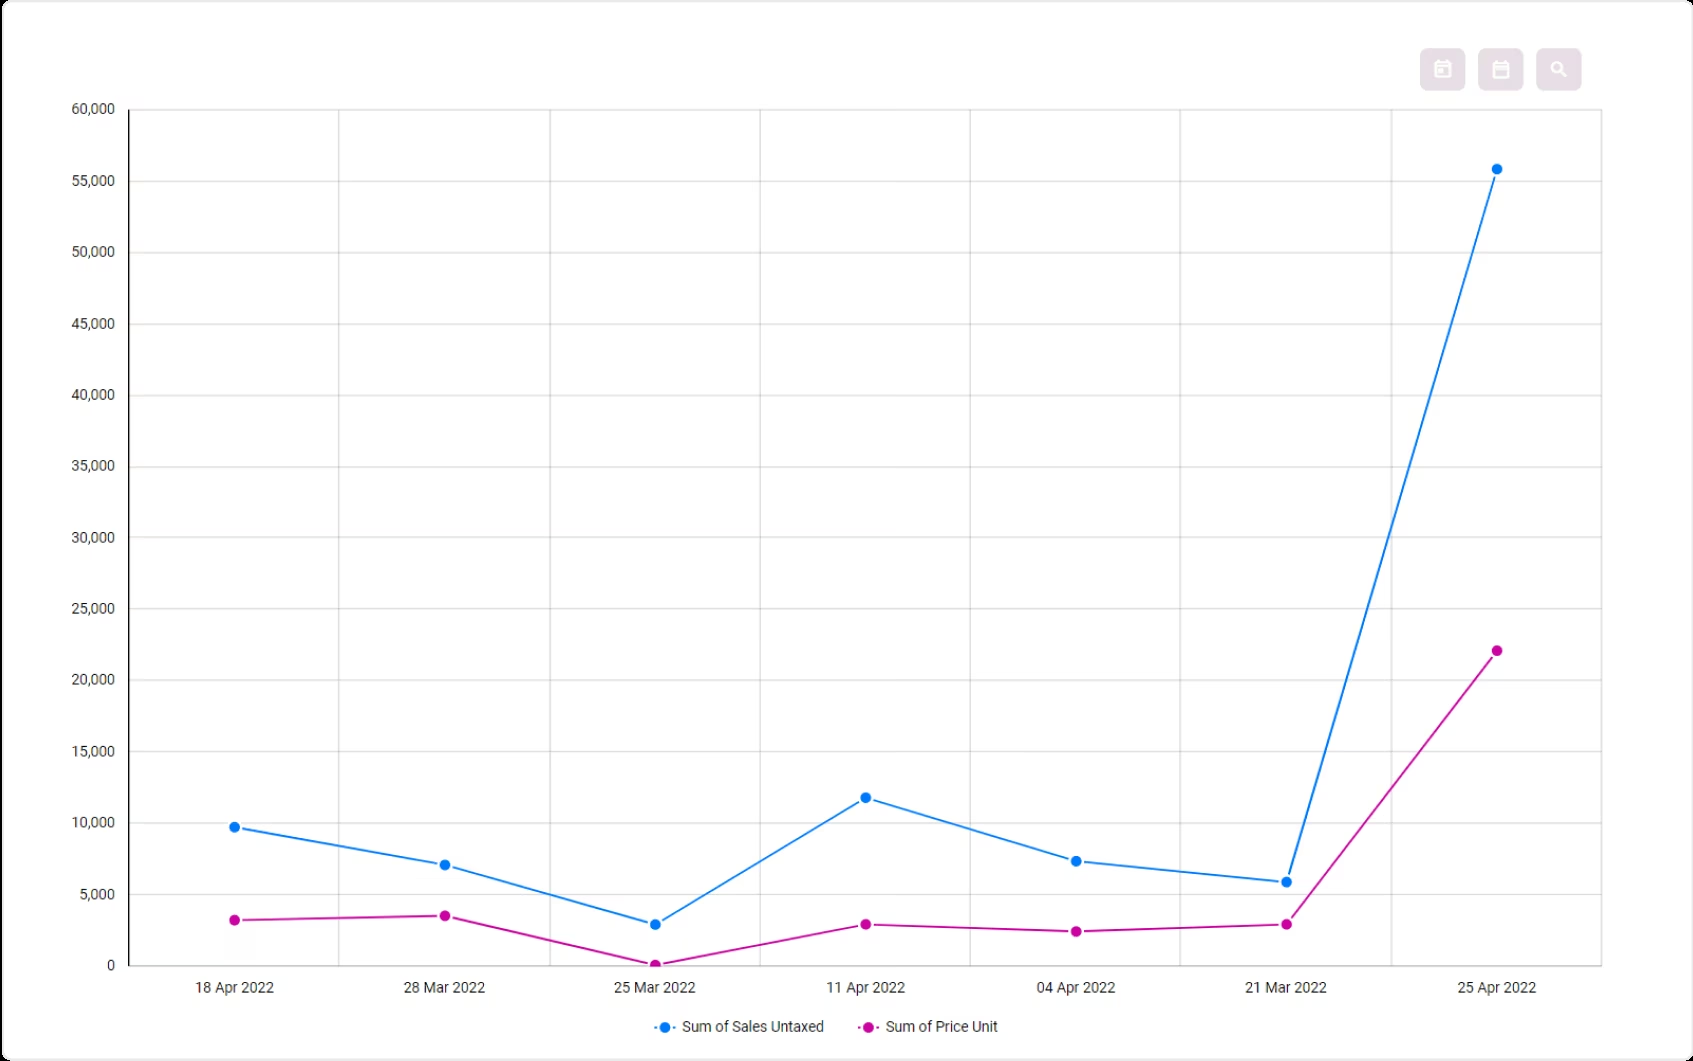
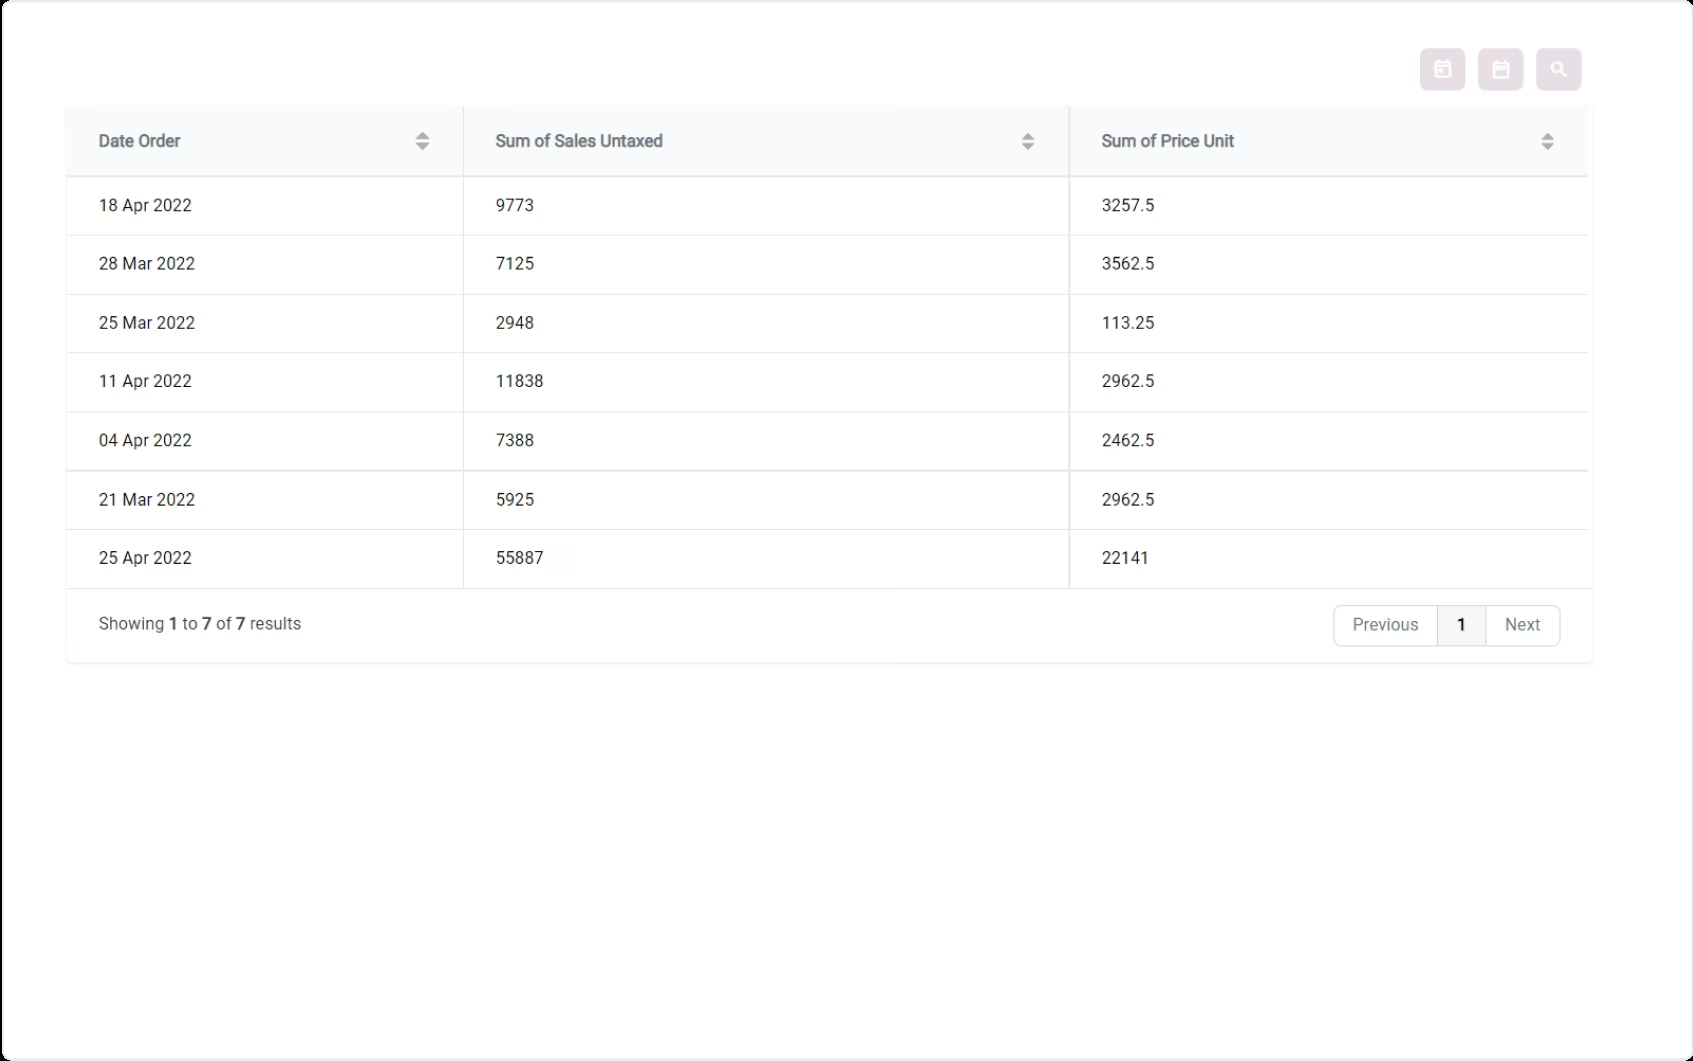
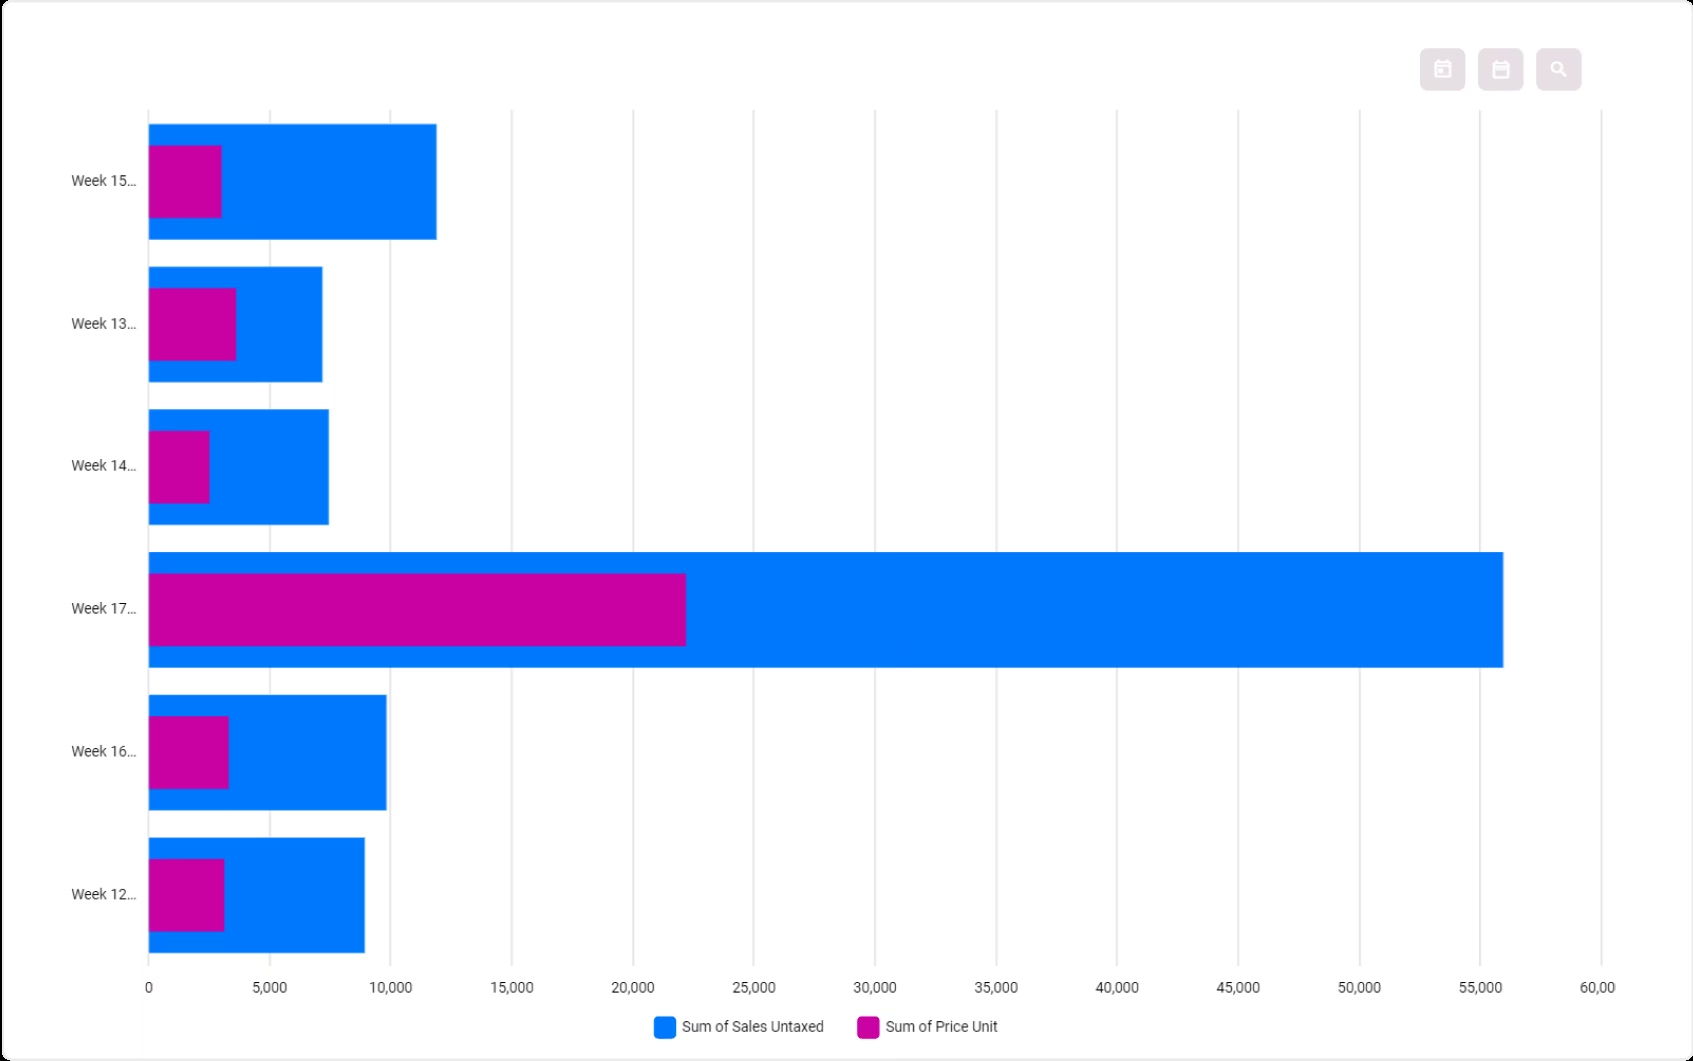
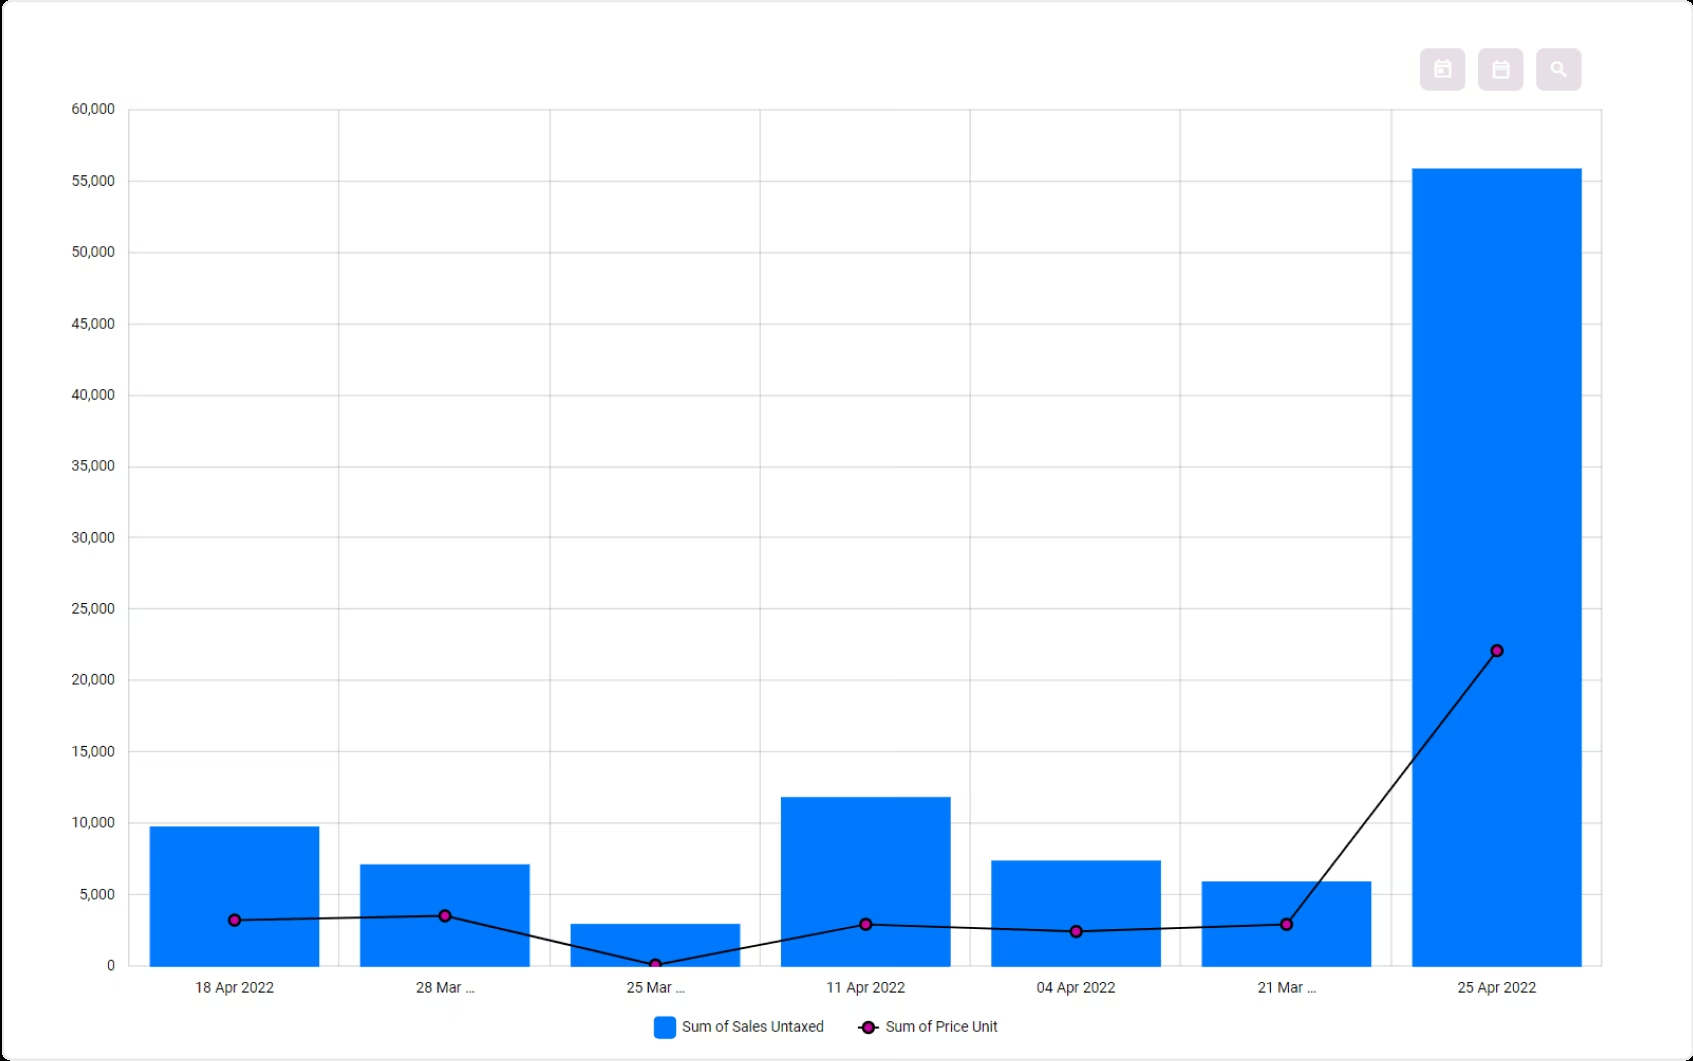
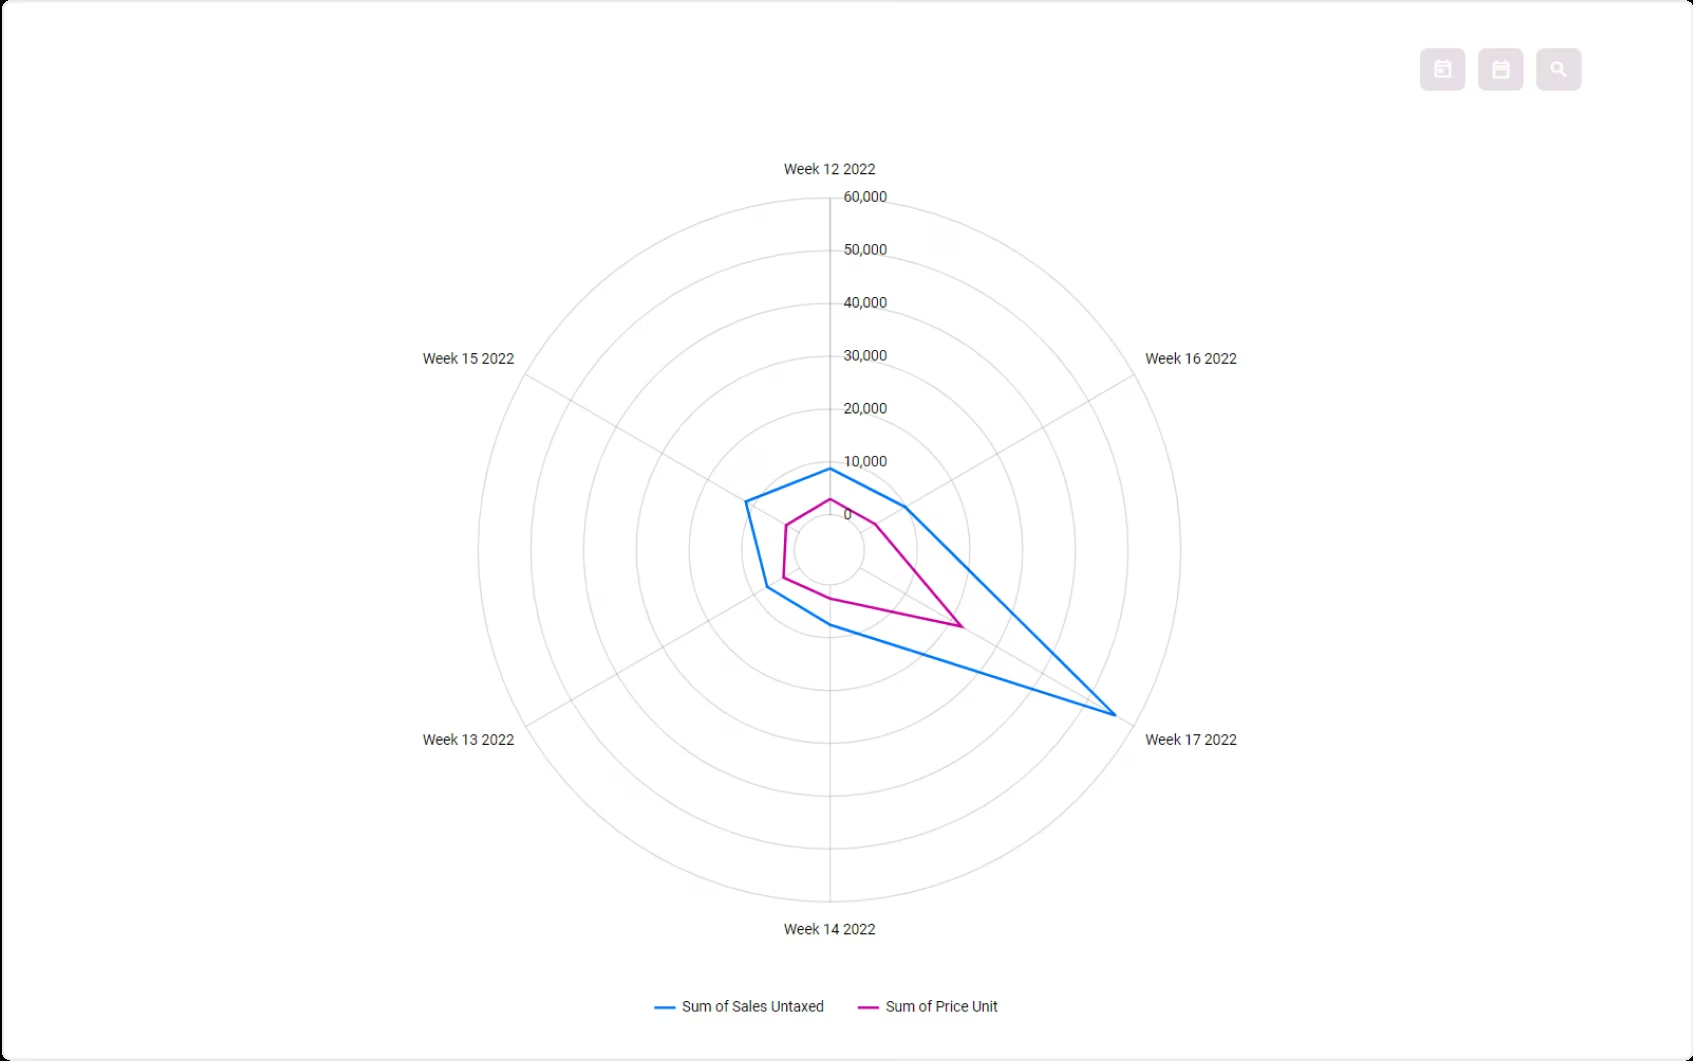
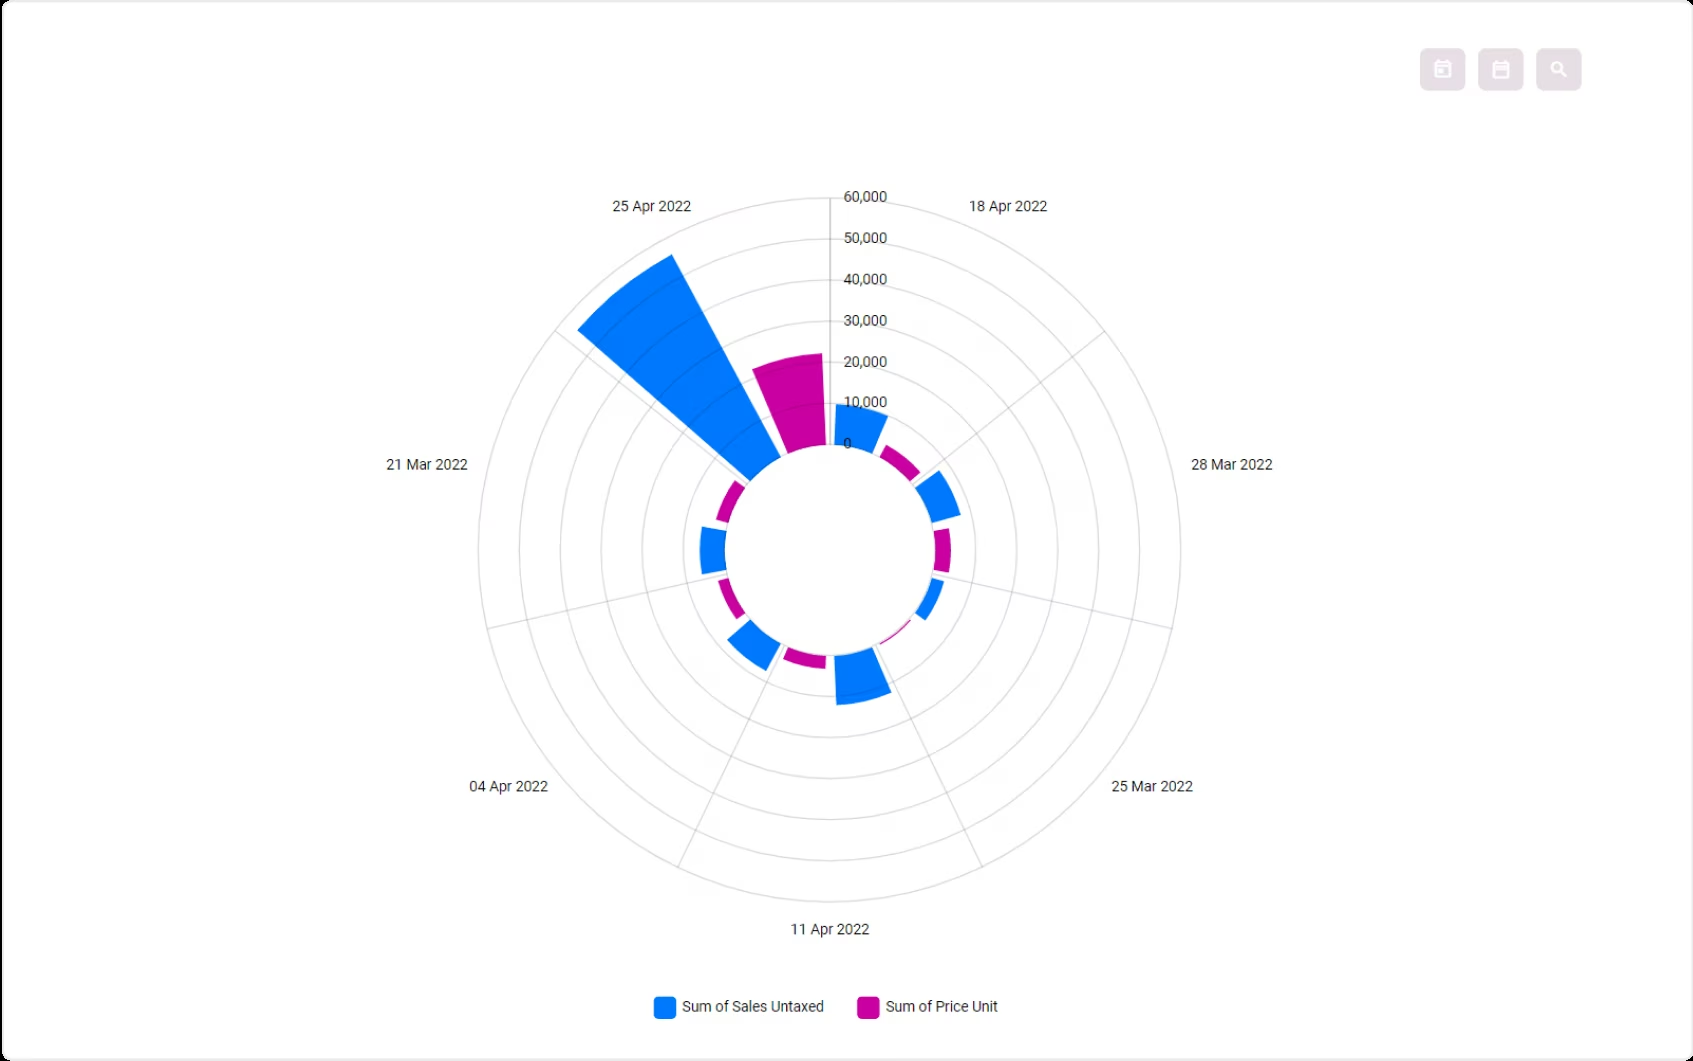
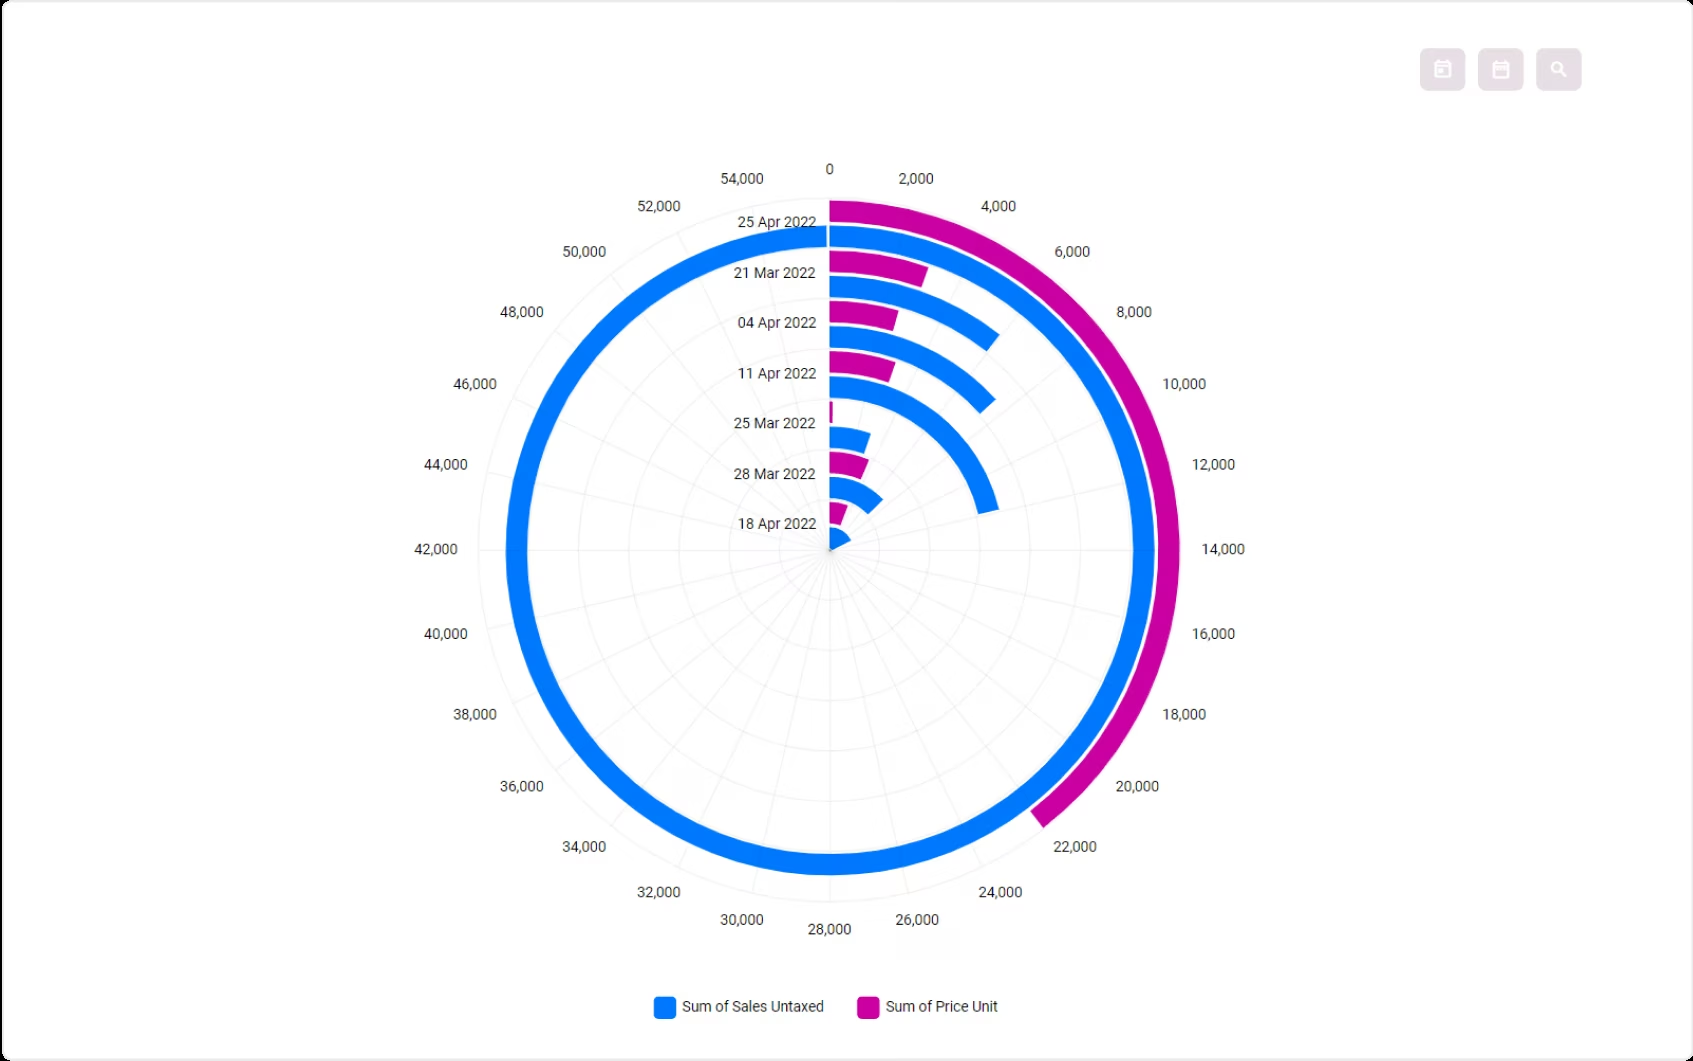
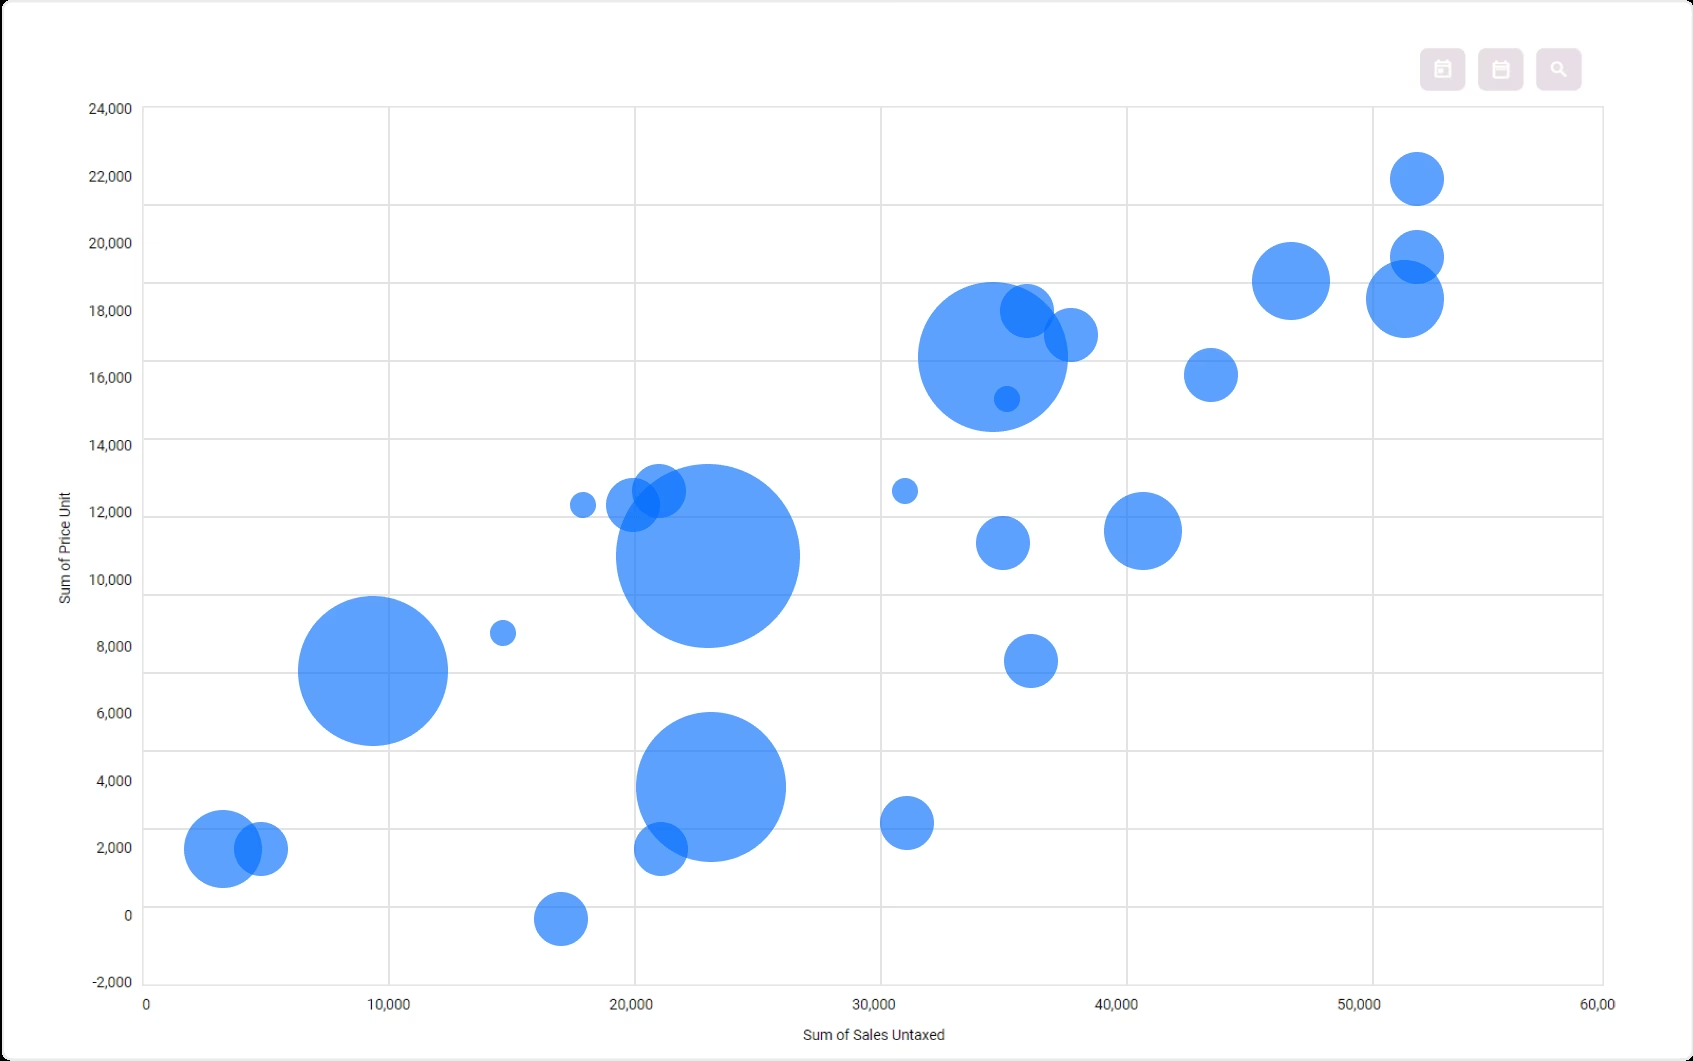
Many choices of visualization types. Table, Bar, row, line scatter, bullet, Bar Line chart, scorecard, etc.
Choose what visual you want and boom.. The chart will appear and your exploration begin !


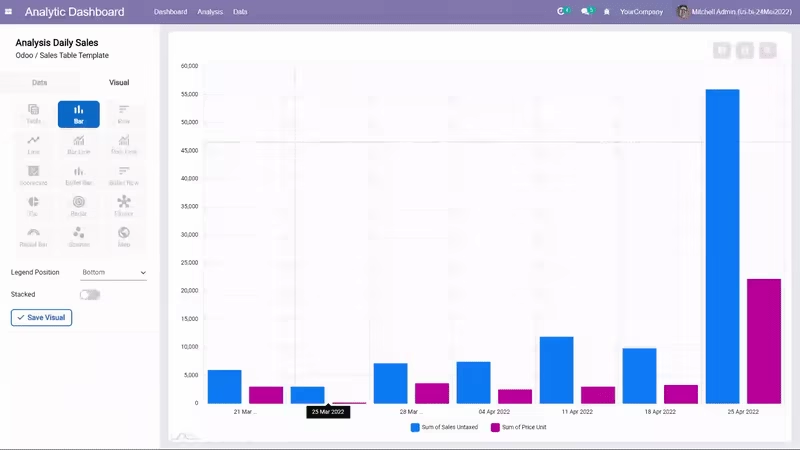
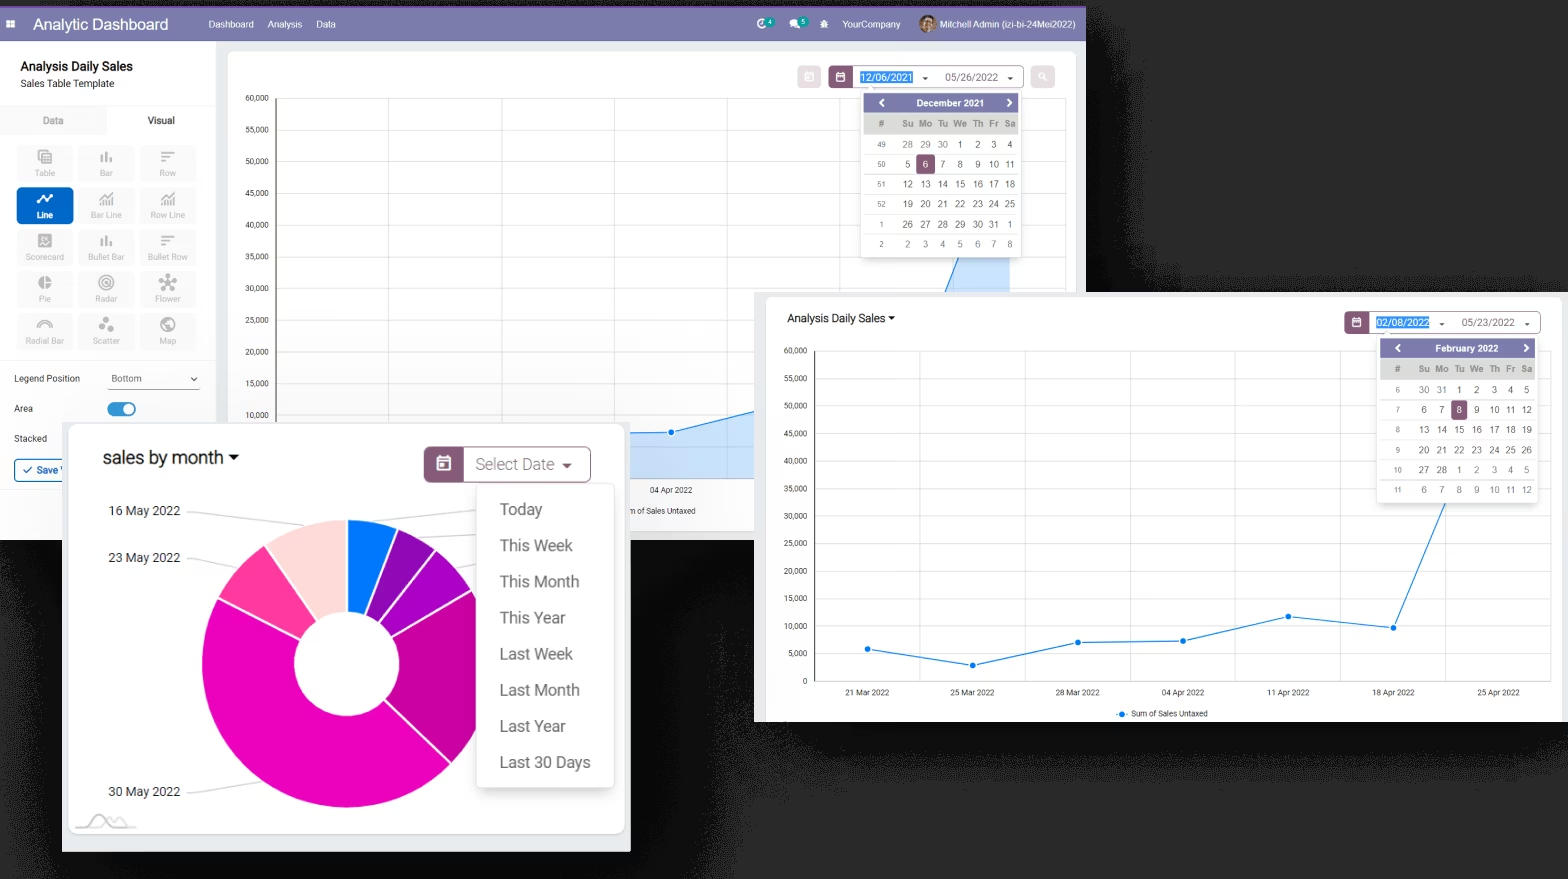
Easy Visual Customization
You can change the visual setting of an analysis by clicking the Visual tab.
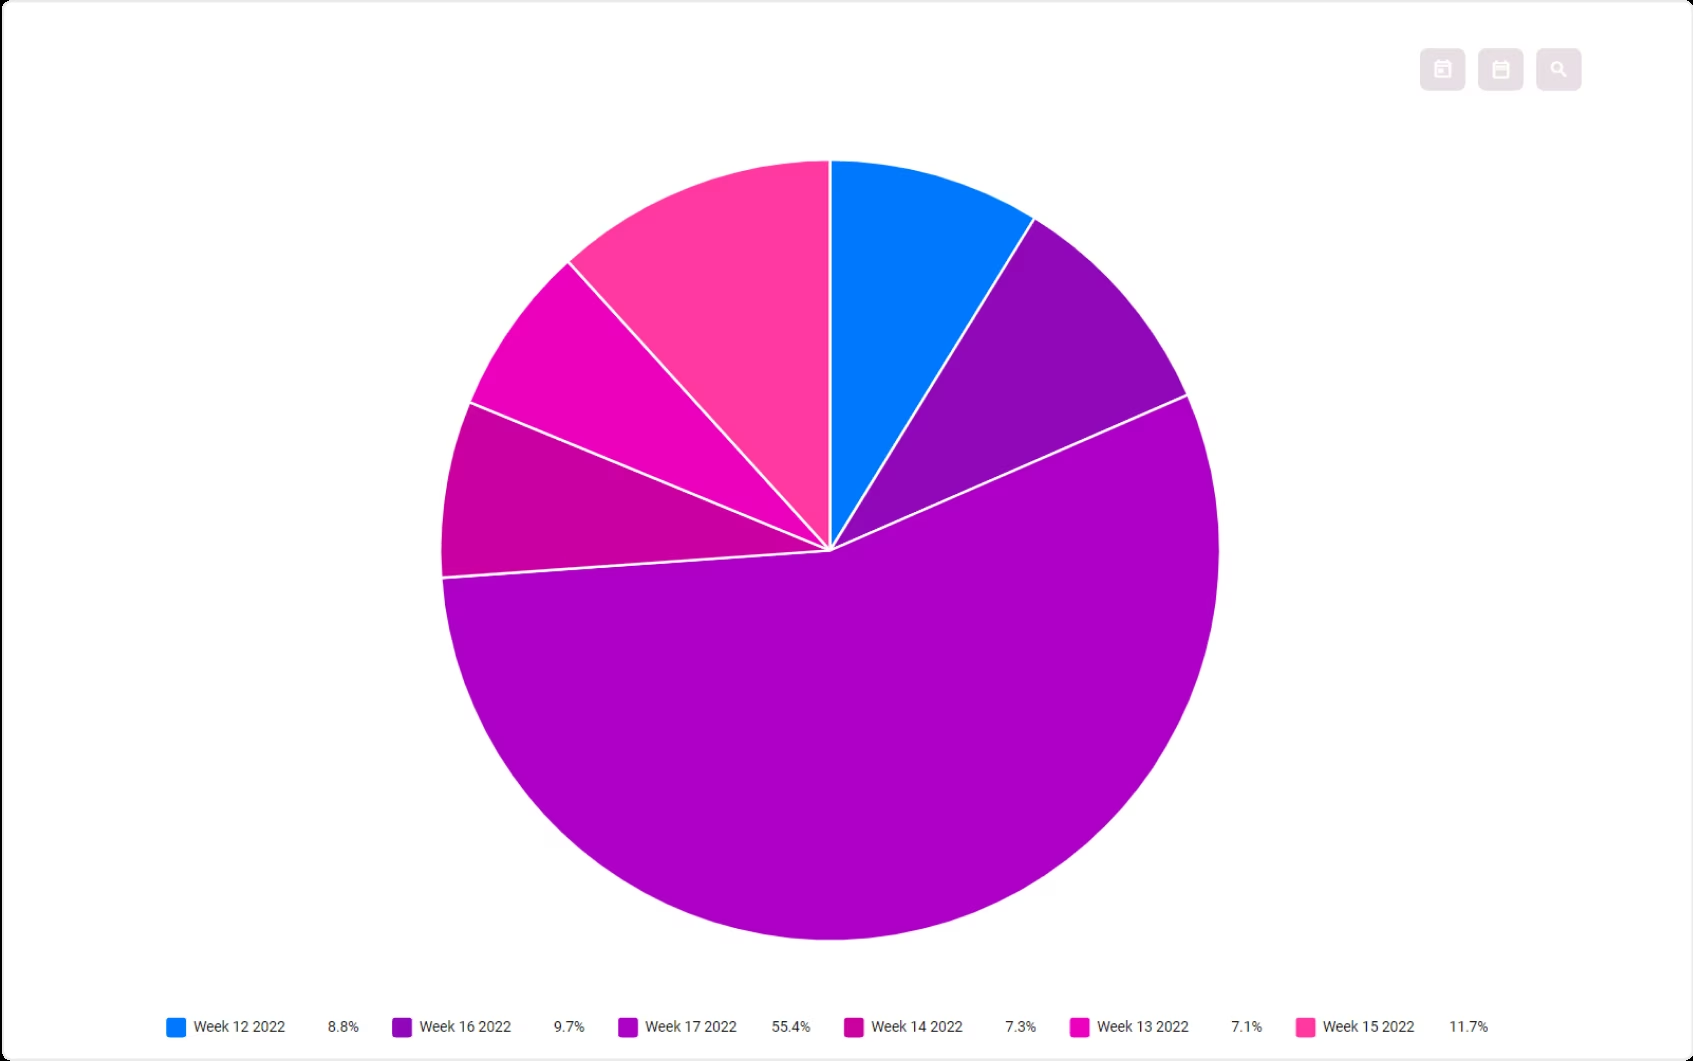
There are several visual types available and more will be added later.
Every visual can also be configured in more detail such as changing the radius of a pie chart, the position of the legends, etc. with the visual settings
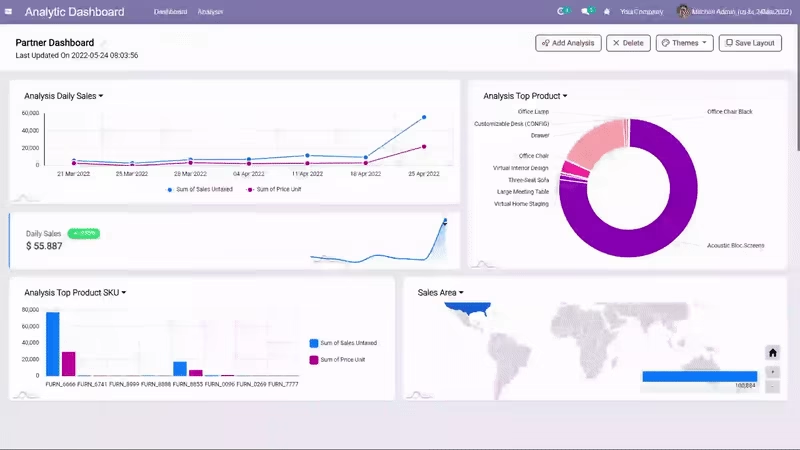
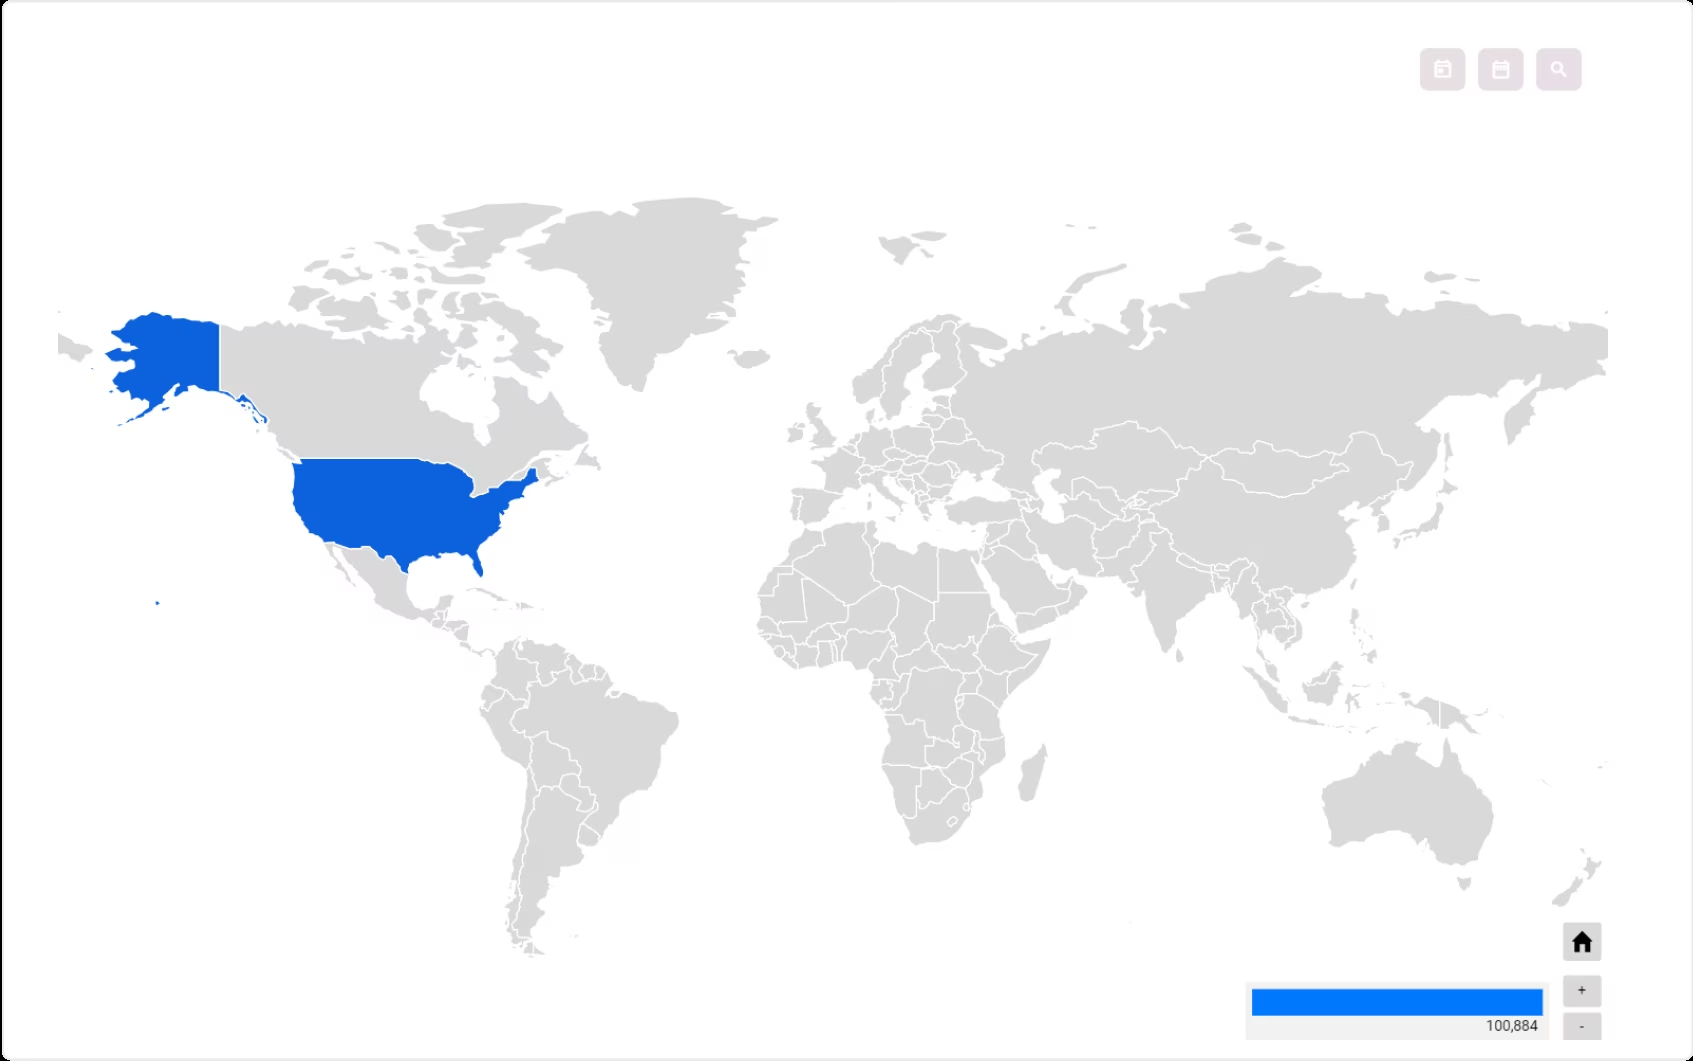
Make a Beautiful Dashboard
Chart position is dynamic. You can move, resize, edit and zoom in on the visual charts to see spesific data in detail.
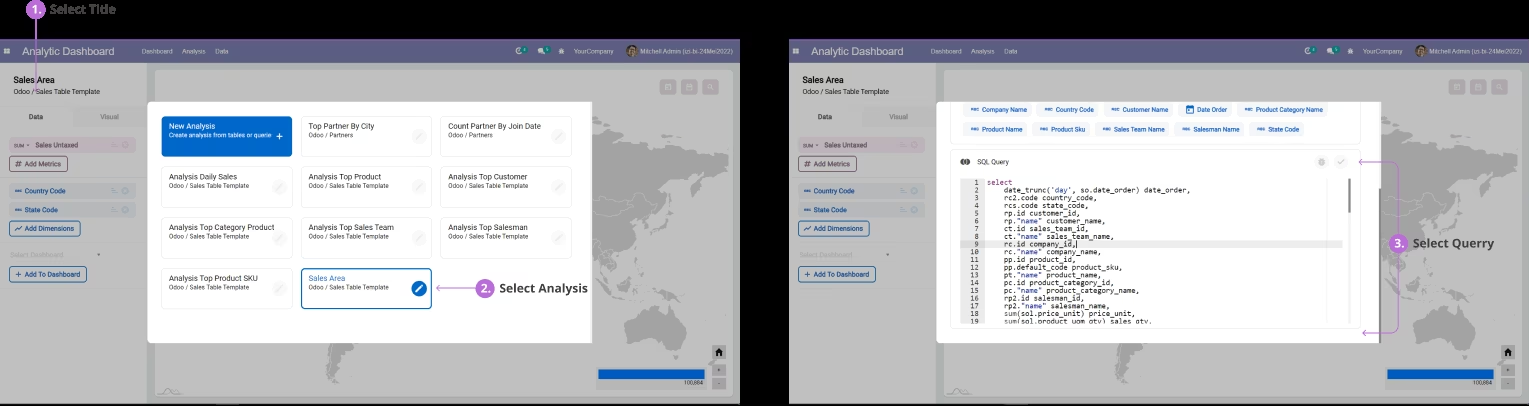
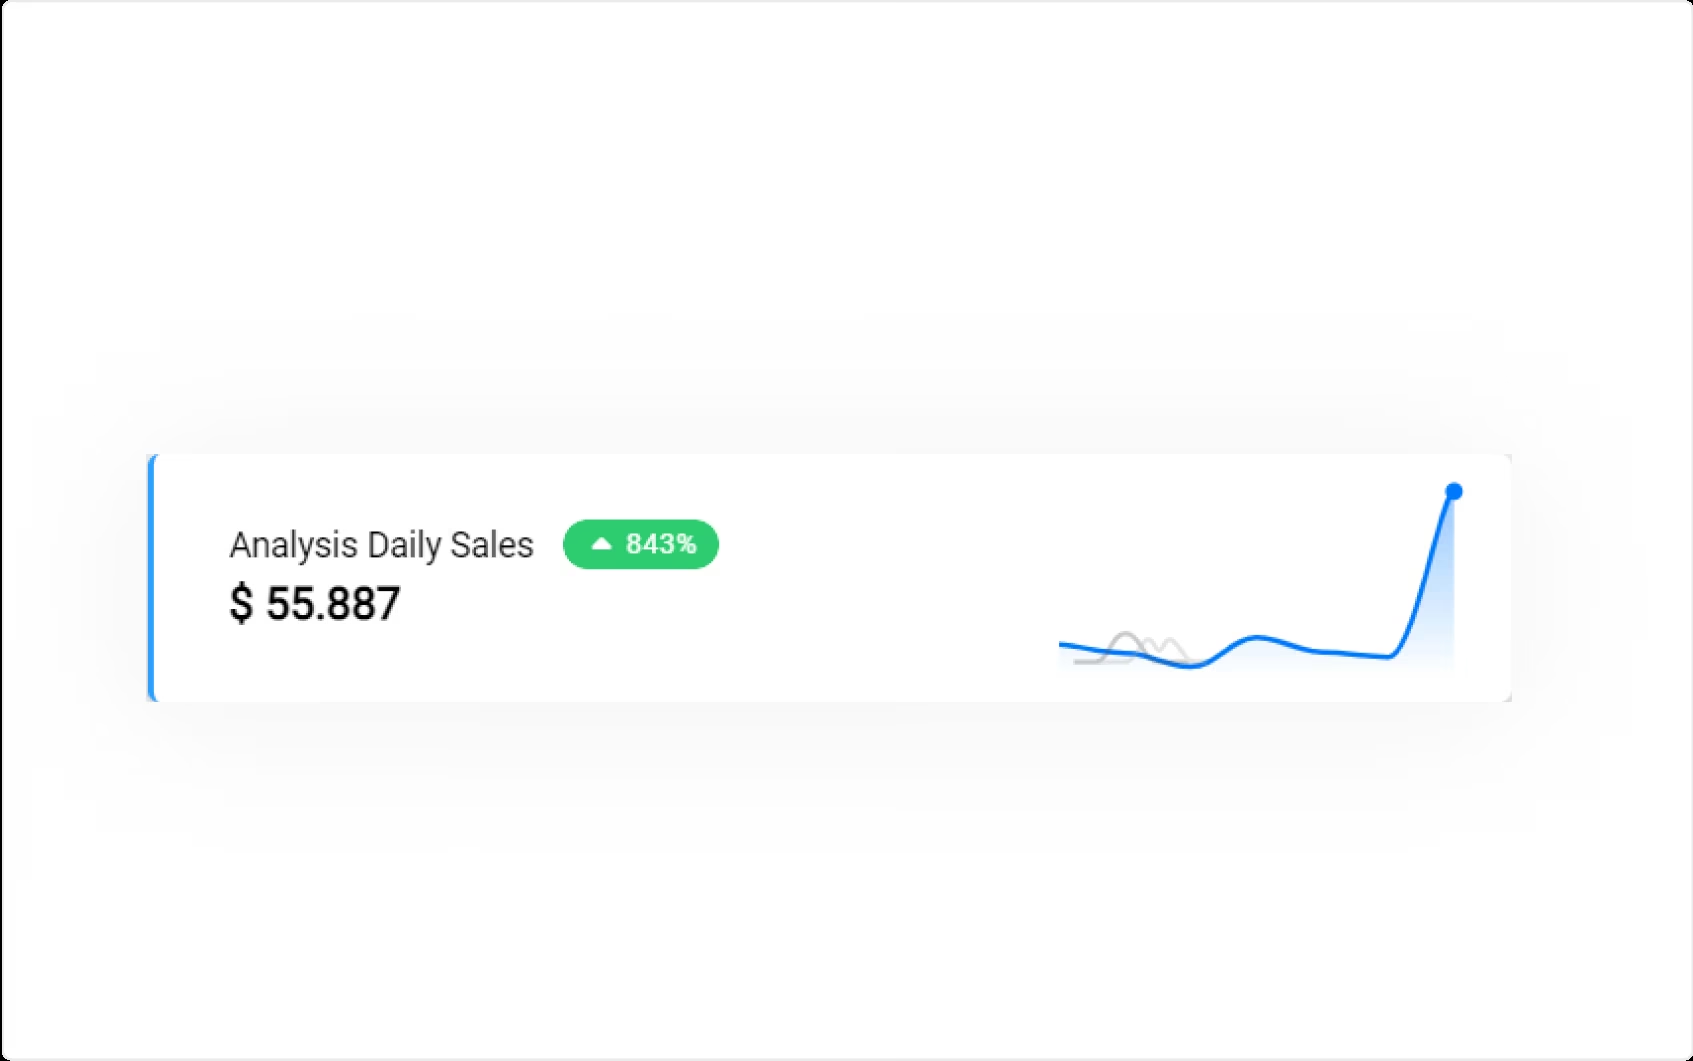
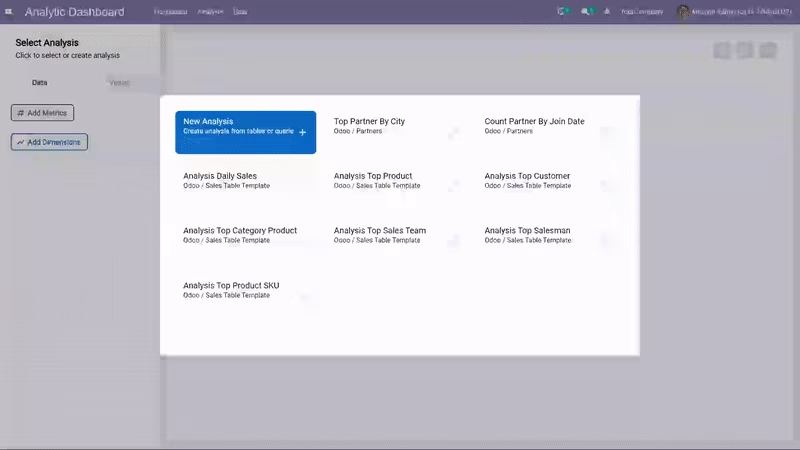
Ready Analysis Template
Even if you aren't an analyst, IZI Analytic Dashboard can make you feel like one.We provide some analysis business templates for you.
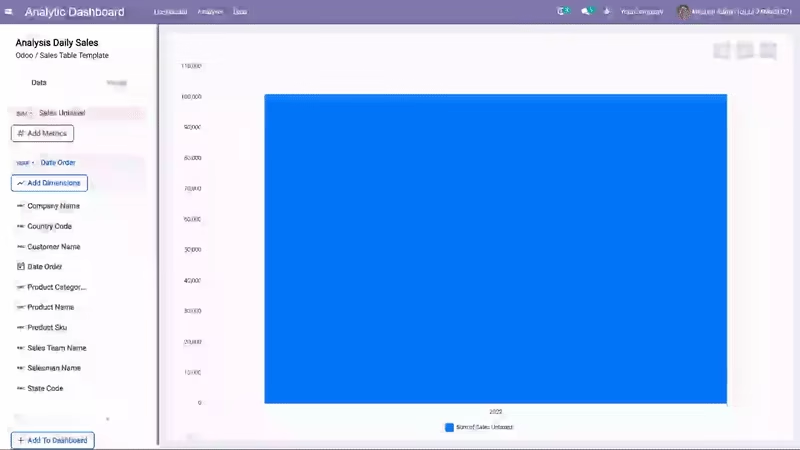
Easily Set the Metrics and Dimensions of an Analysis
All the fields from the analysis table will appear on the left panel. You can easily setup your metrics and dimensions by clicking on them.
You can also set the order (ascending or descending), the calculation applied for the metrics, and the format for each dimensions.
Dynamic Filters
Filters can be dynamically added in the analysis to make data exploration easier.You can still play with the filter in the dashboard view, on the top right of the chart.
Free Themes
Free multi-colored themes spesial for you added to your dashboard. Just choose the theme you want and the theme will appear.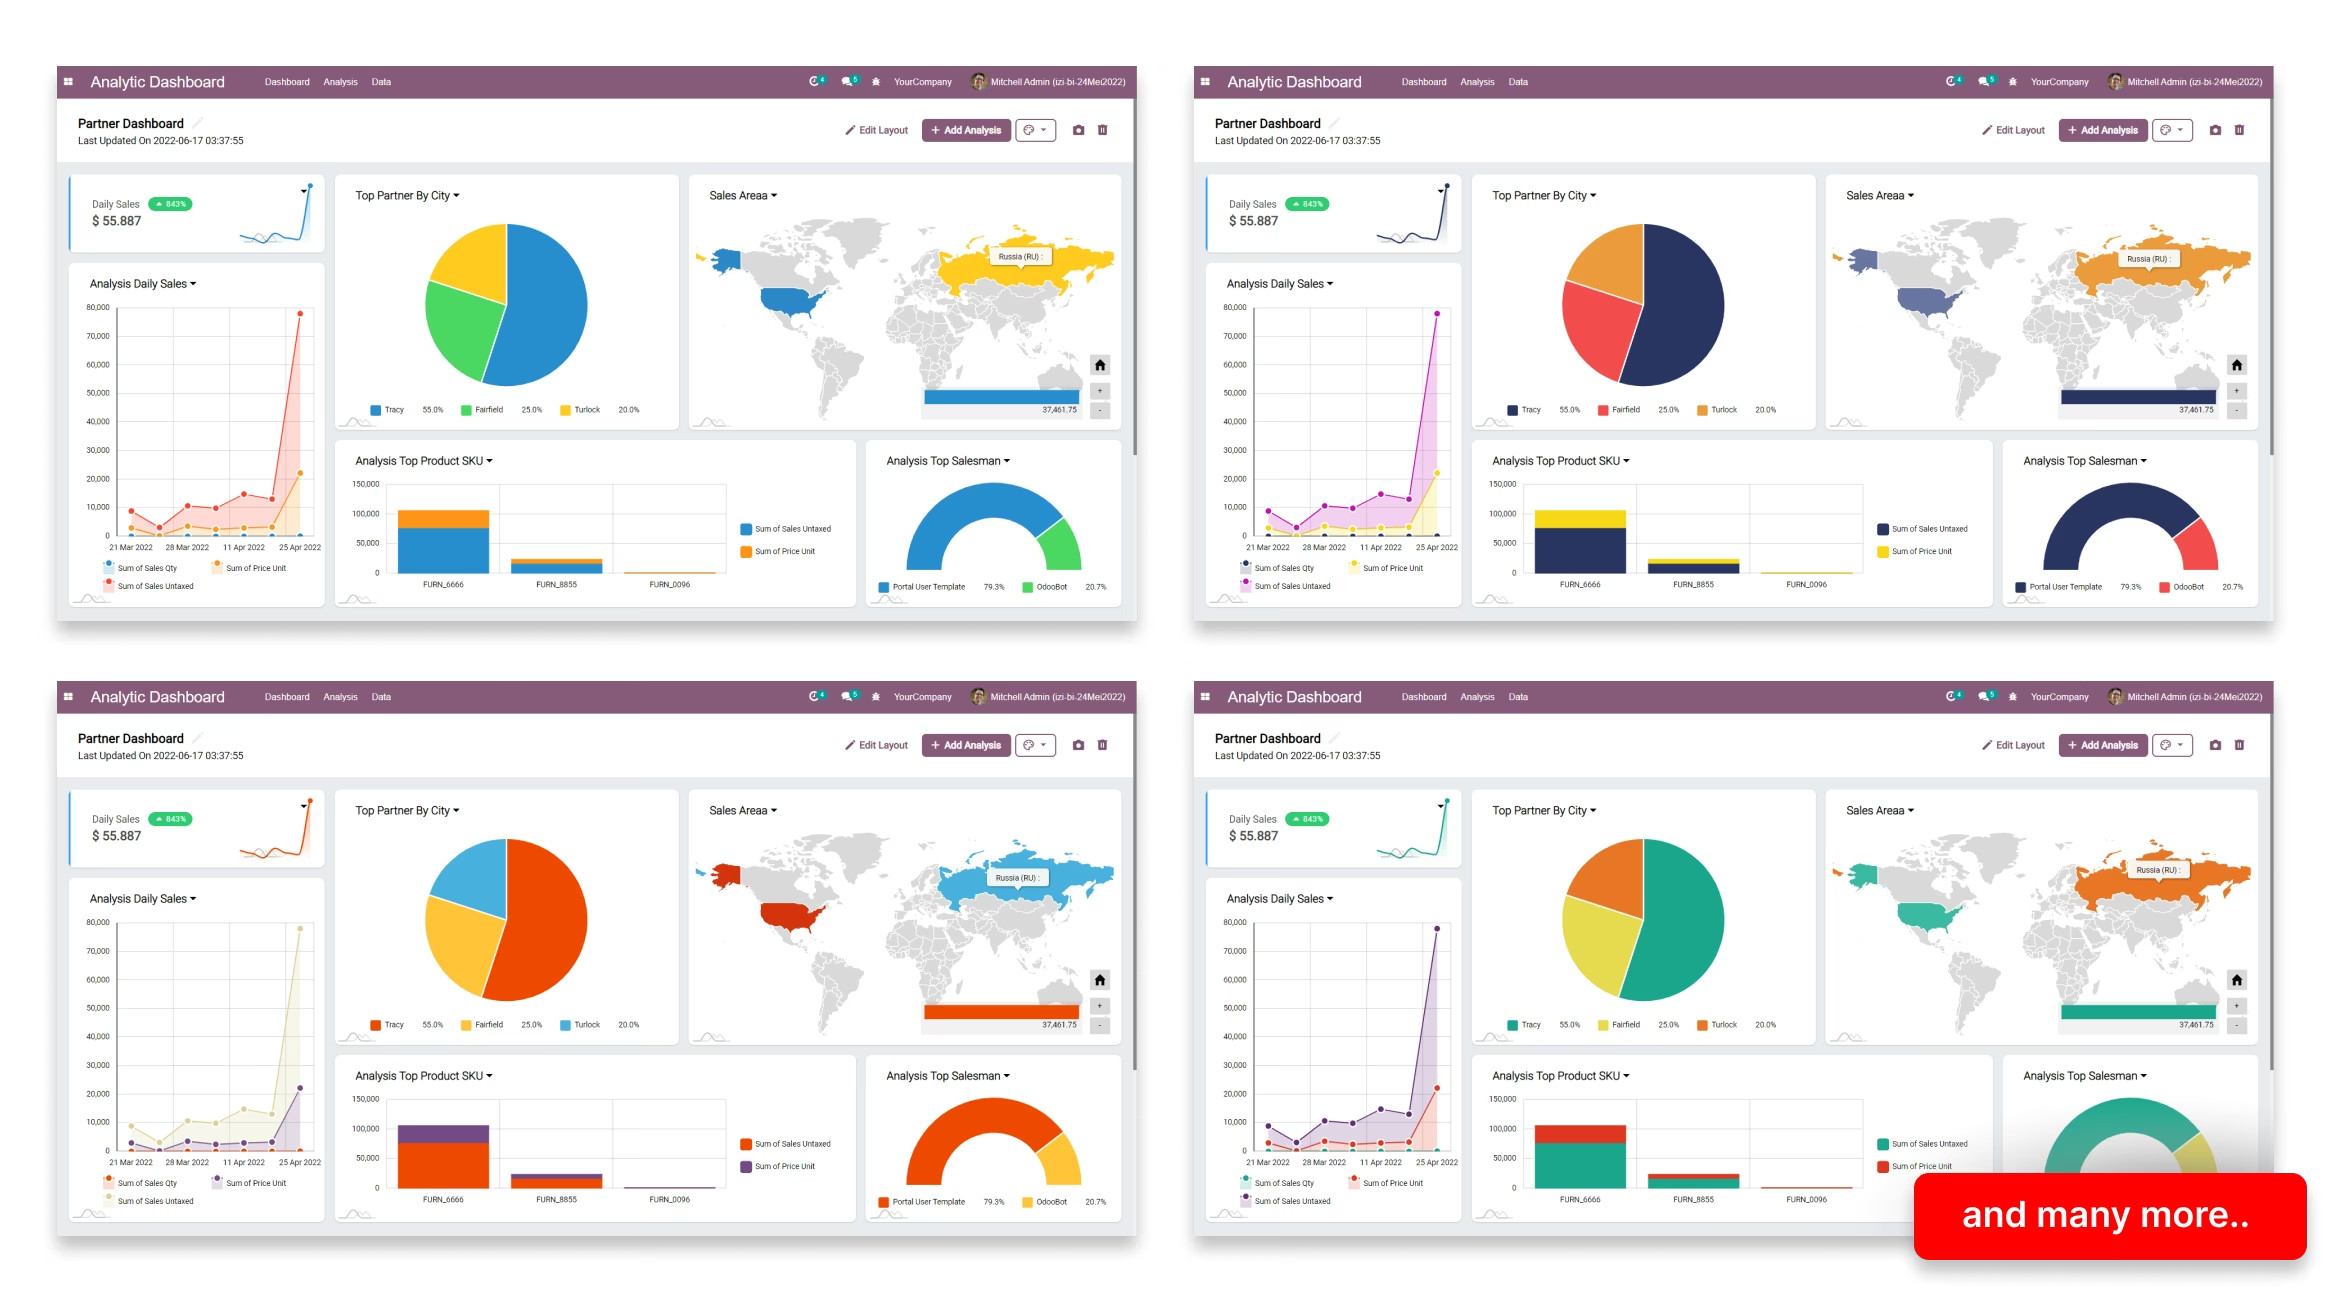
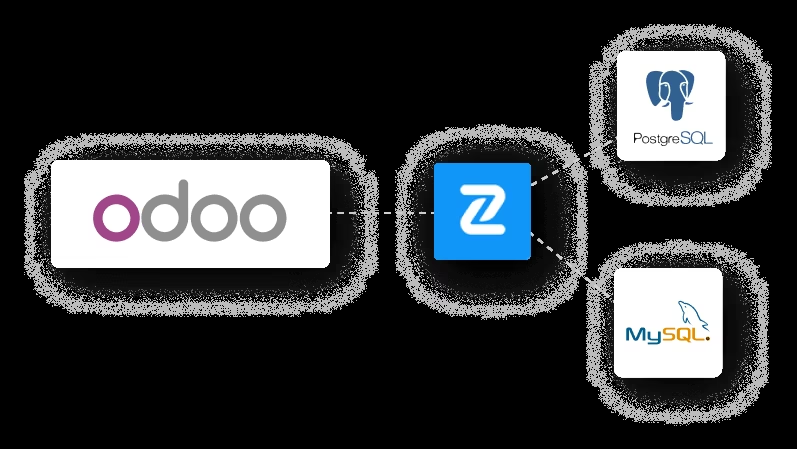
Explore Various Data Sources
Extract data from various data sources, not only Odoo. Currently, we have data source connectors
to External PostgreSQL and MySQL Databases.
We will add more connectors to access other types of databases, data files and external applicationAPIs.
Unlock The Power of Queries
Working with something really complex ?No problem, there's a full editor for those who prefer to write their own SQL.
If you want to modify the data query, you can edit the analysis and input the new query there.