Transform your financial data into a powerful decision-making tool with the Account Dashboard. This intuitive and interactive module provides a comprehensive, at-a-glance overview of your company's financial health, bringing key metrics and insights to the forefront. With its dynamic charts, graphs, and customizable widgets, the Account Dashboard allows you to visualize your accounting data in real-time, enabling you to make faster, more informed decisions. From tracking sales and purchases to monitoring cash flow and profitability, this dashboard is the ultimate tool for strategic financial management.
Key Features
Interactive Financial Dashboard: A dynamic and user-friendly dashboard that provides a complete overview of your company's financial performance.
Data Visualization: Utilizes a variety of charts and graphs to present your accounting data, including sales, purchases, and profitability, in an easy-to-understand format.
Real-Time Data: Access up-to-the-minute information on your financial performance, including key metrics like open invoices, receivable amounts, and cash and bank balances.
Customizable Layouts: Tailor the dashboard to your specific needs by configuring the layout, colors, and the information displayed.
Drill-Down Capabilities: Dive deeper into your data with interactive, drill-down charts that allow you to view the underlying details with a single click.
Comprehensive Analytics: Analyze trends, track performance, and gain valuable insights into your financial operations.
Multi-Company Support: A single dashboard to monitor and compare the financial performance of multiple companies.
Benefits
Improved Financial Visibility: Gain a clear and comprehensive overview of your company's financial health from a single screen.
Enhanced Decision-Making: Make faster, more informed decisions with real-time, visualized financial data.
Increased Efficiency: Save time and reduce administrative overhead with a centralized and automated financial dashboard.
Proactive Financial Management: Identify potential issues and opportunities with proactive monitoring and analysis of your financial data.
Better Performance Tracking: Track the performance of your sales teams, top customers, and revenue-generating products.
User-Friendly Analytics: An intuitive and easy-to-use interface that makes financial analysis accessible to users of all technical levels.
Account Dashboard Onvodo®
Key Features
-
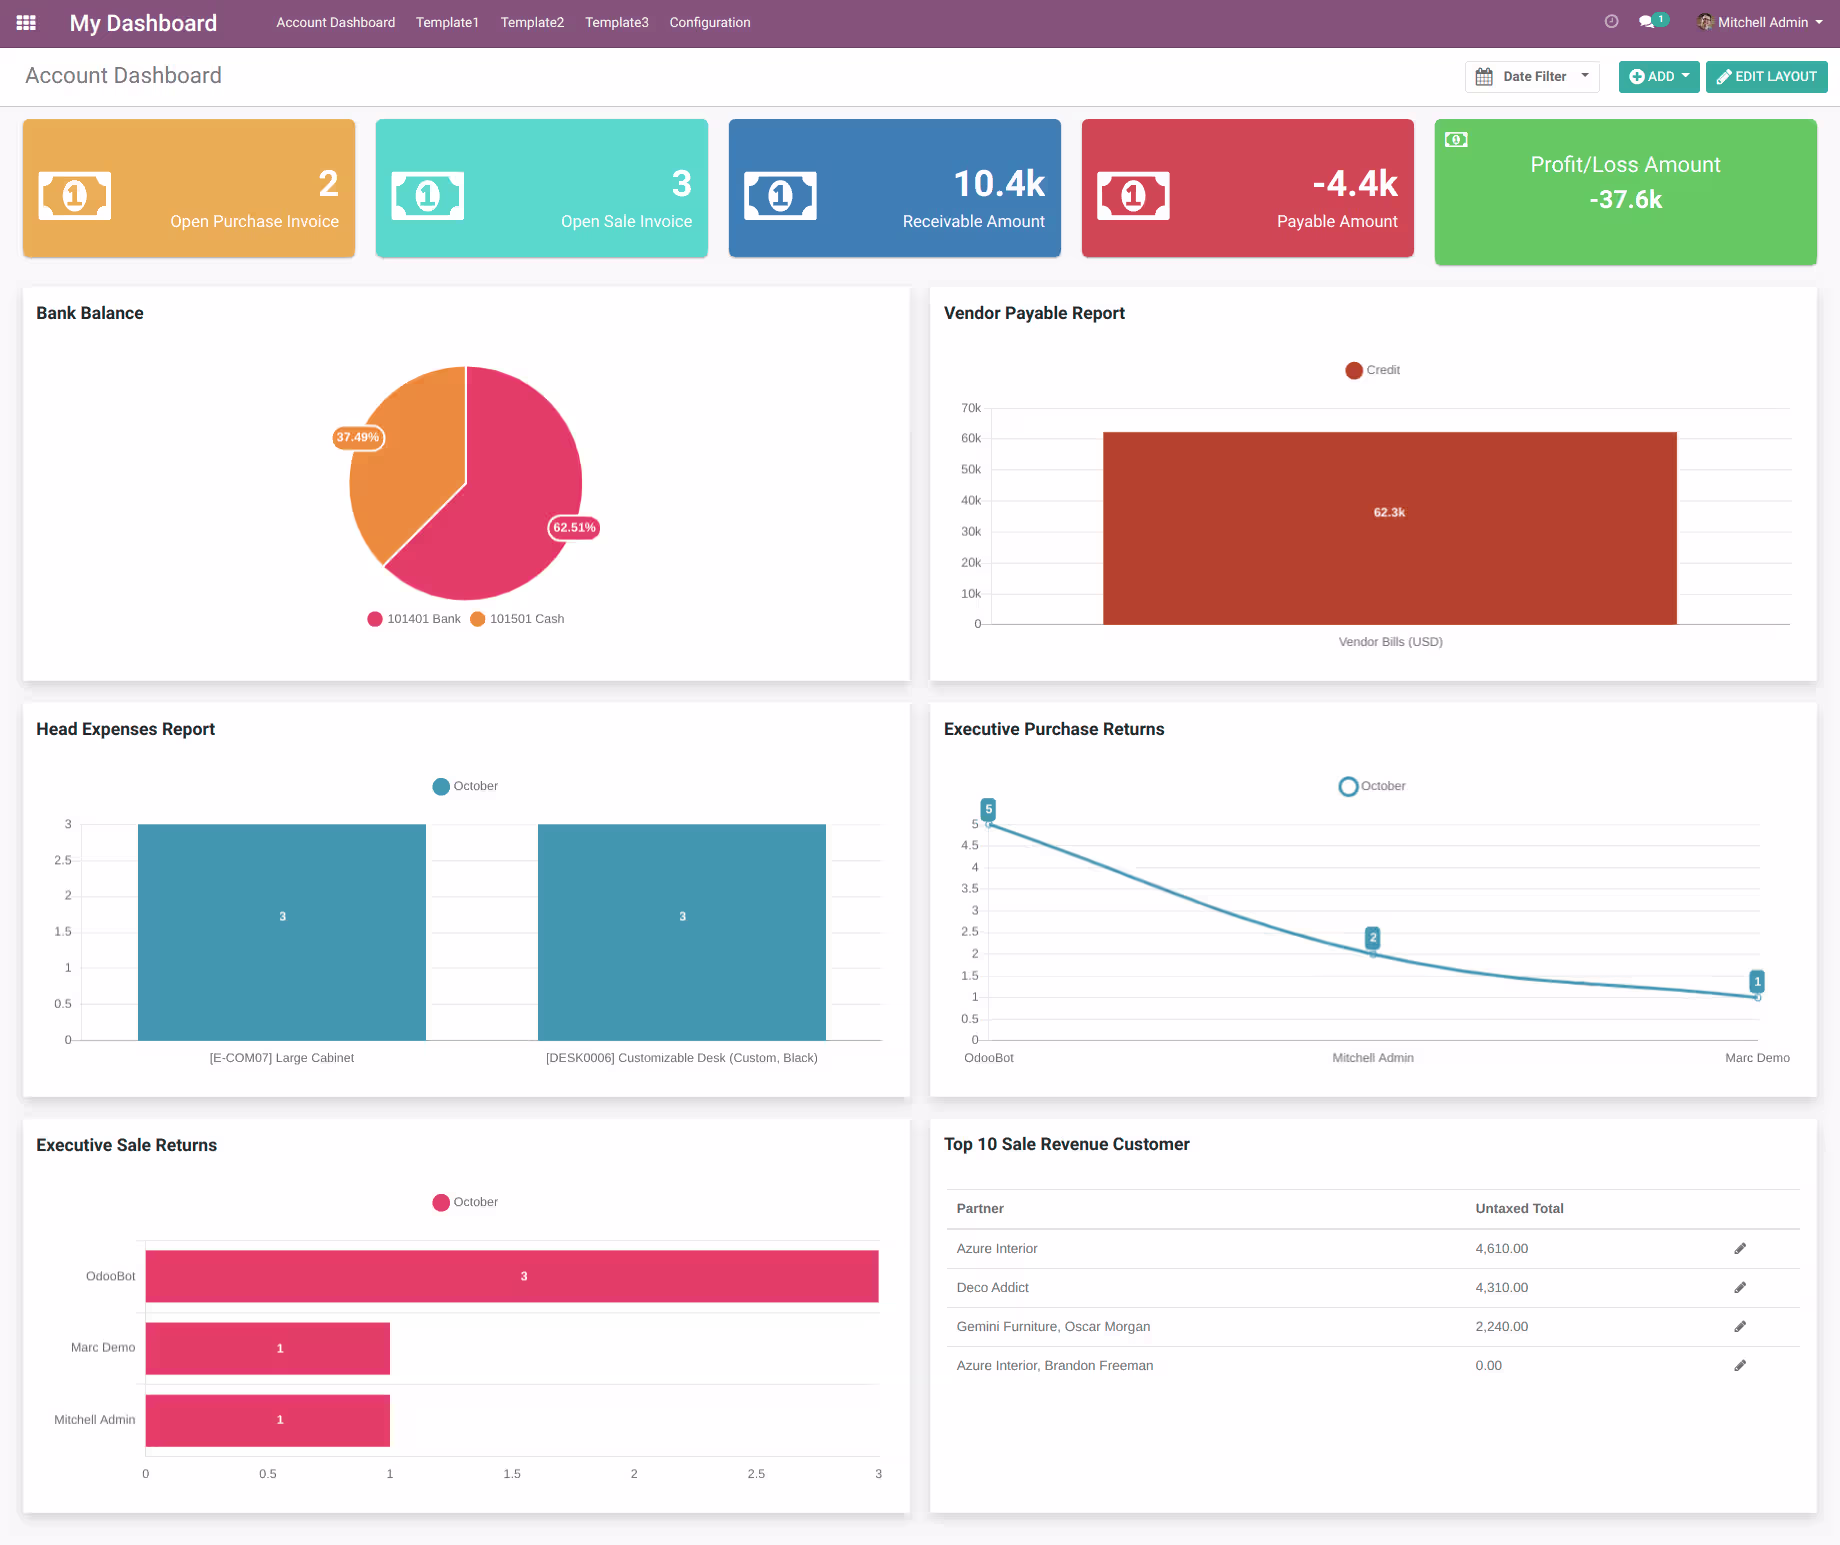
Open Purchase Invoice (Tile): Display Count of Open Purchase Invoice

-
Receivable Amount (Tile): Display Receivable Amount
-
Payable Amount (Tile): Display Payable Amount
-
Open Sale Invoice (Tile): Display Count of Open Sale Invoice
-
Bank Balance (Pie Chart): Display Bank Balance
-
Vendor Payable Report (Bar Chart): Display Vendor Payable Report
-
Head Expenses Report (Bar Chart): Display Head Expenses Report
-
Executive Sale Returns (Horizontal Chart): Display Executive Sale Returns
-
Executive Purchase Returns (Line Chart): Display Executive Purchase Returns
-
Profit/Loss Amount (Kpi): Display Profit/Loss Amount
-
Top 10 Sale Revenue Customer (List View): Display Top 10 Sale Revenue Customer